1. Because not all paparazzis are evil!
| If you are looking for the source code for the software of this project, jump right to this link. |
Geopaparazzi is a tool developed to do very fast qualitative engineering/geologic surveys and GIS data collection.
Even if the main aim is in the field of GIS data collection, it contains tools that can be of great use also to OpenStreetMappers as well as tourists that want to keep a geo-diary.
The main aim of Geopaparazzi is to have a tool that:
-
fits in any pocket and can be always at hand, when needed
-
gives the possibility to take geo-referenced and possibly orientated pictures during a survey, with further possibility to import them into GIS applications like gvSIG
-
is able to easily exploit an Internet connection, if available
-
is extremely easy to use and intuitive, providing just few important functions
The main features available in Geopaparazzi are:
-
geo-referenced notes
-
geo-referenced and oriented pictures
-
gps track logging
-
form-based data surveys
-
easy export of collected data
-
a map view for navigation with support for
-
local (on-device) and remote (Internet-based) raster and vector tiles
-
spatialite vector data
-
| Geopaparazzi is available only for the Android Operating System. |
1.1. License
Geopaparazzi source code is licensed under the GNU General Public License, Version 3
1.2. Community
Find out the latest Geopaparazzi news.
Join the Geopaparazzi user’s discussion!
And there’s a group for Geopaparazzi developers too.
You can even contribute to this Geopaparazzi manual!
1.3. Translations
Geopaparazzi has already been translated in several languages.
Do you want to see Geopaparazzi in your language? With transifex it is a simple task.
Check out the translation page and send us your contributions.
1.4. Need help?
Subscribe to the mailinglist, we are here to help you!
We also have a mailinglist for developers.
1.5. Found bugs?
If you found a bug, please report it in our issue tracker. We will check it and work on it as soon as we can.
1.6. Need features?
If you would like to see new features in geopaparazzi, you have a few ways to get there:
-
develop them yourself and contribute them to the project via pull requests
-
hire someone to do that for you
-
create a new feature request in our issue tracker and wait for someone interested to do it
1.7. Donations
If you find this application useful for your job, please consider to donate to support the development. Donations to this project support the development of the Hortonmachine and Geopaparazzi projects.
Thanks for helping to keep this development free and open source.
2. Installation
2.1. From Google Play
-
connect your Android device to Internet
-
open the Play Store
-
type geopaparazzi within the Search textbox
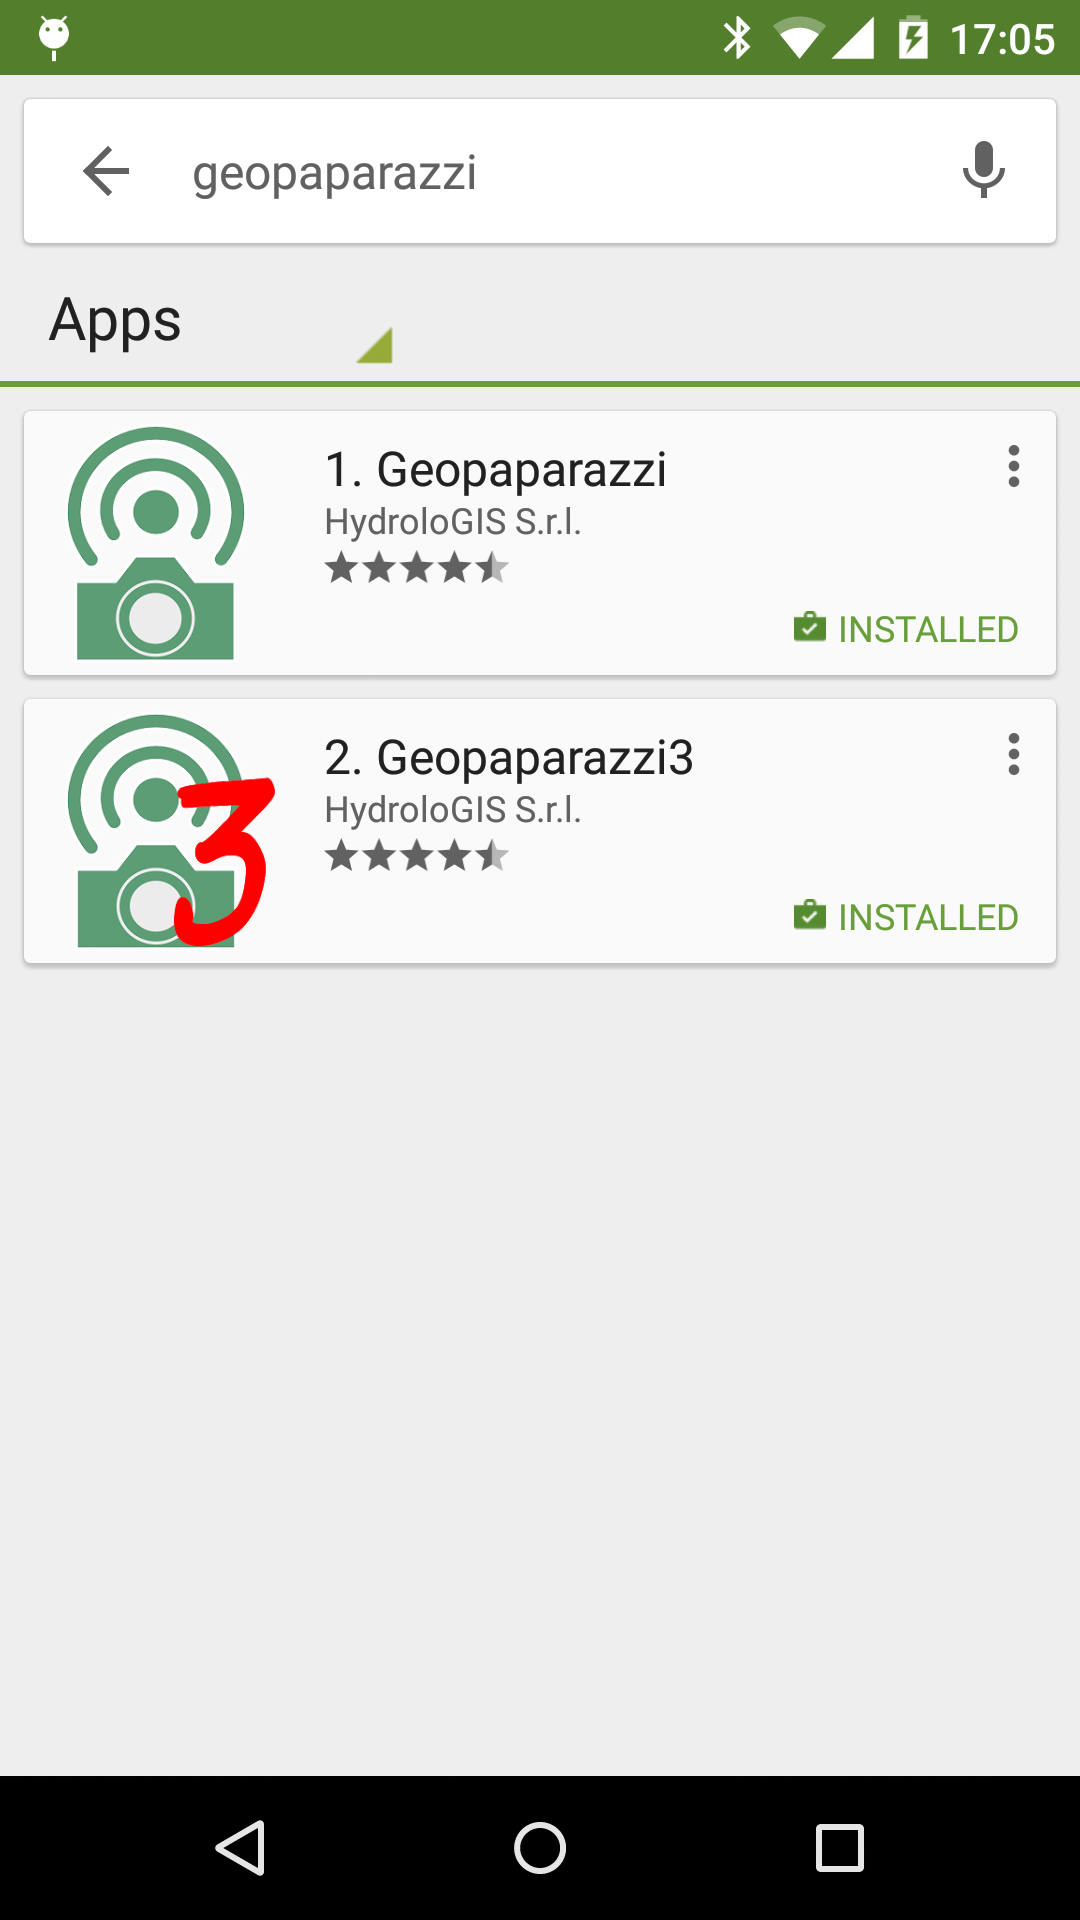
-
select the first app (Geopaparazzi)
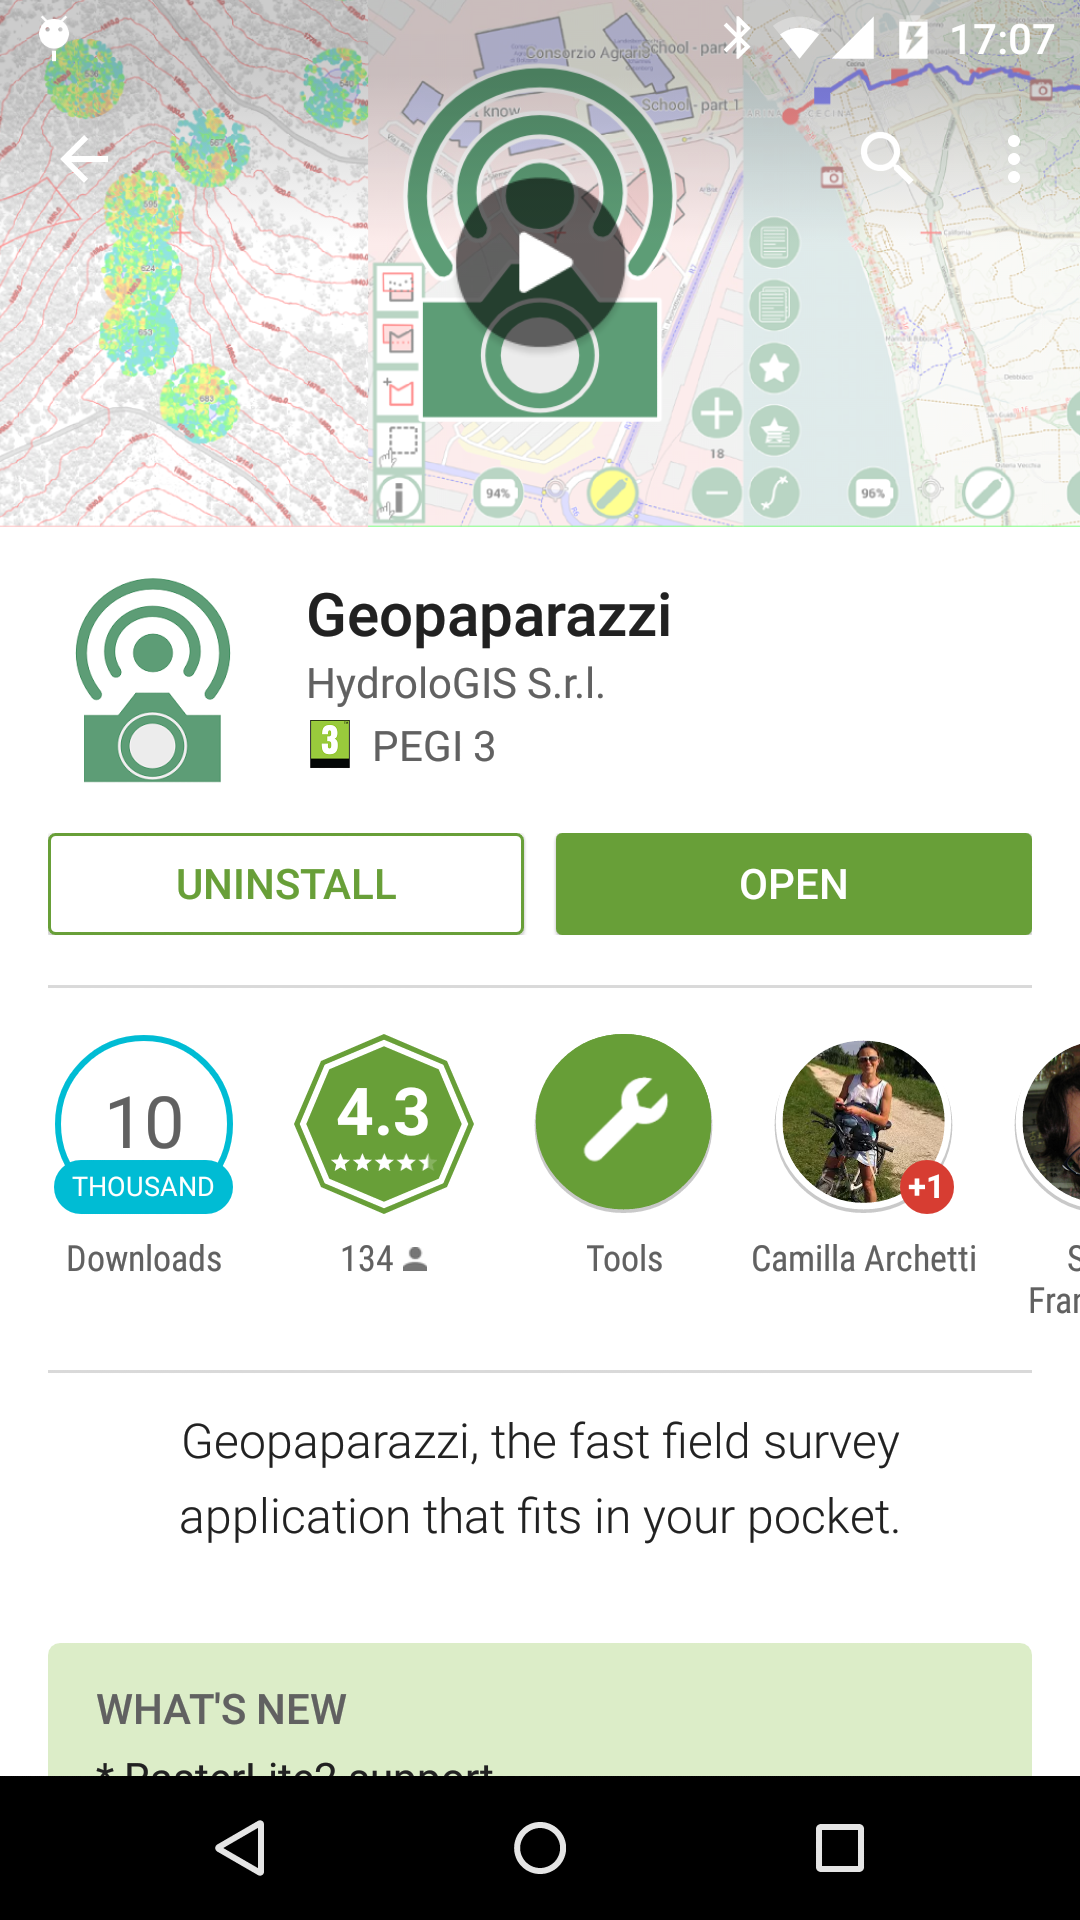
-
follow installation procedures
2.2. Manual Installation
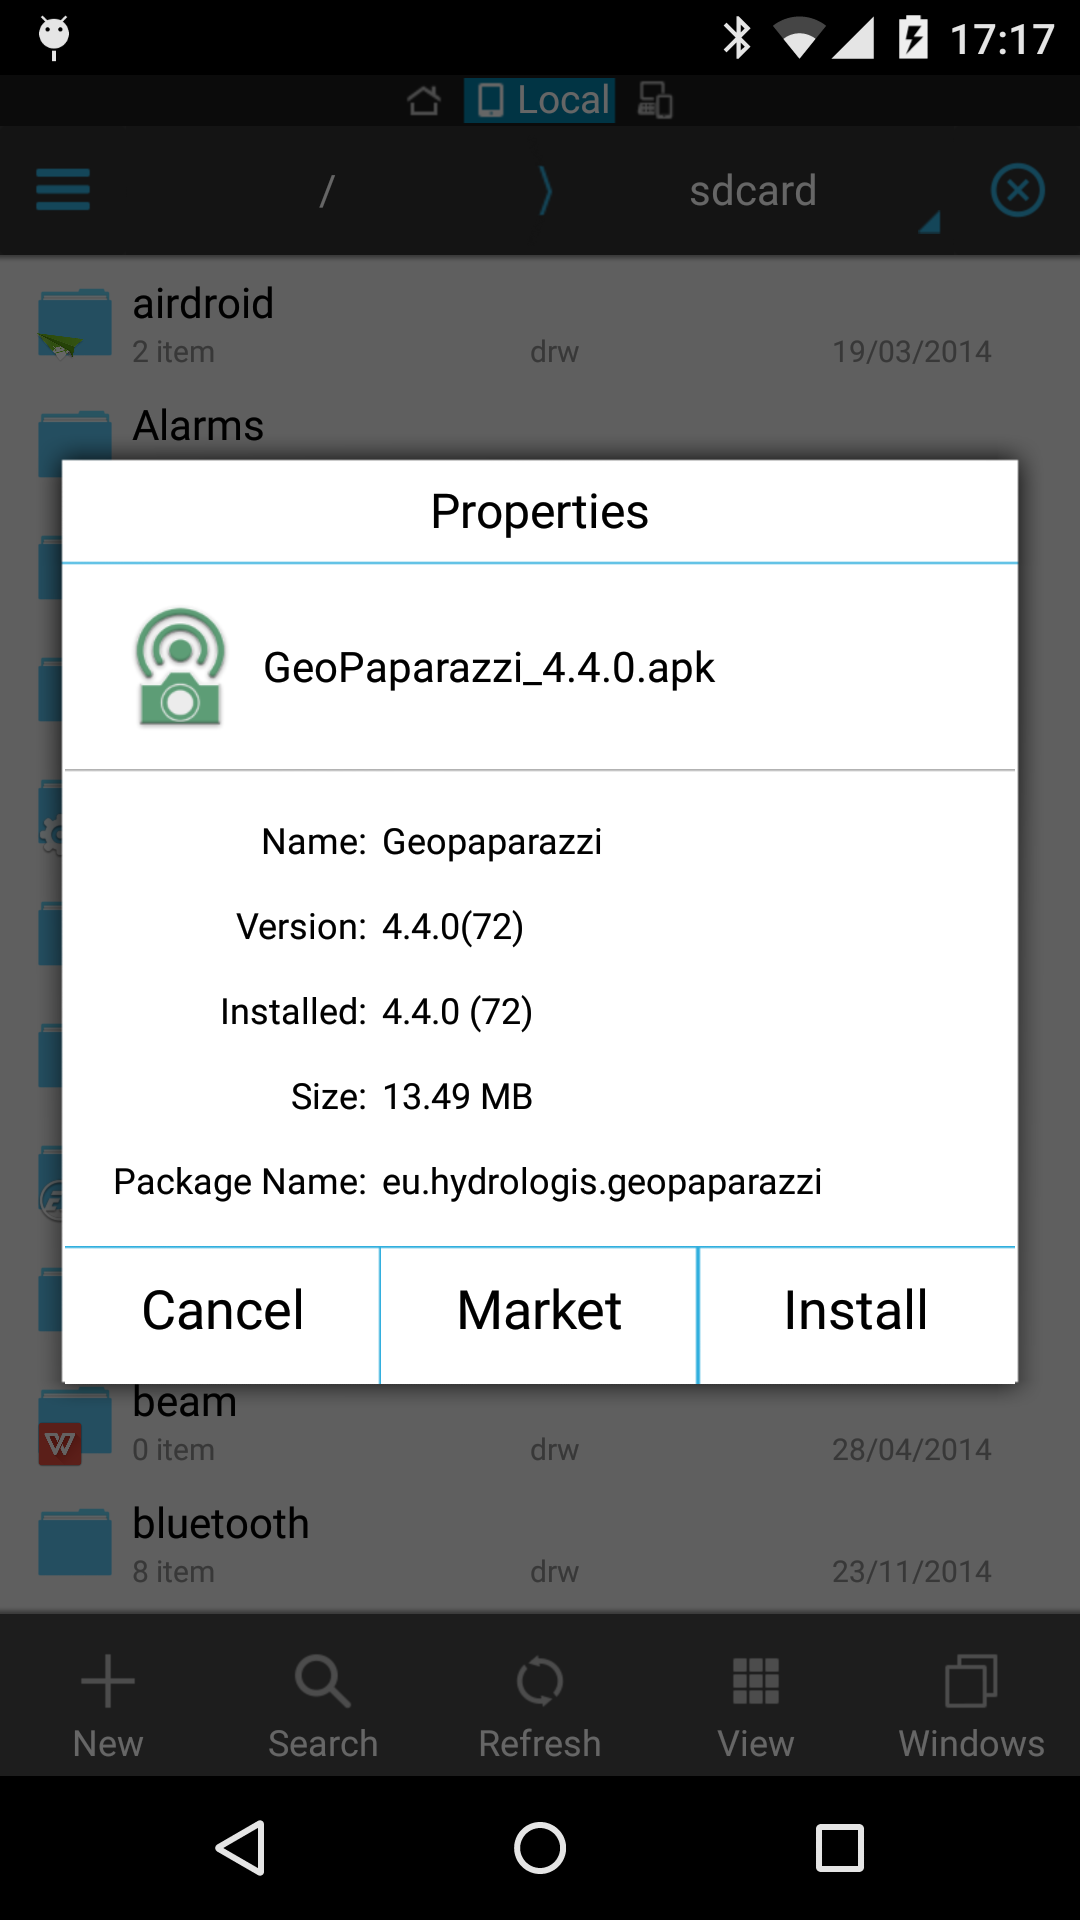
The following example explains how to install version 4.4.0. We suggest to always use the latest version available.
-
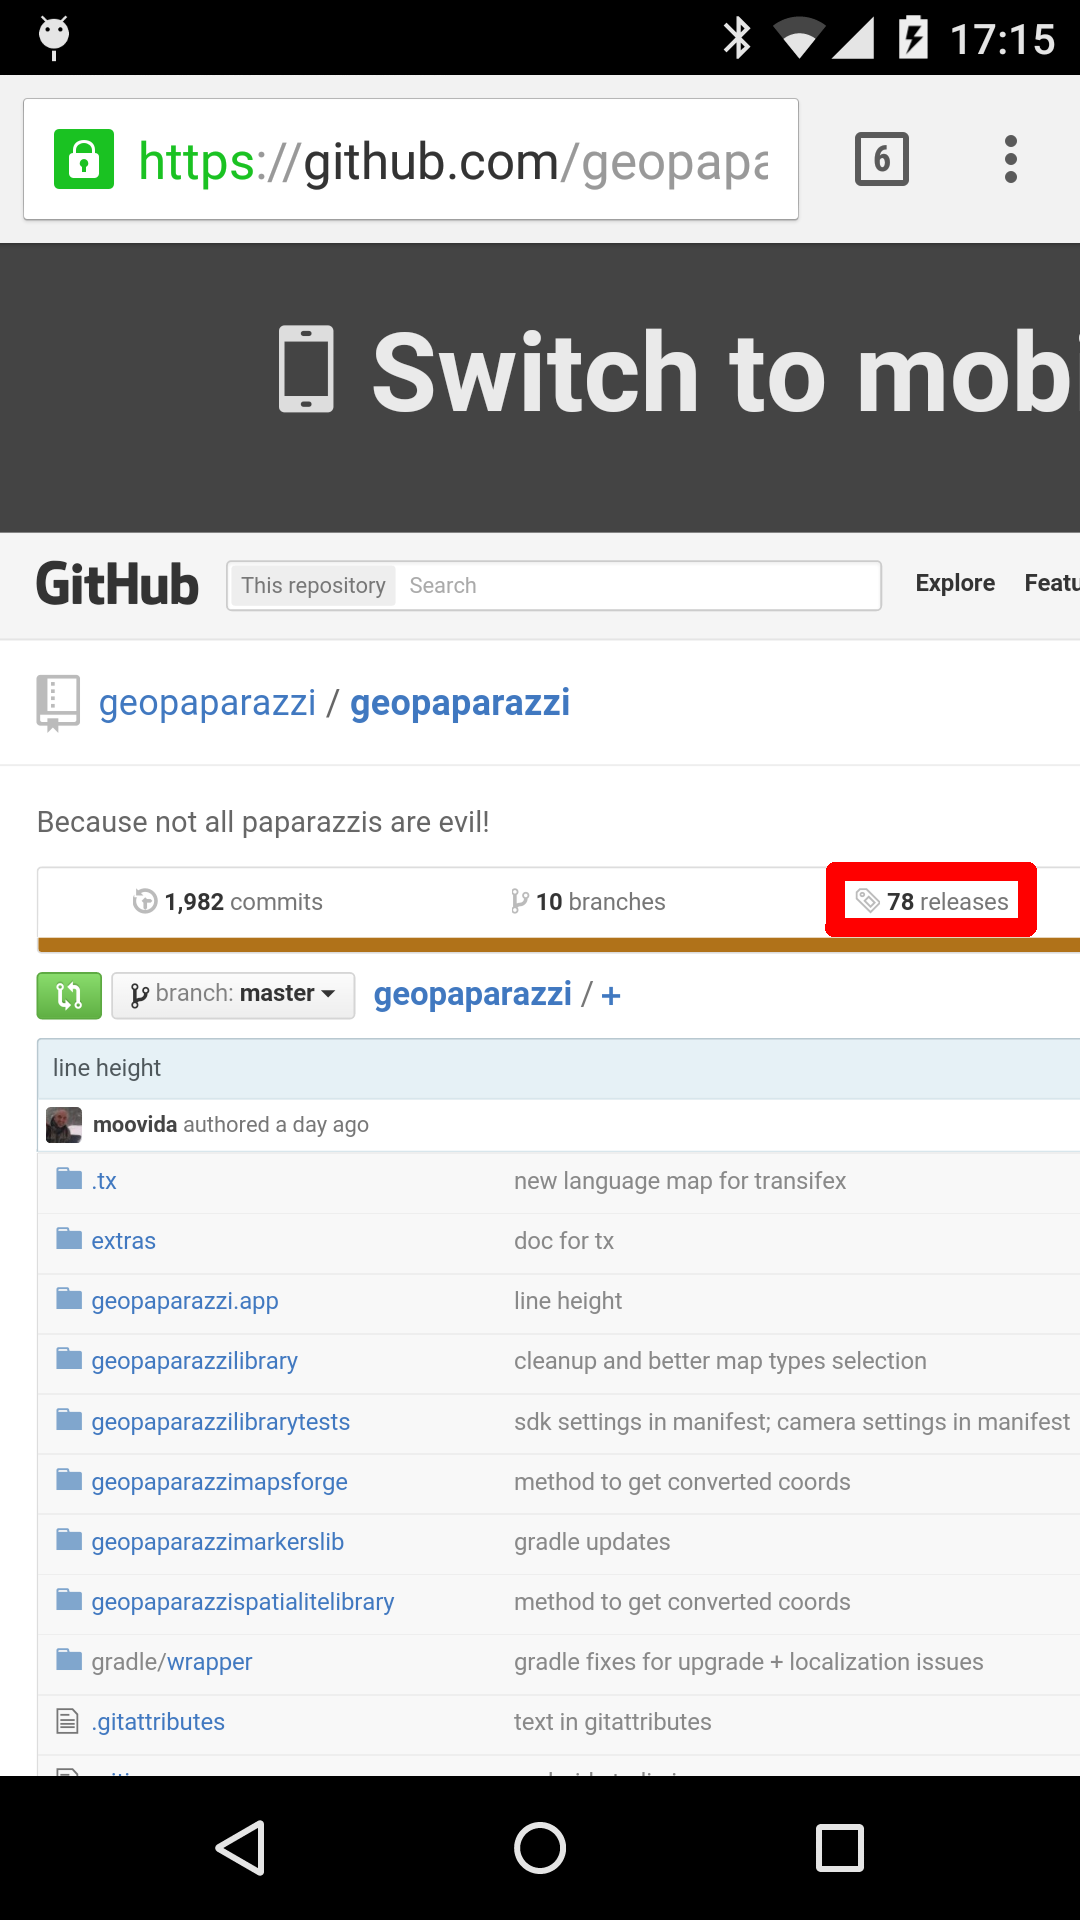
from your devices visit the geopaparazzi releases page making sure to load the desktop site (not the mobile site).
-
select the releases tab and pick the last available release:
-
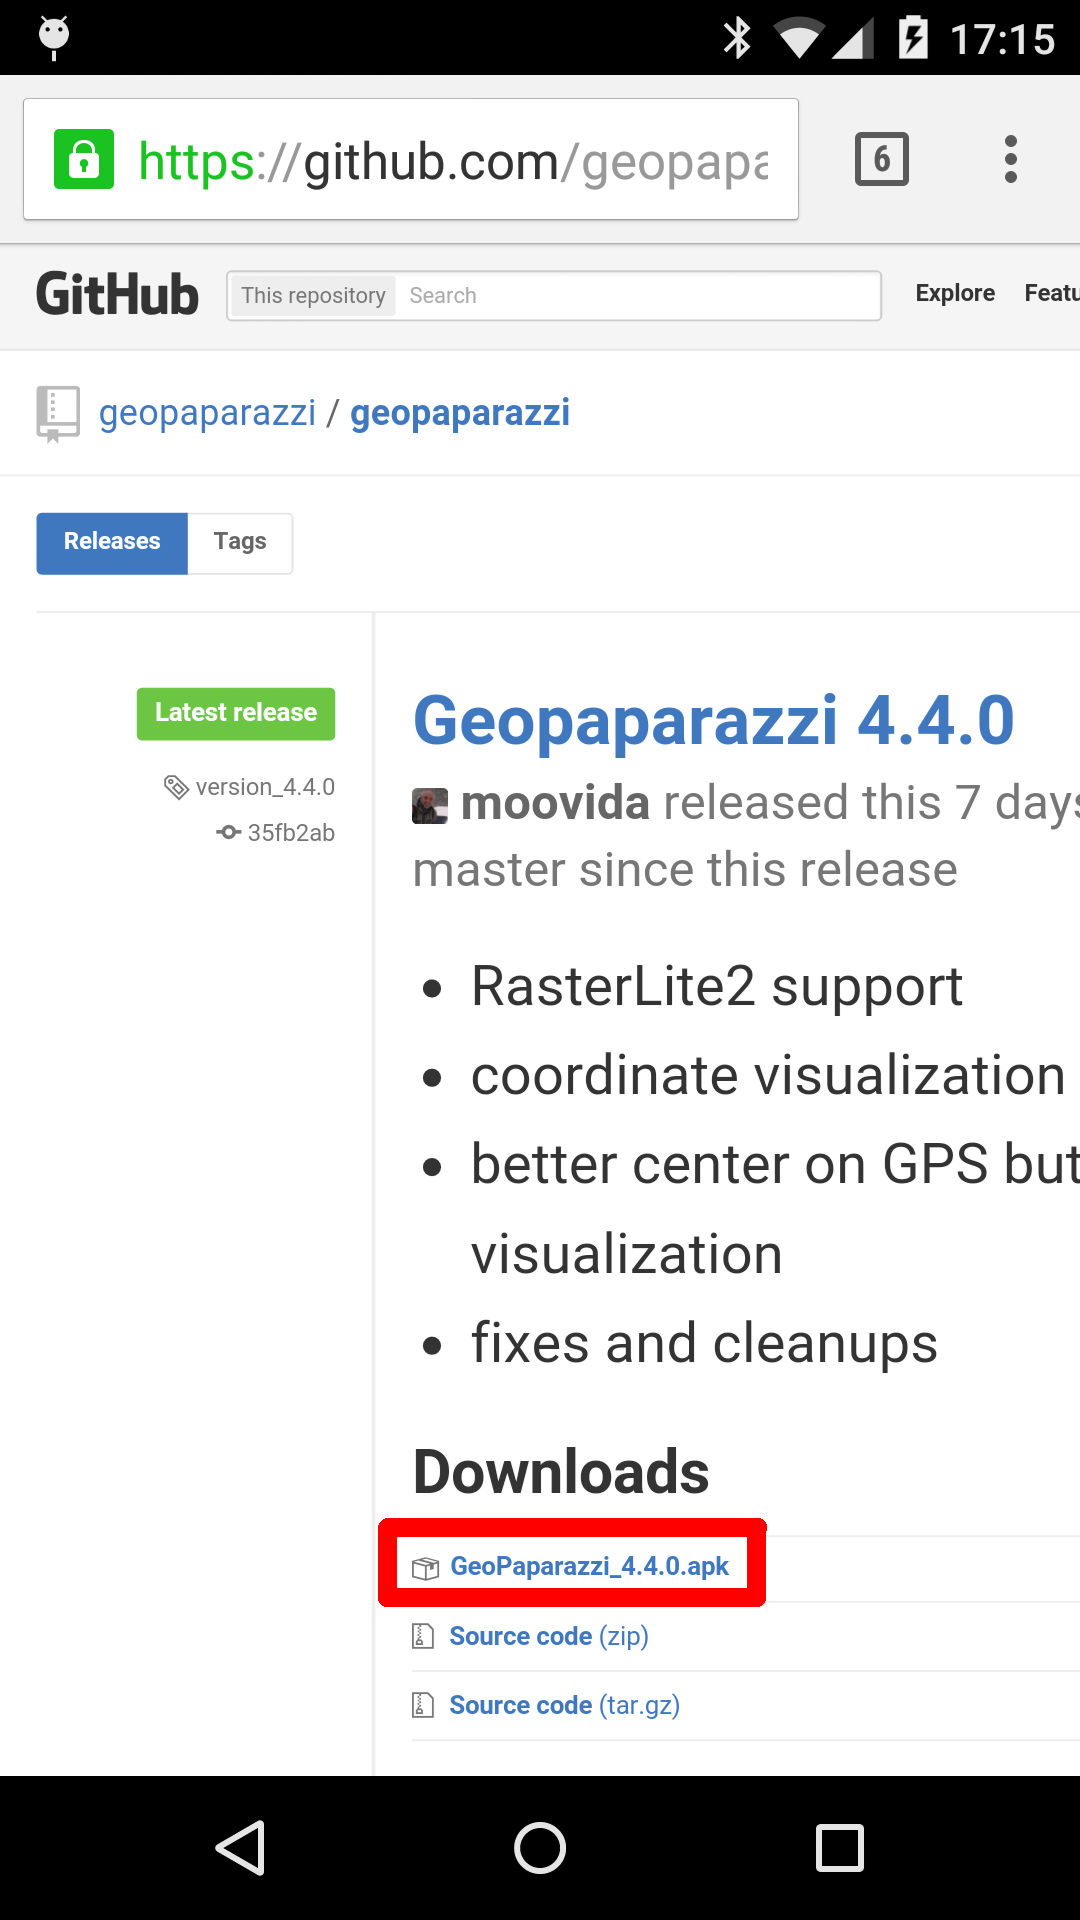
select the latest release apk download link:
-
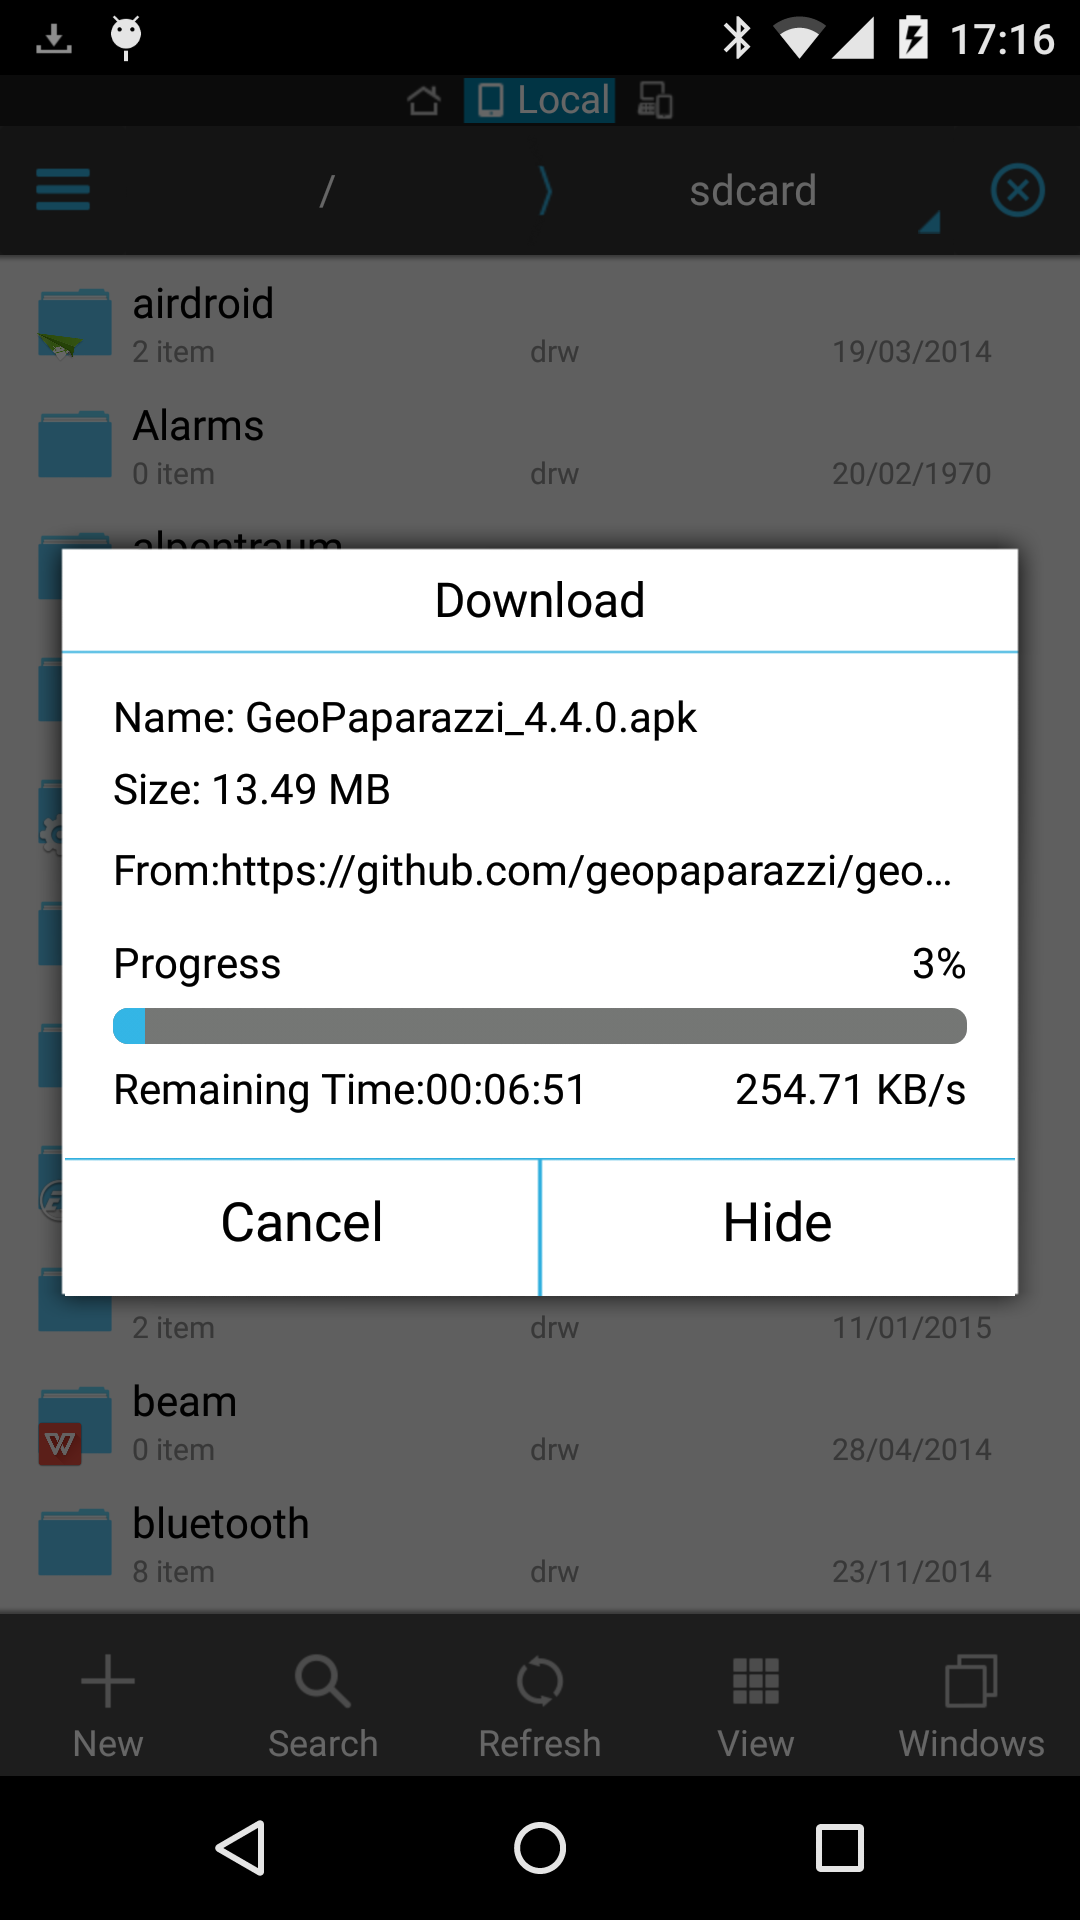
the apk installation file will download on the device:
-
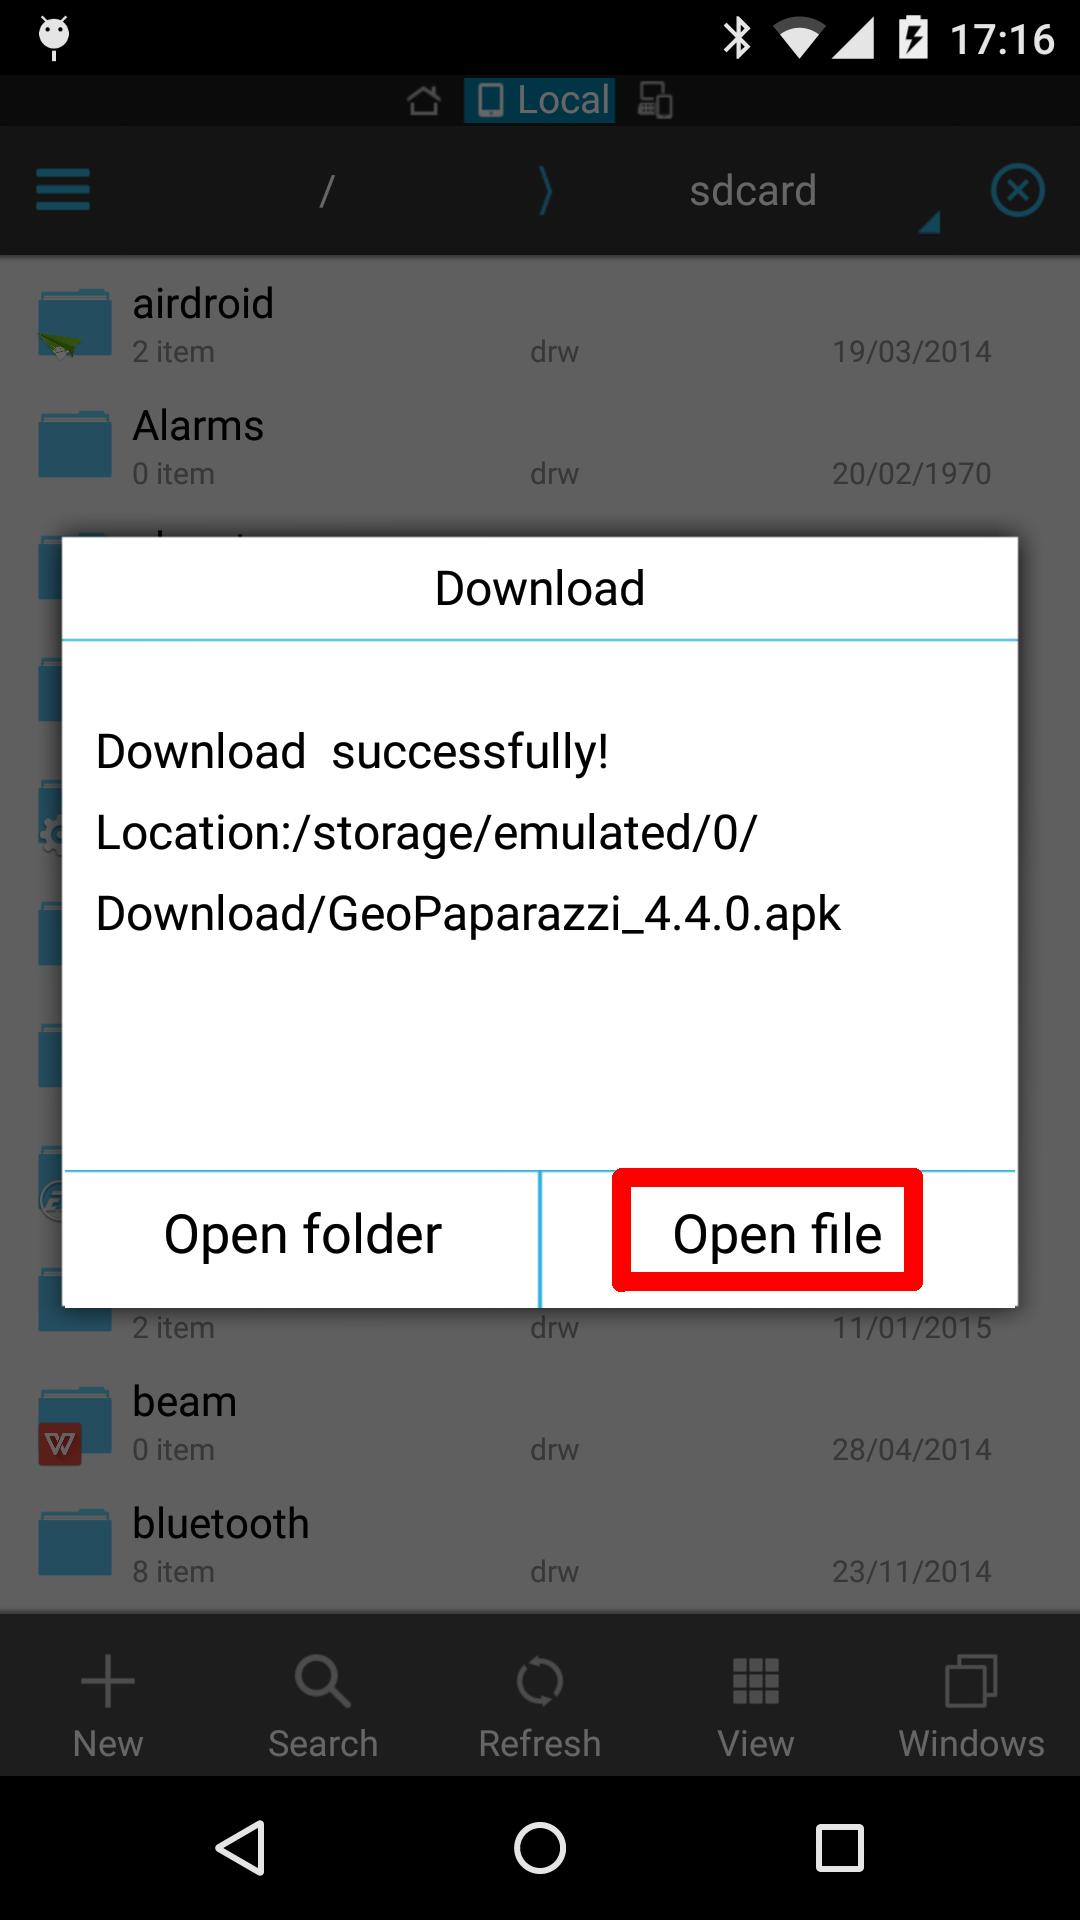
and the user will be prompted to open the file:
-
opening the file will propose the installation:
-
select install and follow the installation procedure.
3. The Main View
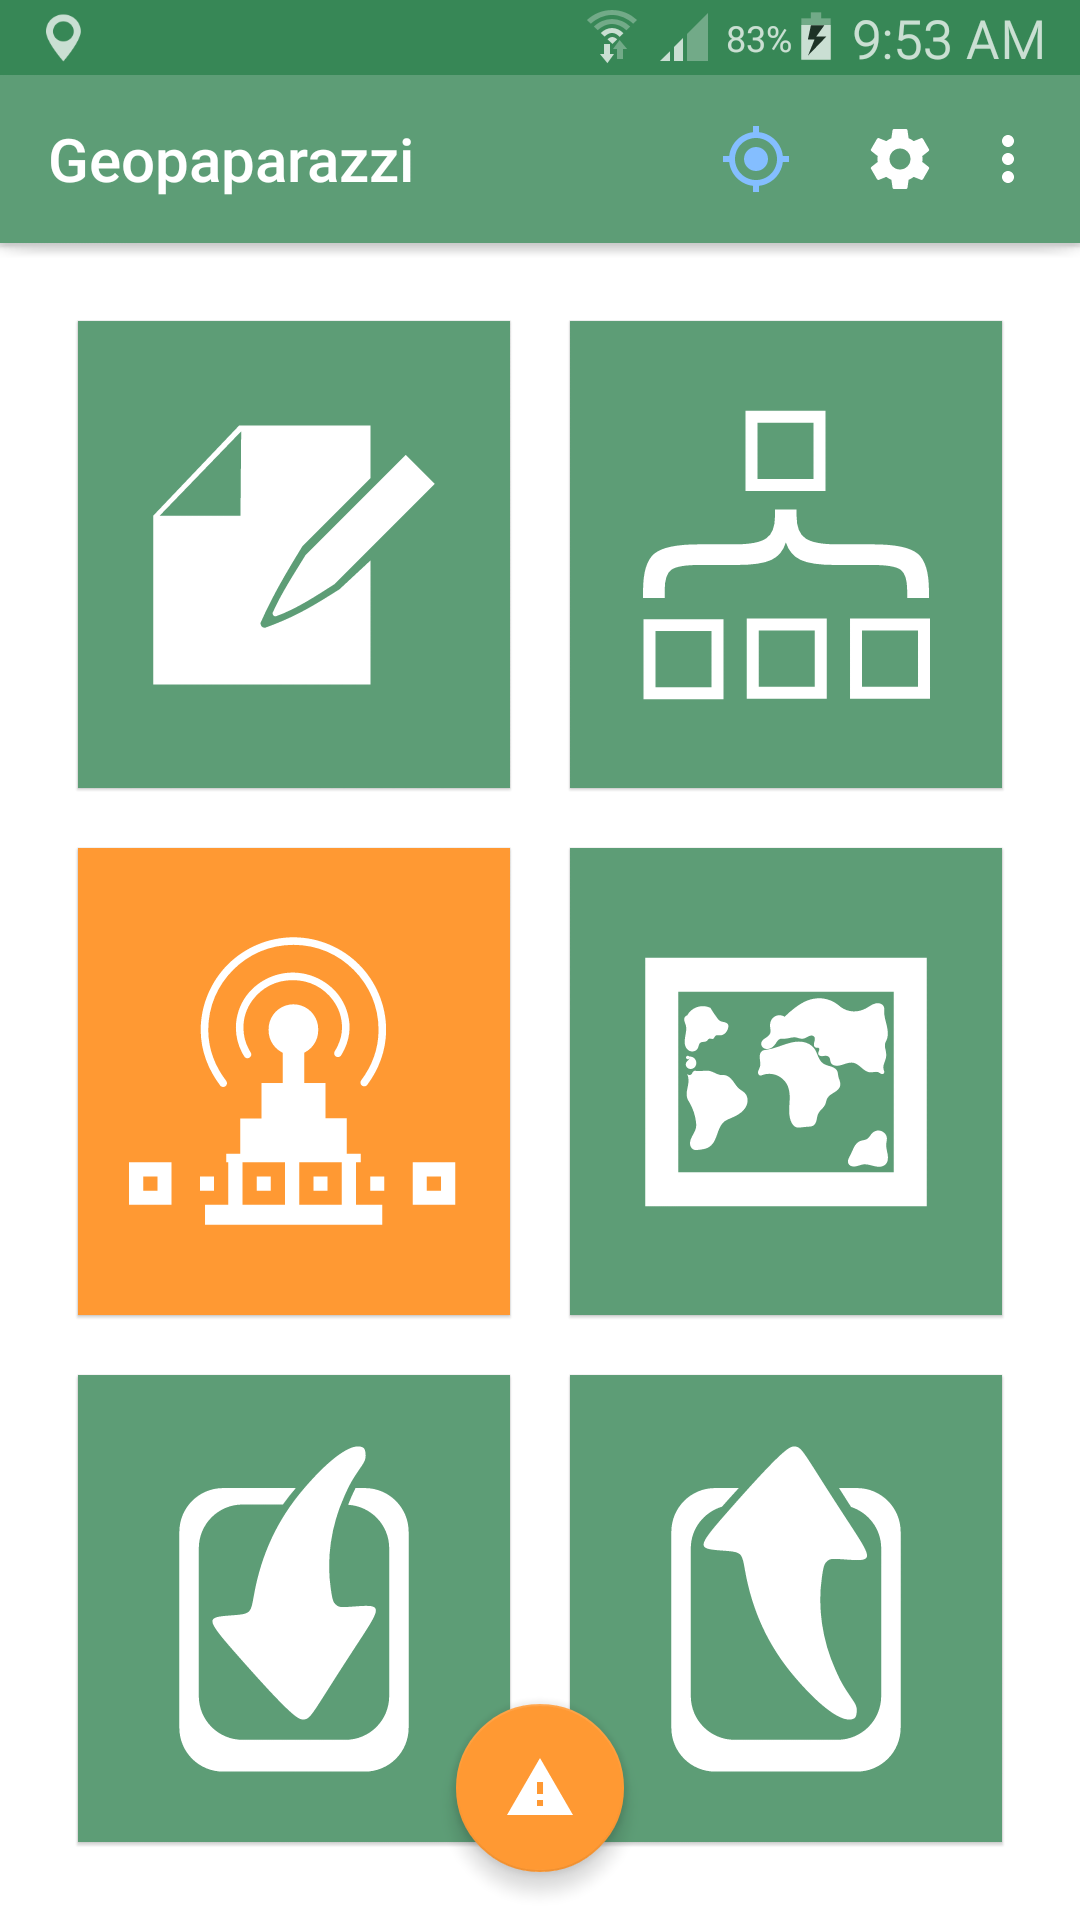
Once you launch Geopaparazzi, the dashboard appears in the Main View.
All the features that need to be quickly accessed, such as toggling GPS on and off, creating a note, as well as visualizing the current position on a map, are accessible from the dashboard.
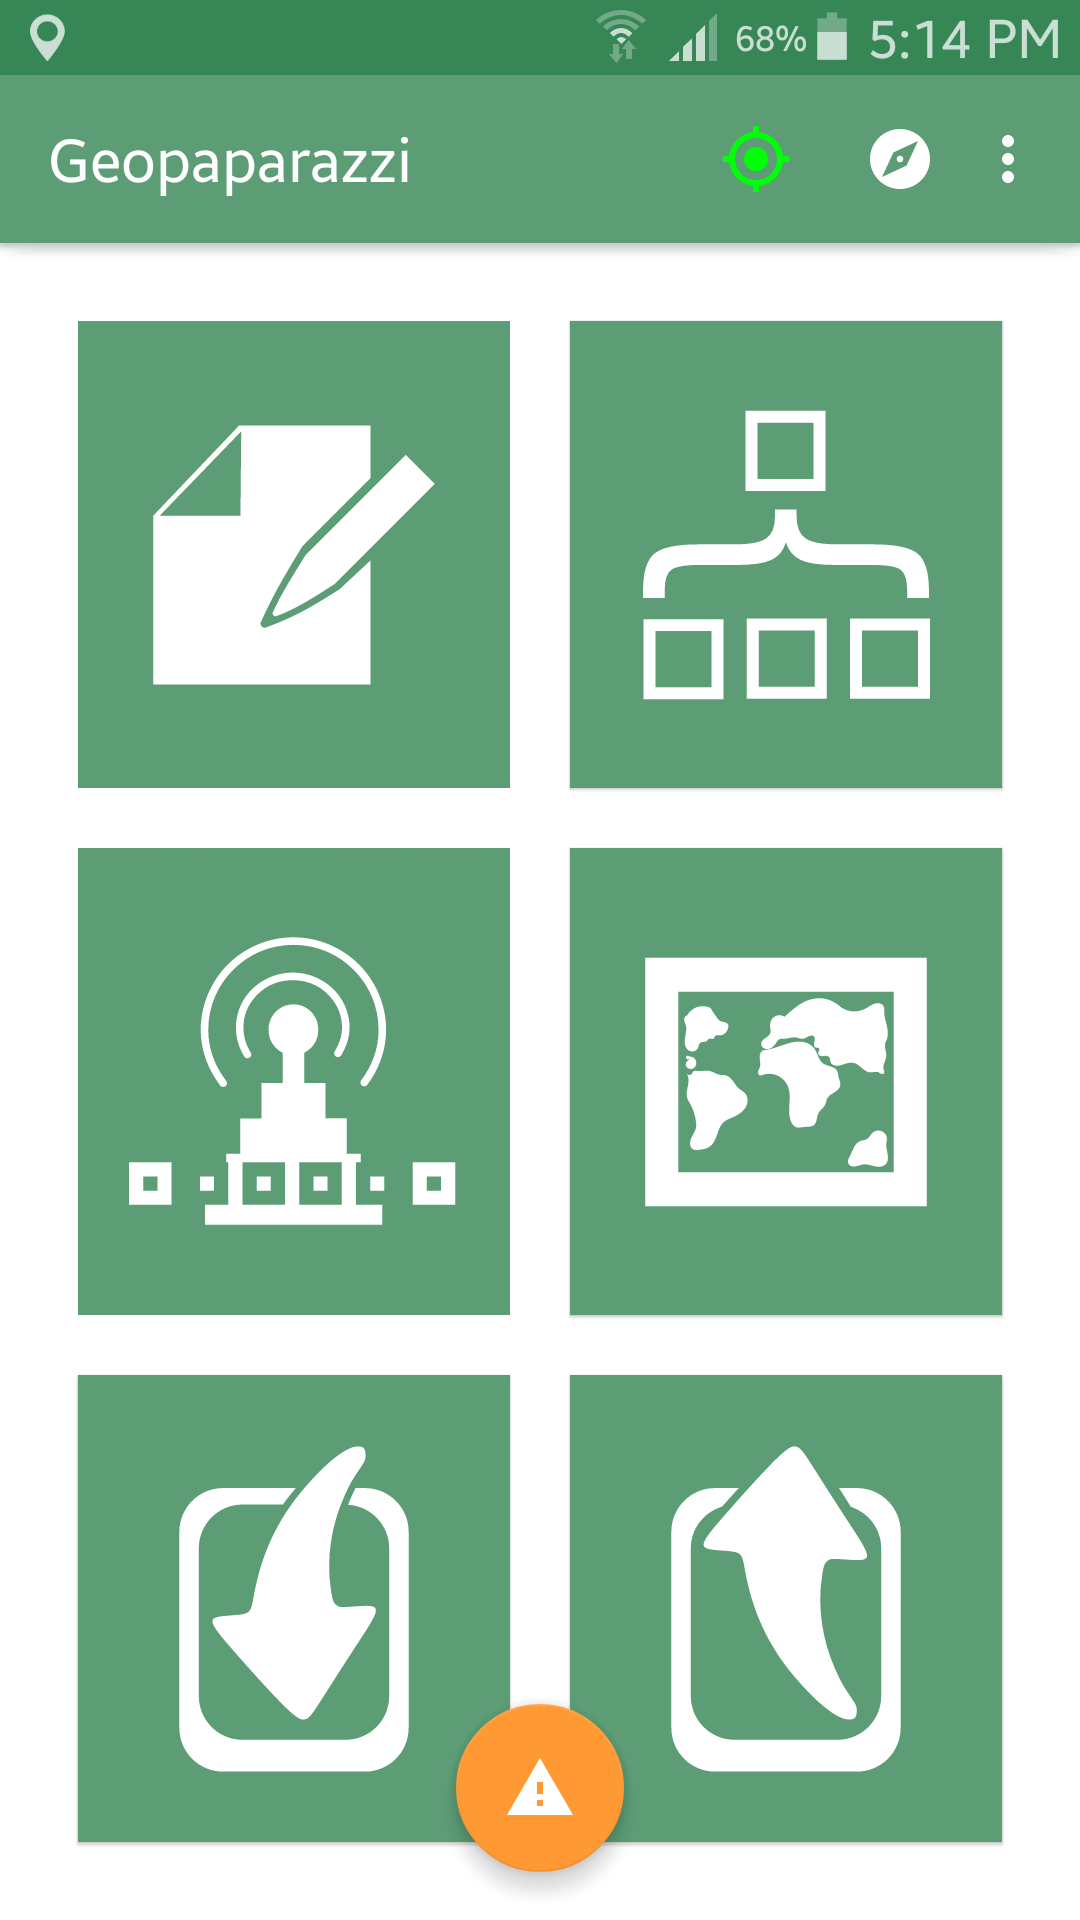
From the dashboard the following primary functions can be accessed:
-
the action bar functions
-
take notes
-
view or modify the project metadata
-
create a GPS Track
-
switch to Map View
-
import Data
-
export Data
3.1. Action Bar
The action bar at the top of the Main View, from right to left, presents the following functions:
-
the main menu
-
the GPS status (via an external application, GPSTest) button
-
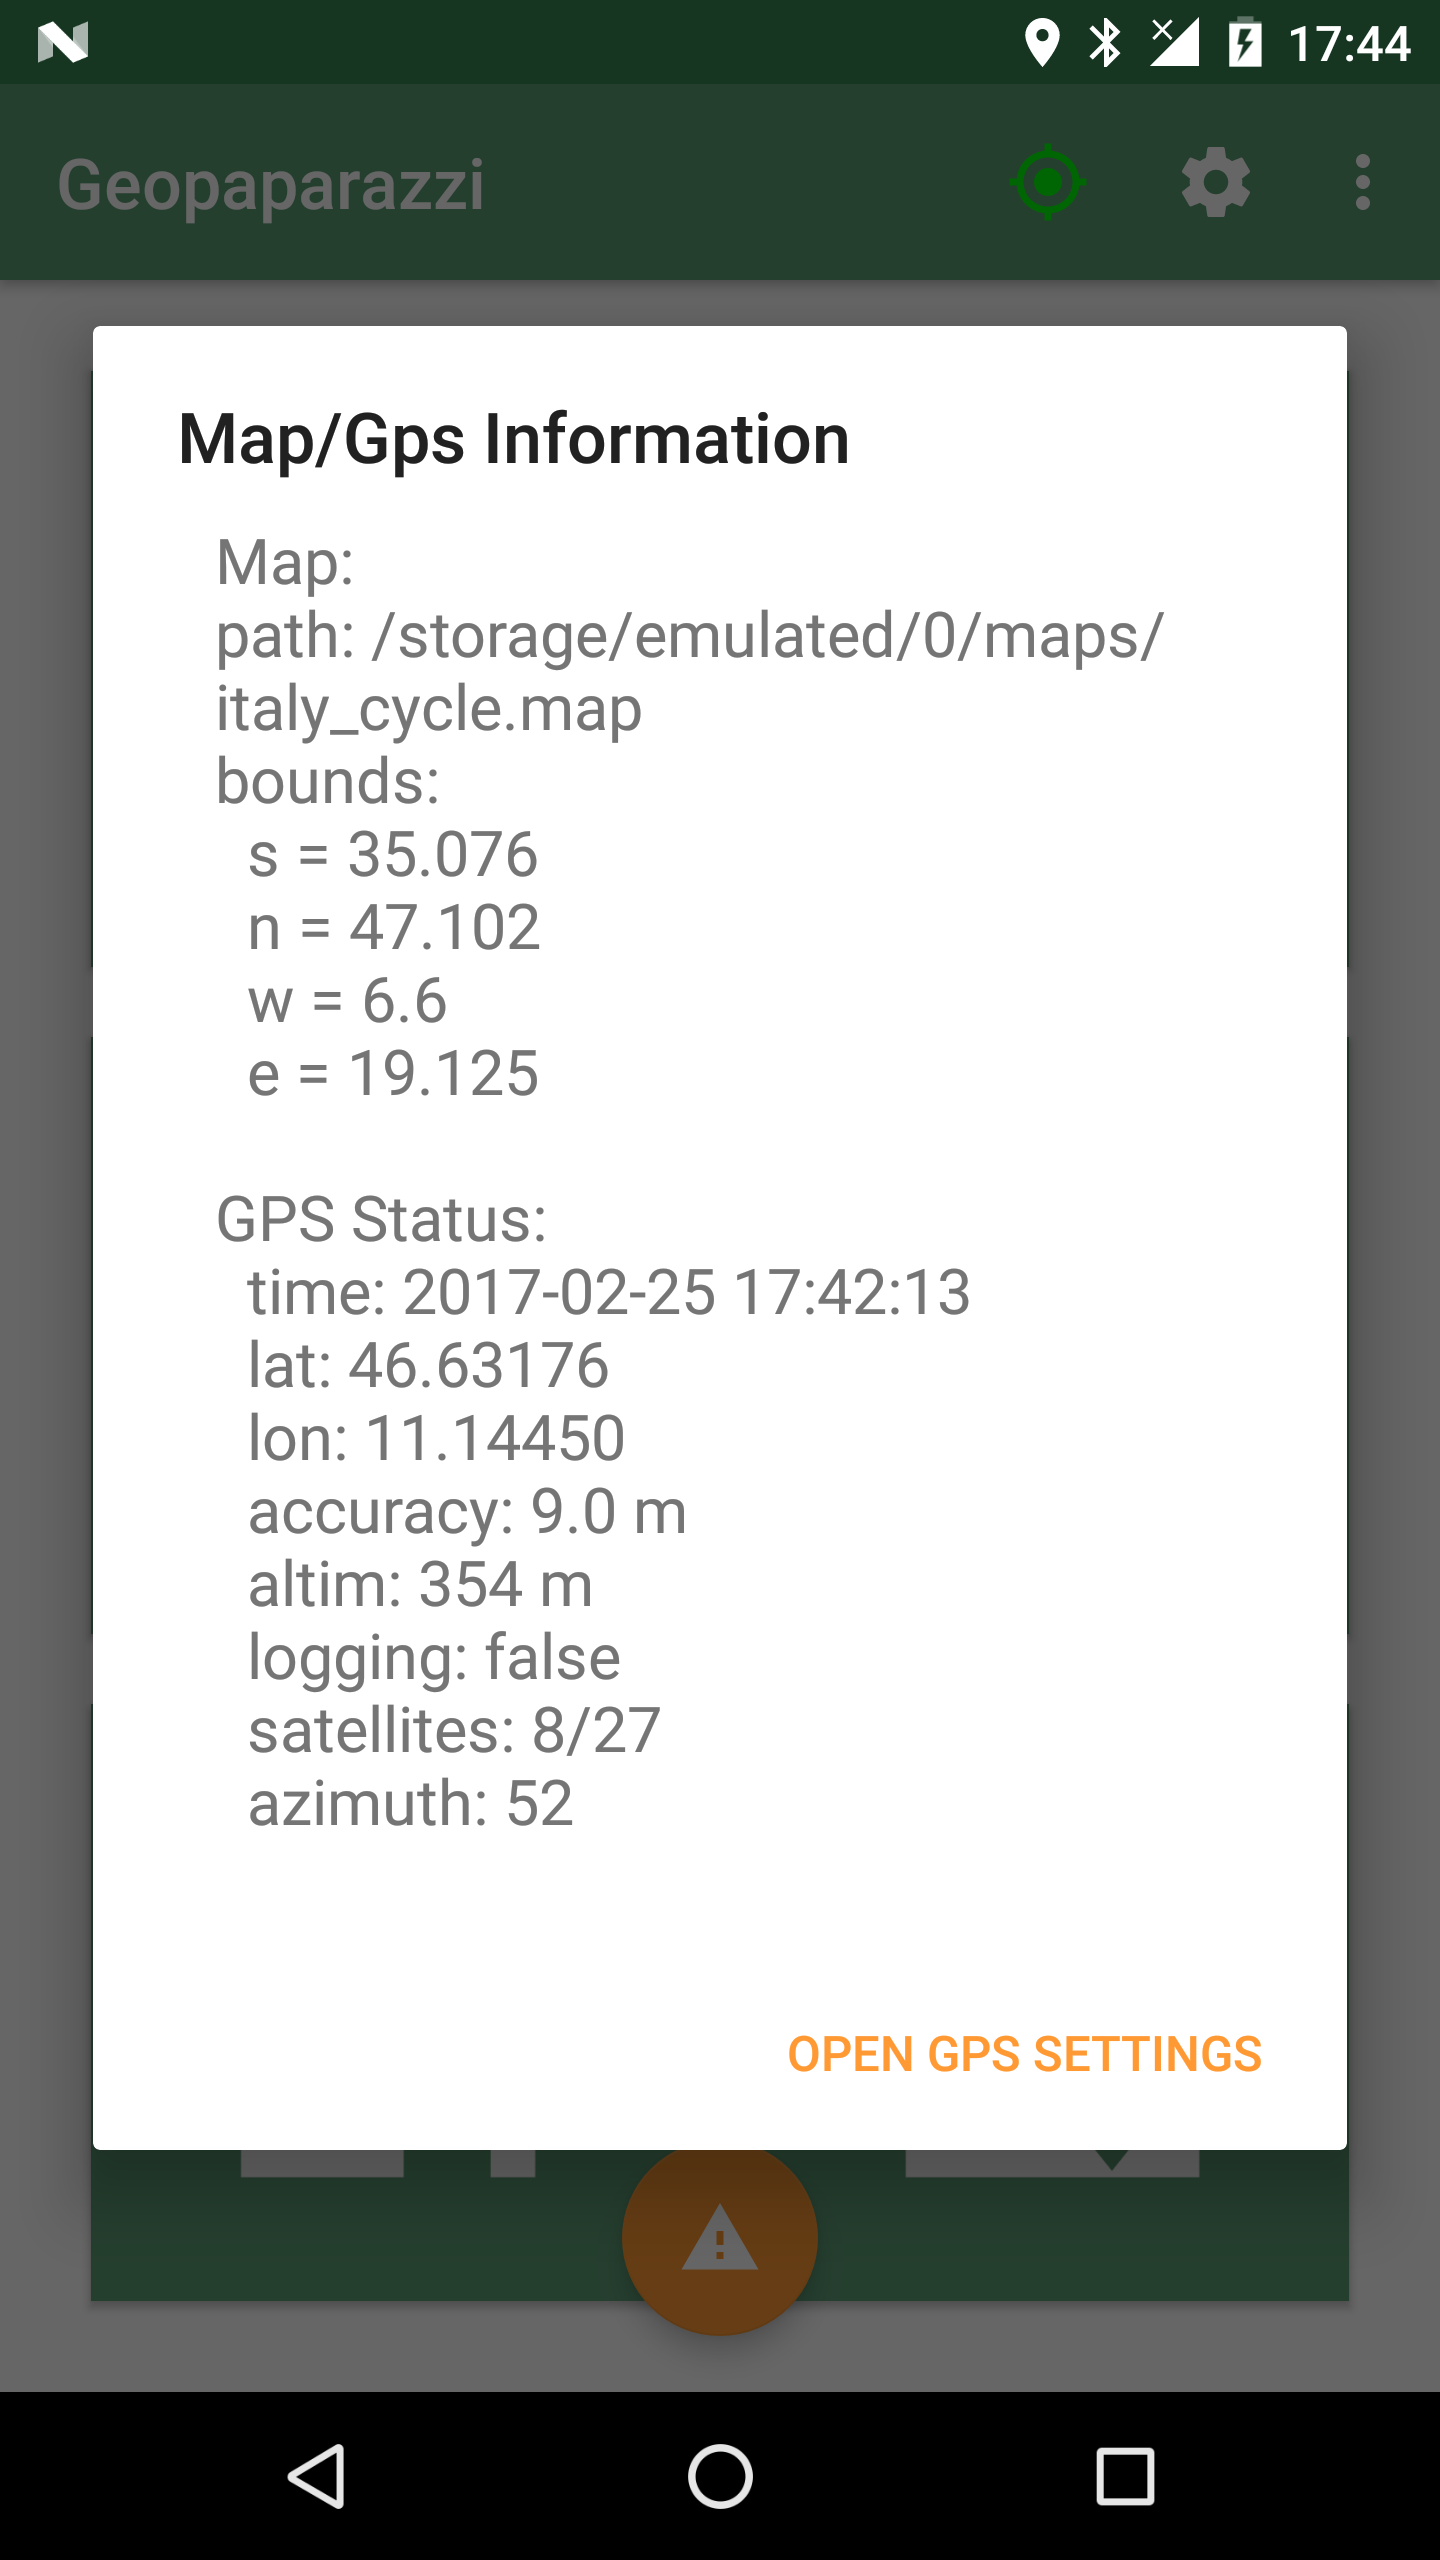
the GPS information button
The GPS information button shows a summary of current GPS data. If the GPS has acquired a fix, information about the position is given:
The icon of the GPS status button can be of the following colors:
-
RED: GPS is not switched on
-
ORANGE: GPS is on but no fix was acquired
-
GREEN: GPS is on and has fix, but no log is being recorded
-
BLUE: GPS is logging.
3.2. The panic button
At the bottom of the view the orange Panic Button is visible when a GPS location is available. Once pushed it leads to the panic! view, which presents two buttons:
-
the PANIC! button
-
the just send position button

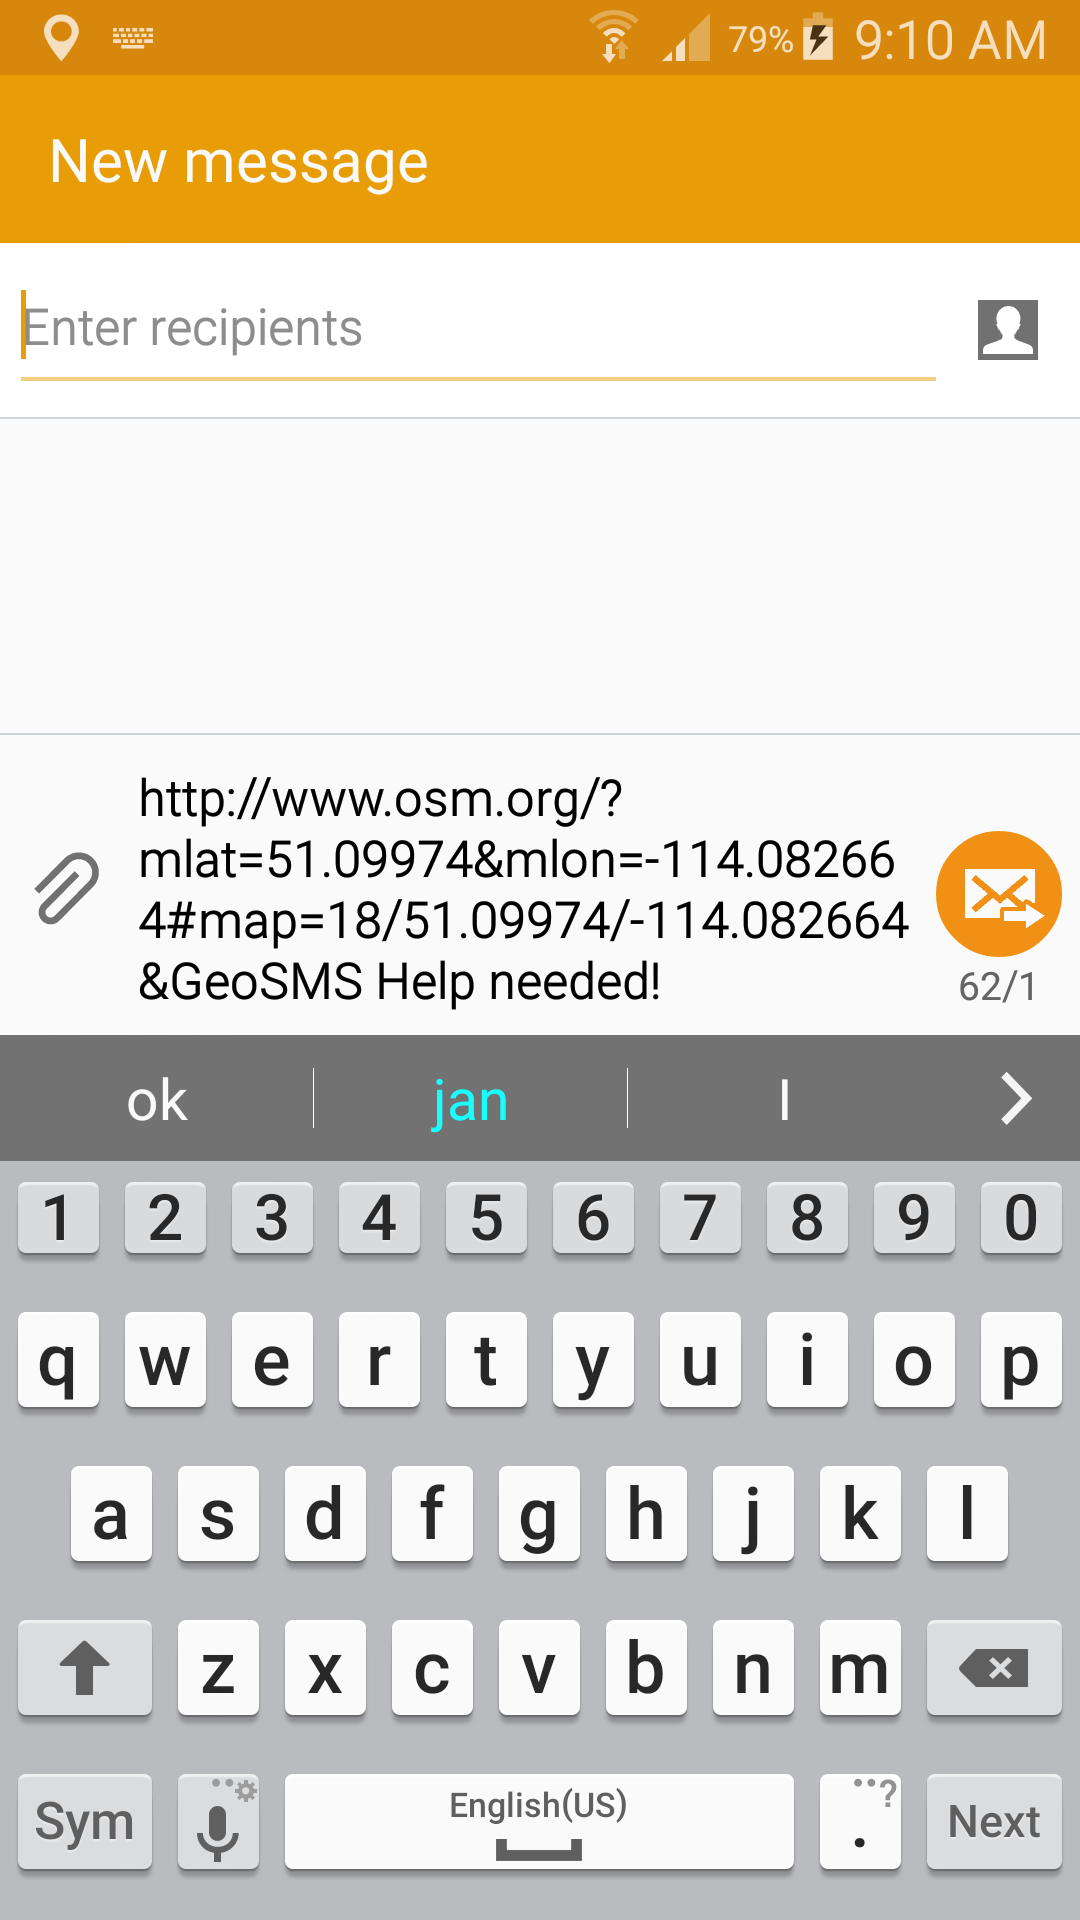
The panic button sends a request for help SMS with the last available GPS position to a phone number that can be configured in the [settings] of geopaparazzi.
If no number is configured, the system SMS dialog opens up with a precompiled message and the user will have to select the contact to which to send the message:
The just send position button opens up the SMS dialog directly filling in the position without any request for help message. It is meant for quick sending the current position via SMS so that it can be opened from Geopaparazzi.
3.3. The dashboard buttons
3.3.1. Notes
Geopaparazzi supports different types of notes:
-
image notes
-
sketch notes
-
map notes
-
text notes
-
form-based notes (pick lists, etc.)
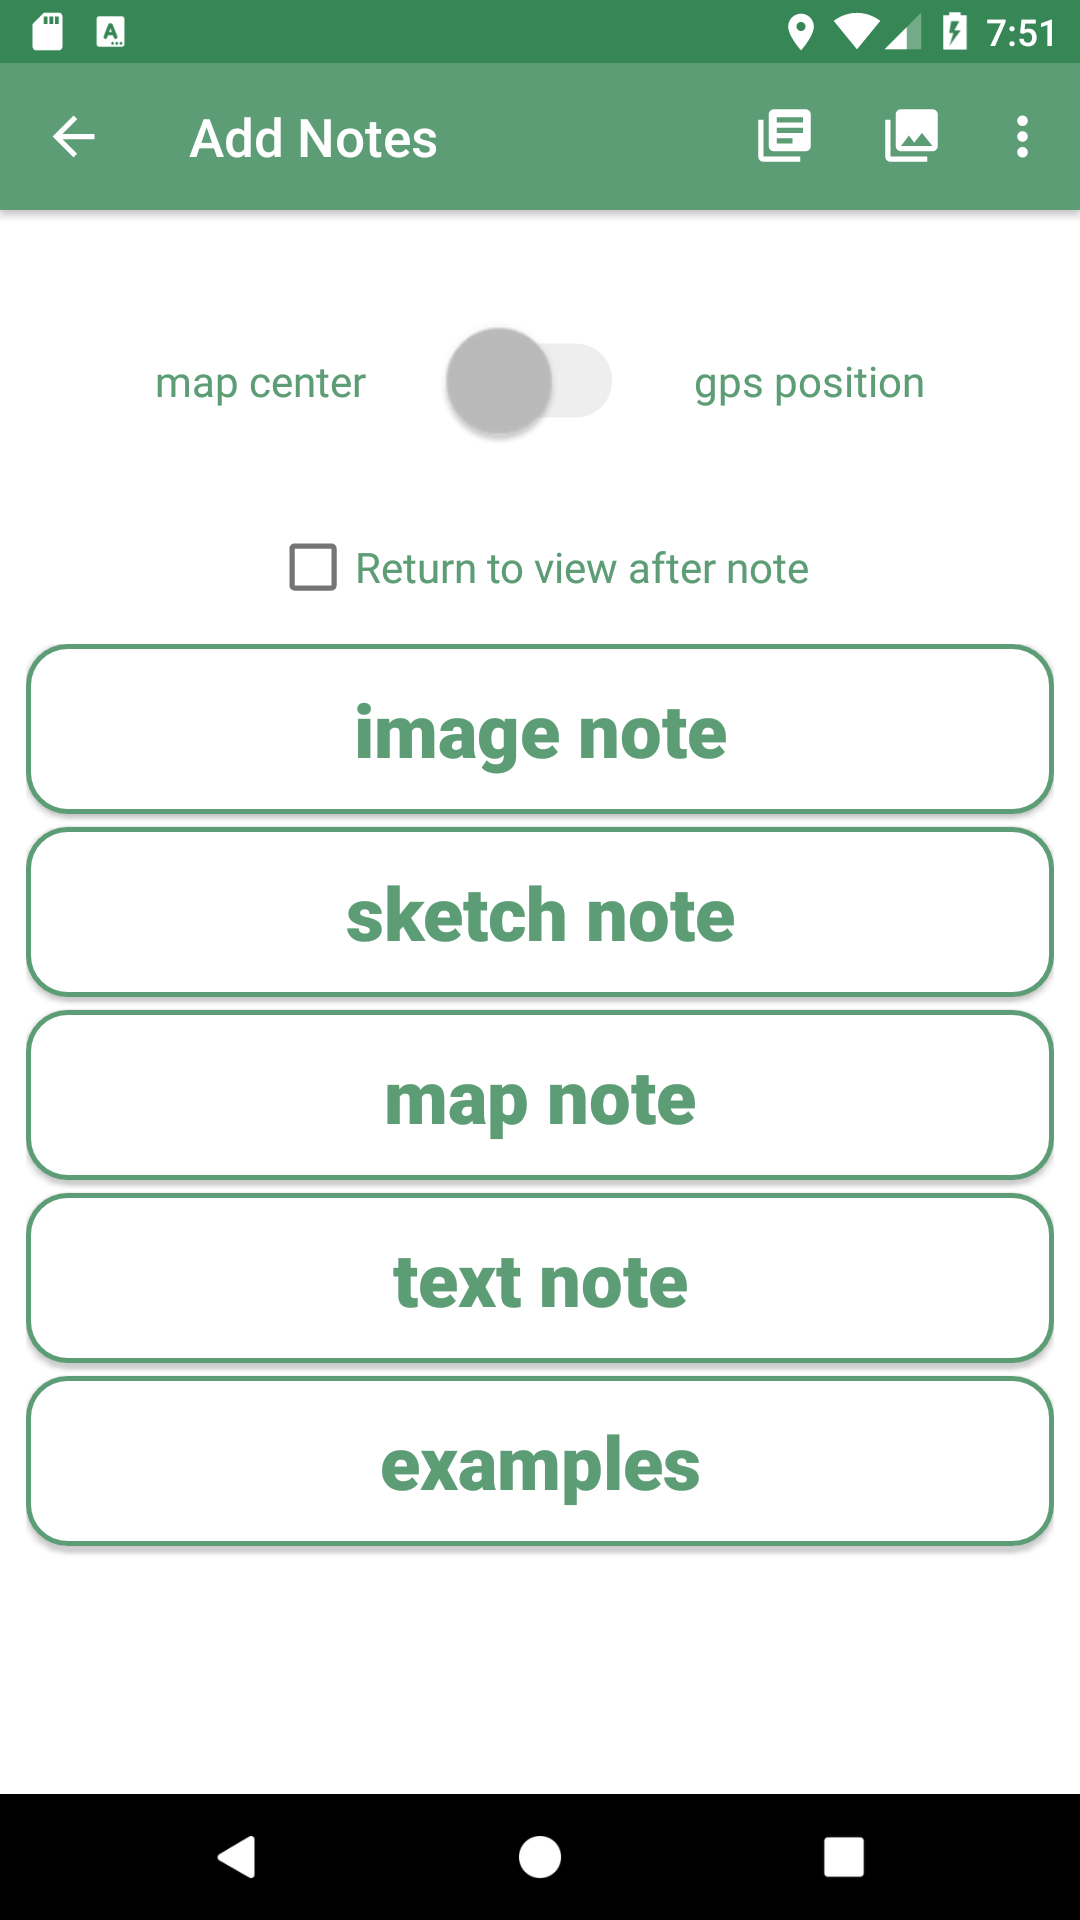
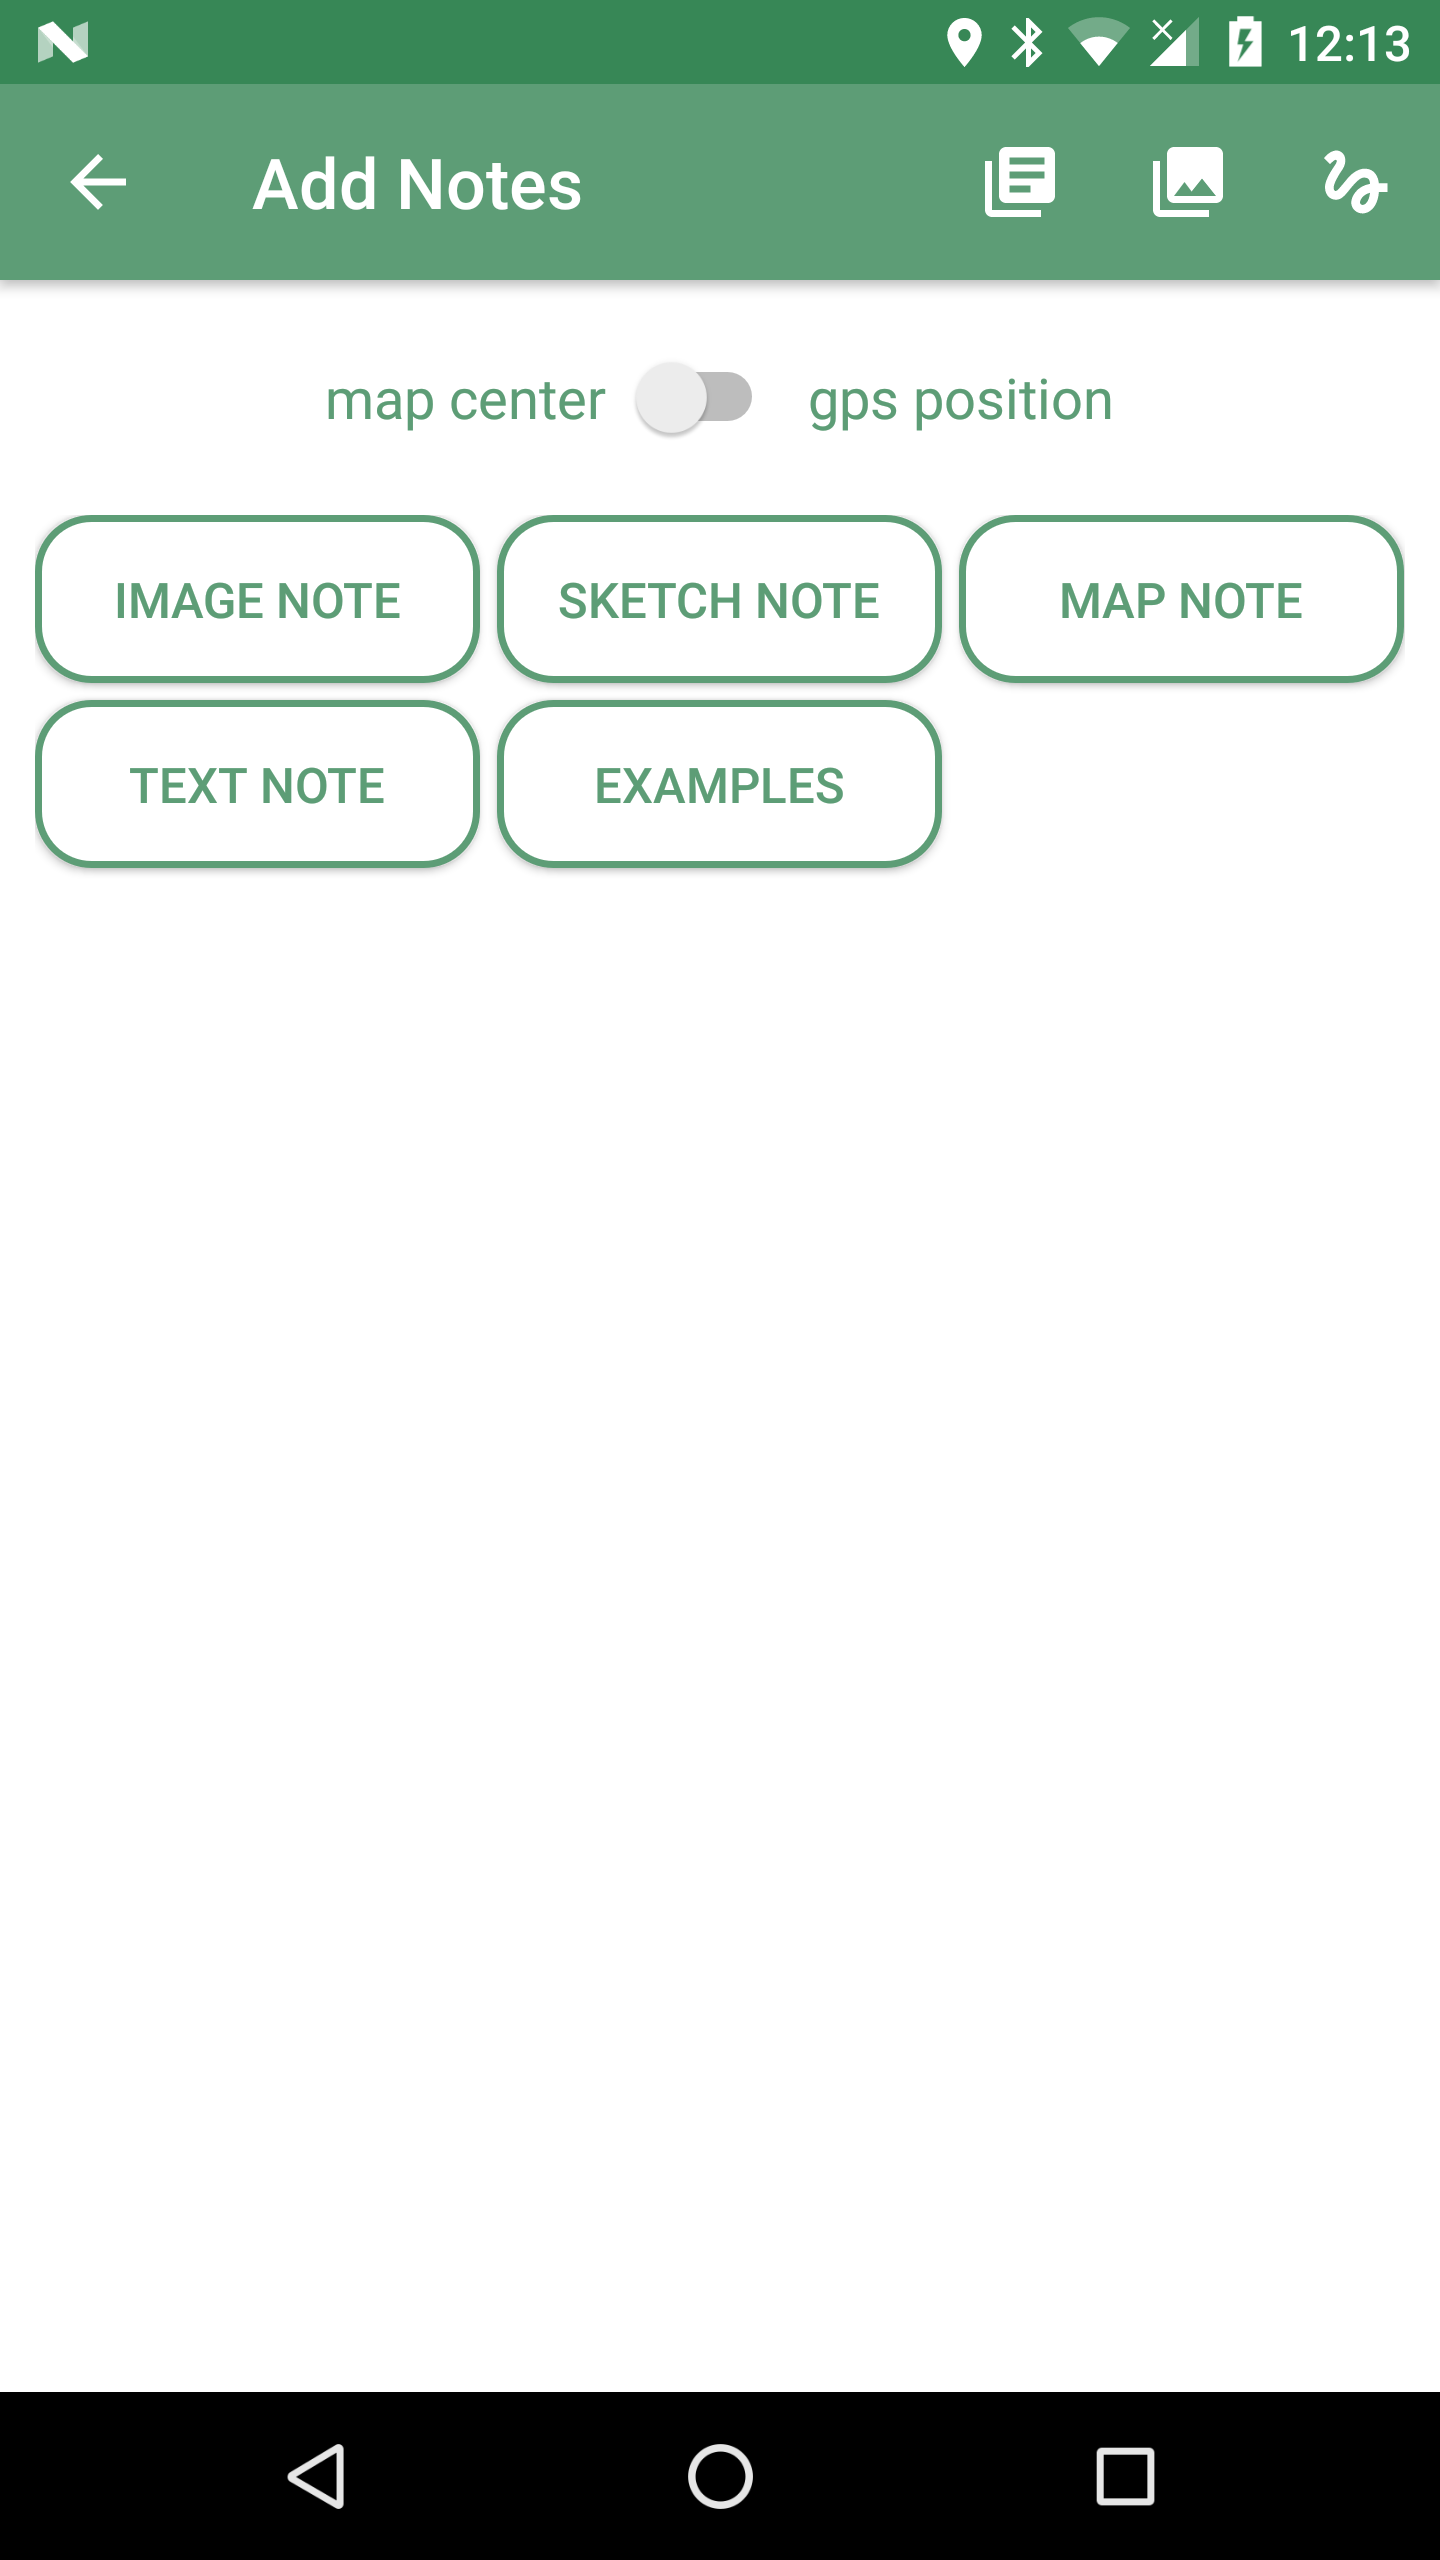
To access them you can tap on the first icon of the dashboard, the Add Notes icon. Once you tap on it, the Add Notes dialog appears:
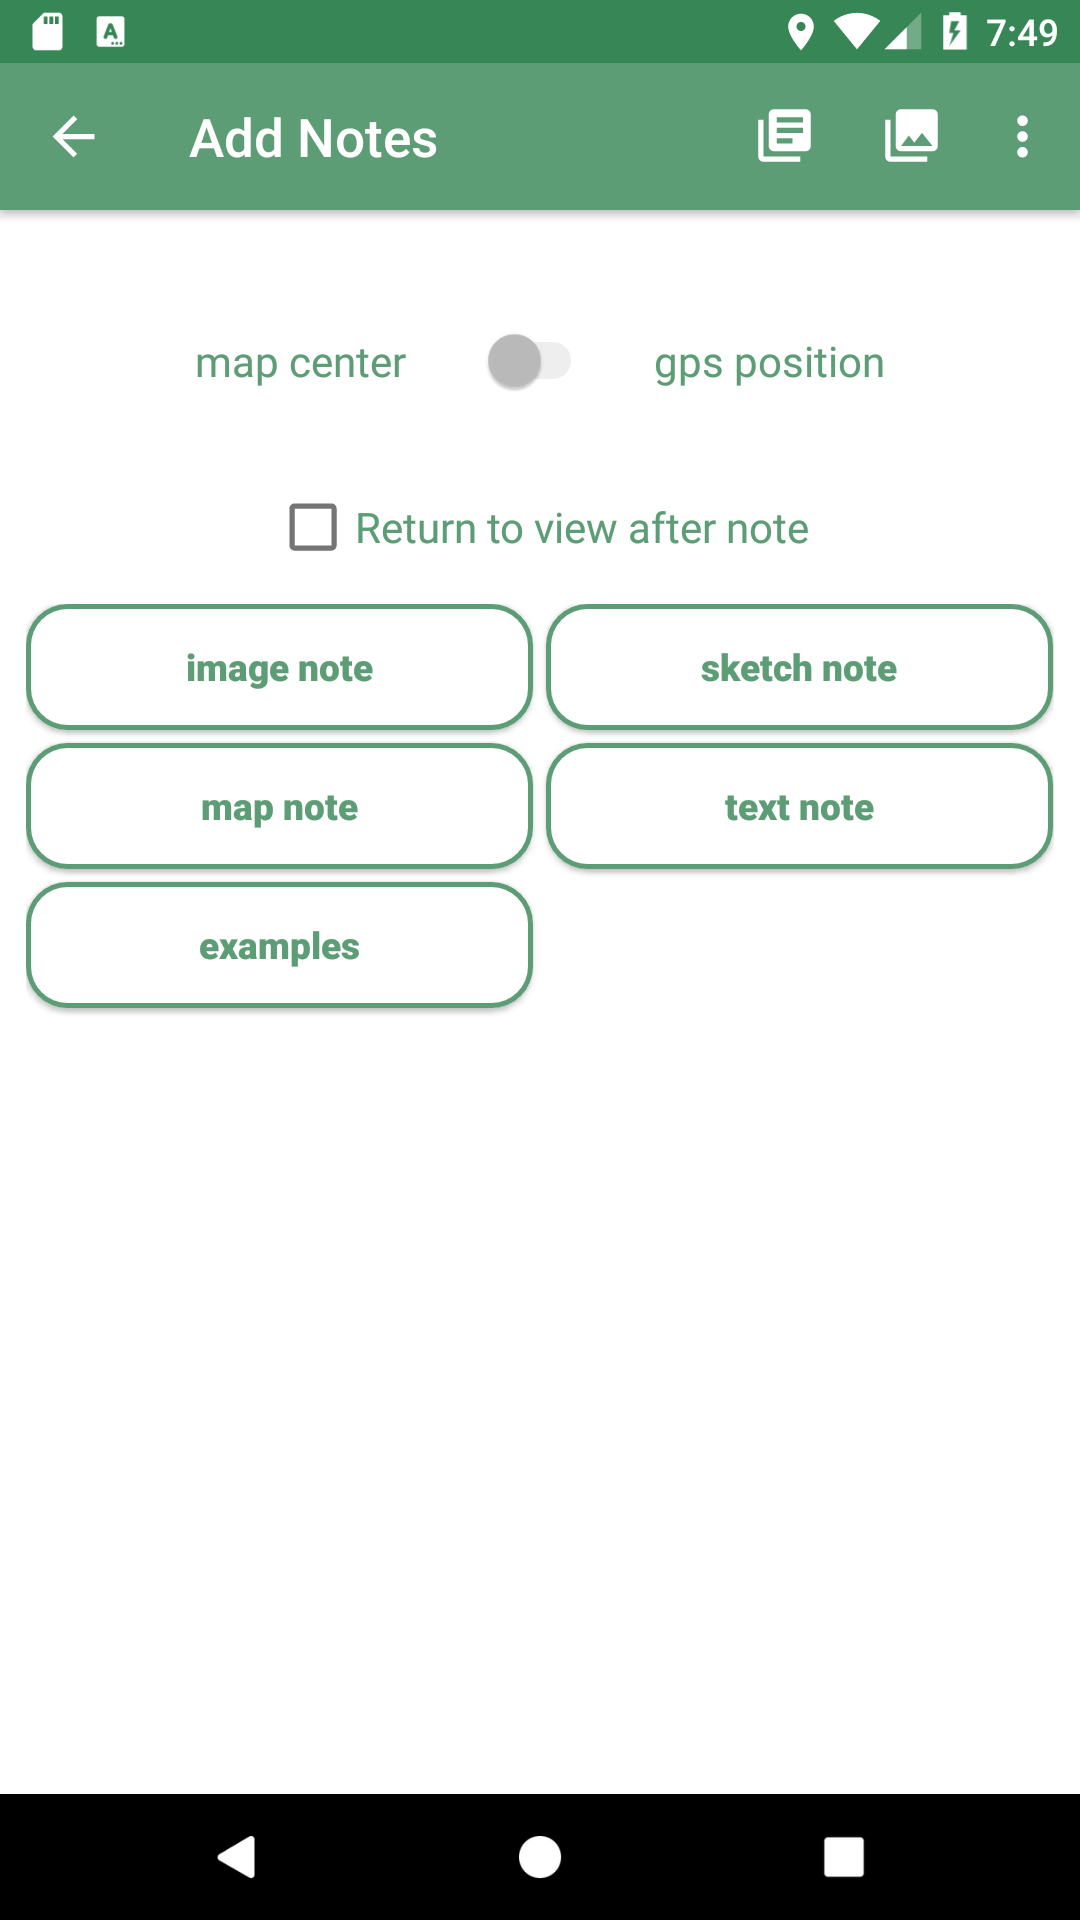
The switch button at the top of the view gives the possibility to choose whether the note will be recorded with the current GPS position (in case GPS is on) or at the current center of the Map View (the crosshair). If the current GPS position is not available, it will not be possible to move the slider to the gps position setting.
The Return to view checkbox returns you to the Add Notes screen after you finish your note. If the box is not checked, you will be returned to the dashboard in the Main View.
At the right end of the actionbar are the quick note buttons. From left to right:
-
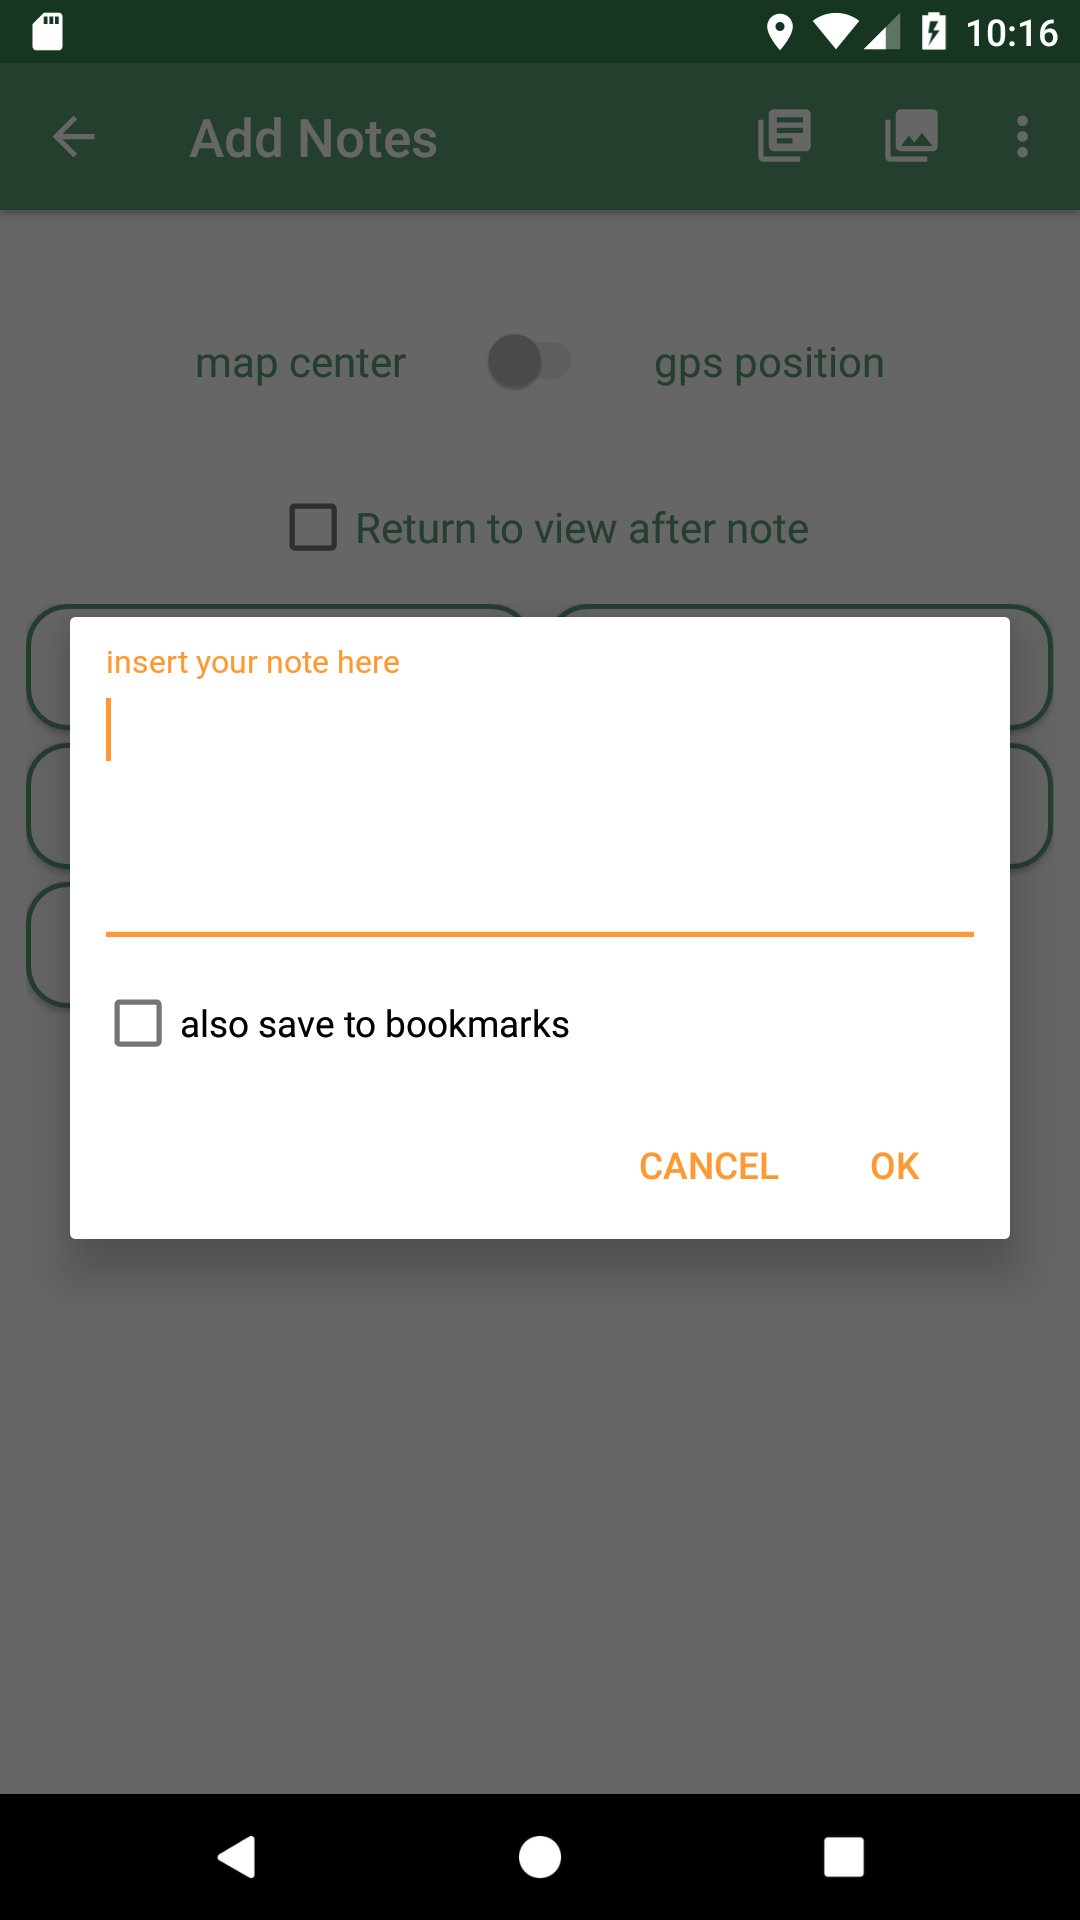
The Quick text note button opens a simple dialog where a text note can be written. Want to save the note? Tap on the ok button. Want to trash it? Tap on the cancel button.
| The position of the note is taken when the note view is opened, not closed, in order to have all the time needed to insert the text while moving. |
-
The Quick picture note button will launch the camera application that comes with your android system which gives lots of possibilities of customization of the images size, focus and so on. This has one drawback, which is the fact that we are not able to pick the azimuth of the camera shot at the exact moment it is taken. The azimuth is therefore recorded at the moment the camera application is closed. That means that to have a realistic azimuth, you need to take the picture and stay with the device in the same position of the snapshot until you have closed the camera app.
-
The Menu button, which allows you to select Simple Sketch to draw on a small panel or select Layout Settings to change the layout Notes buttons and their text size.
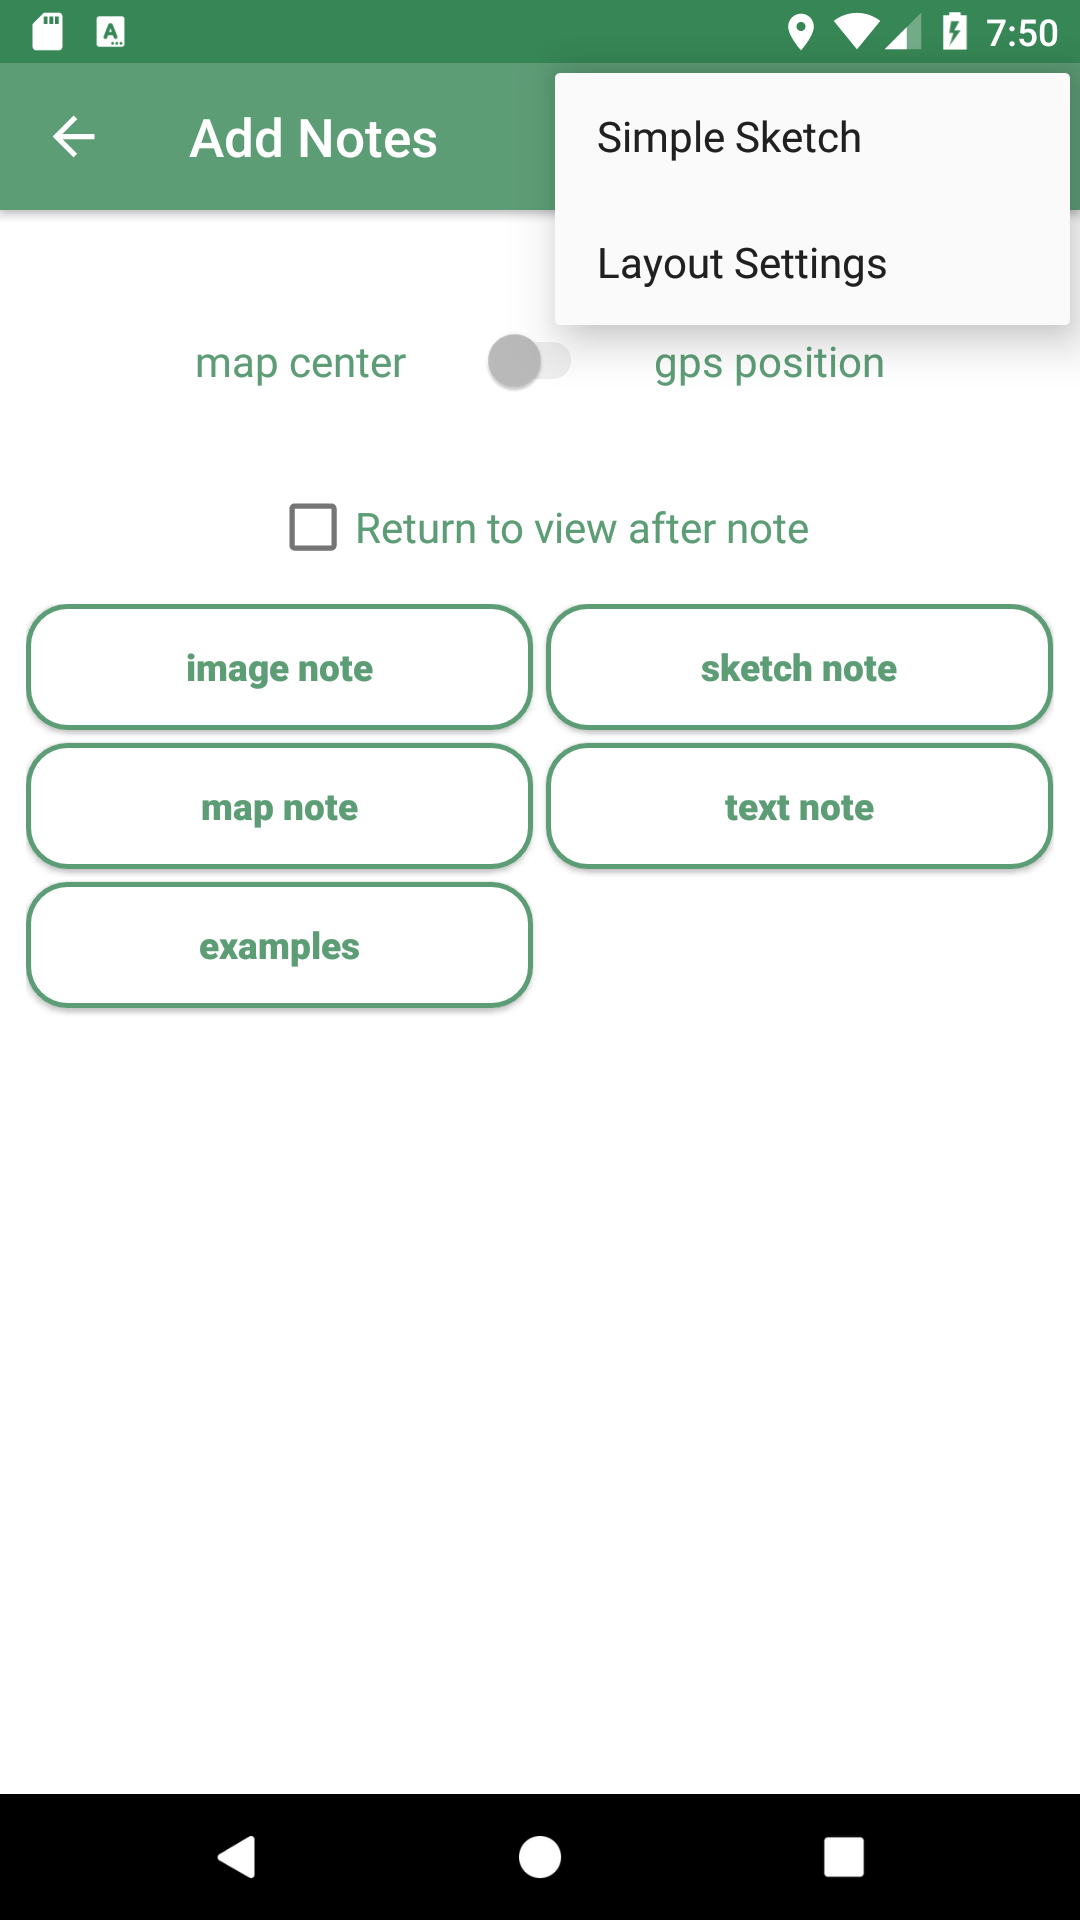
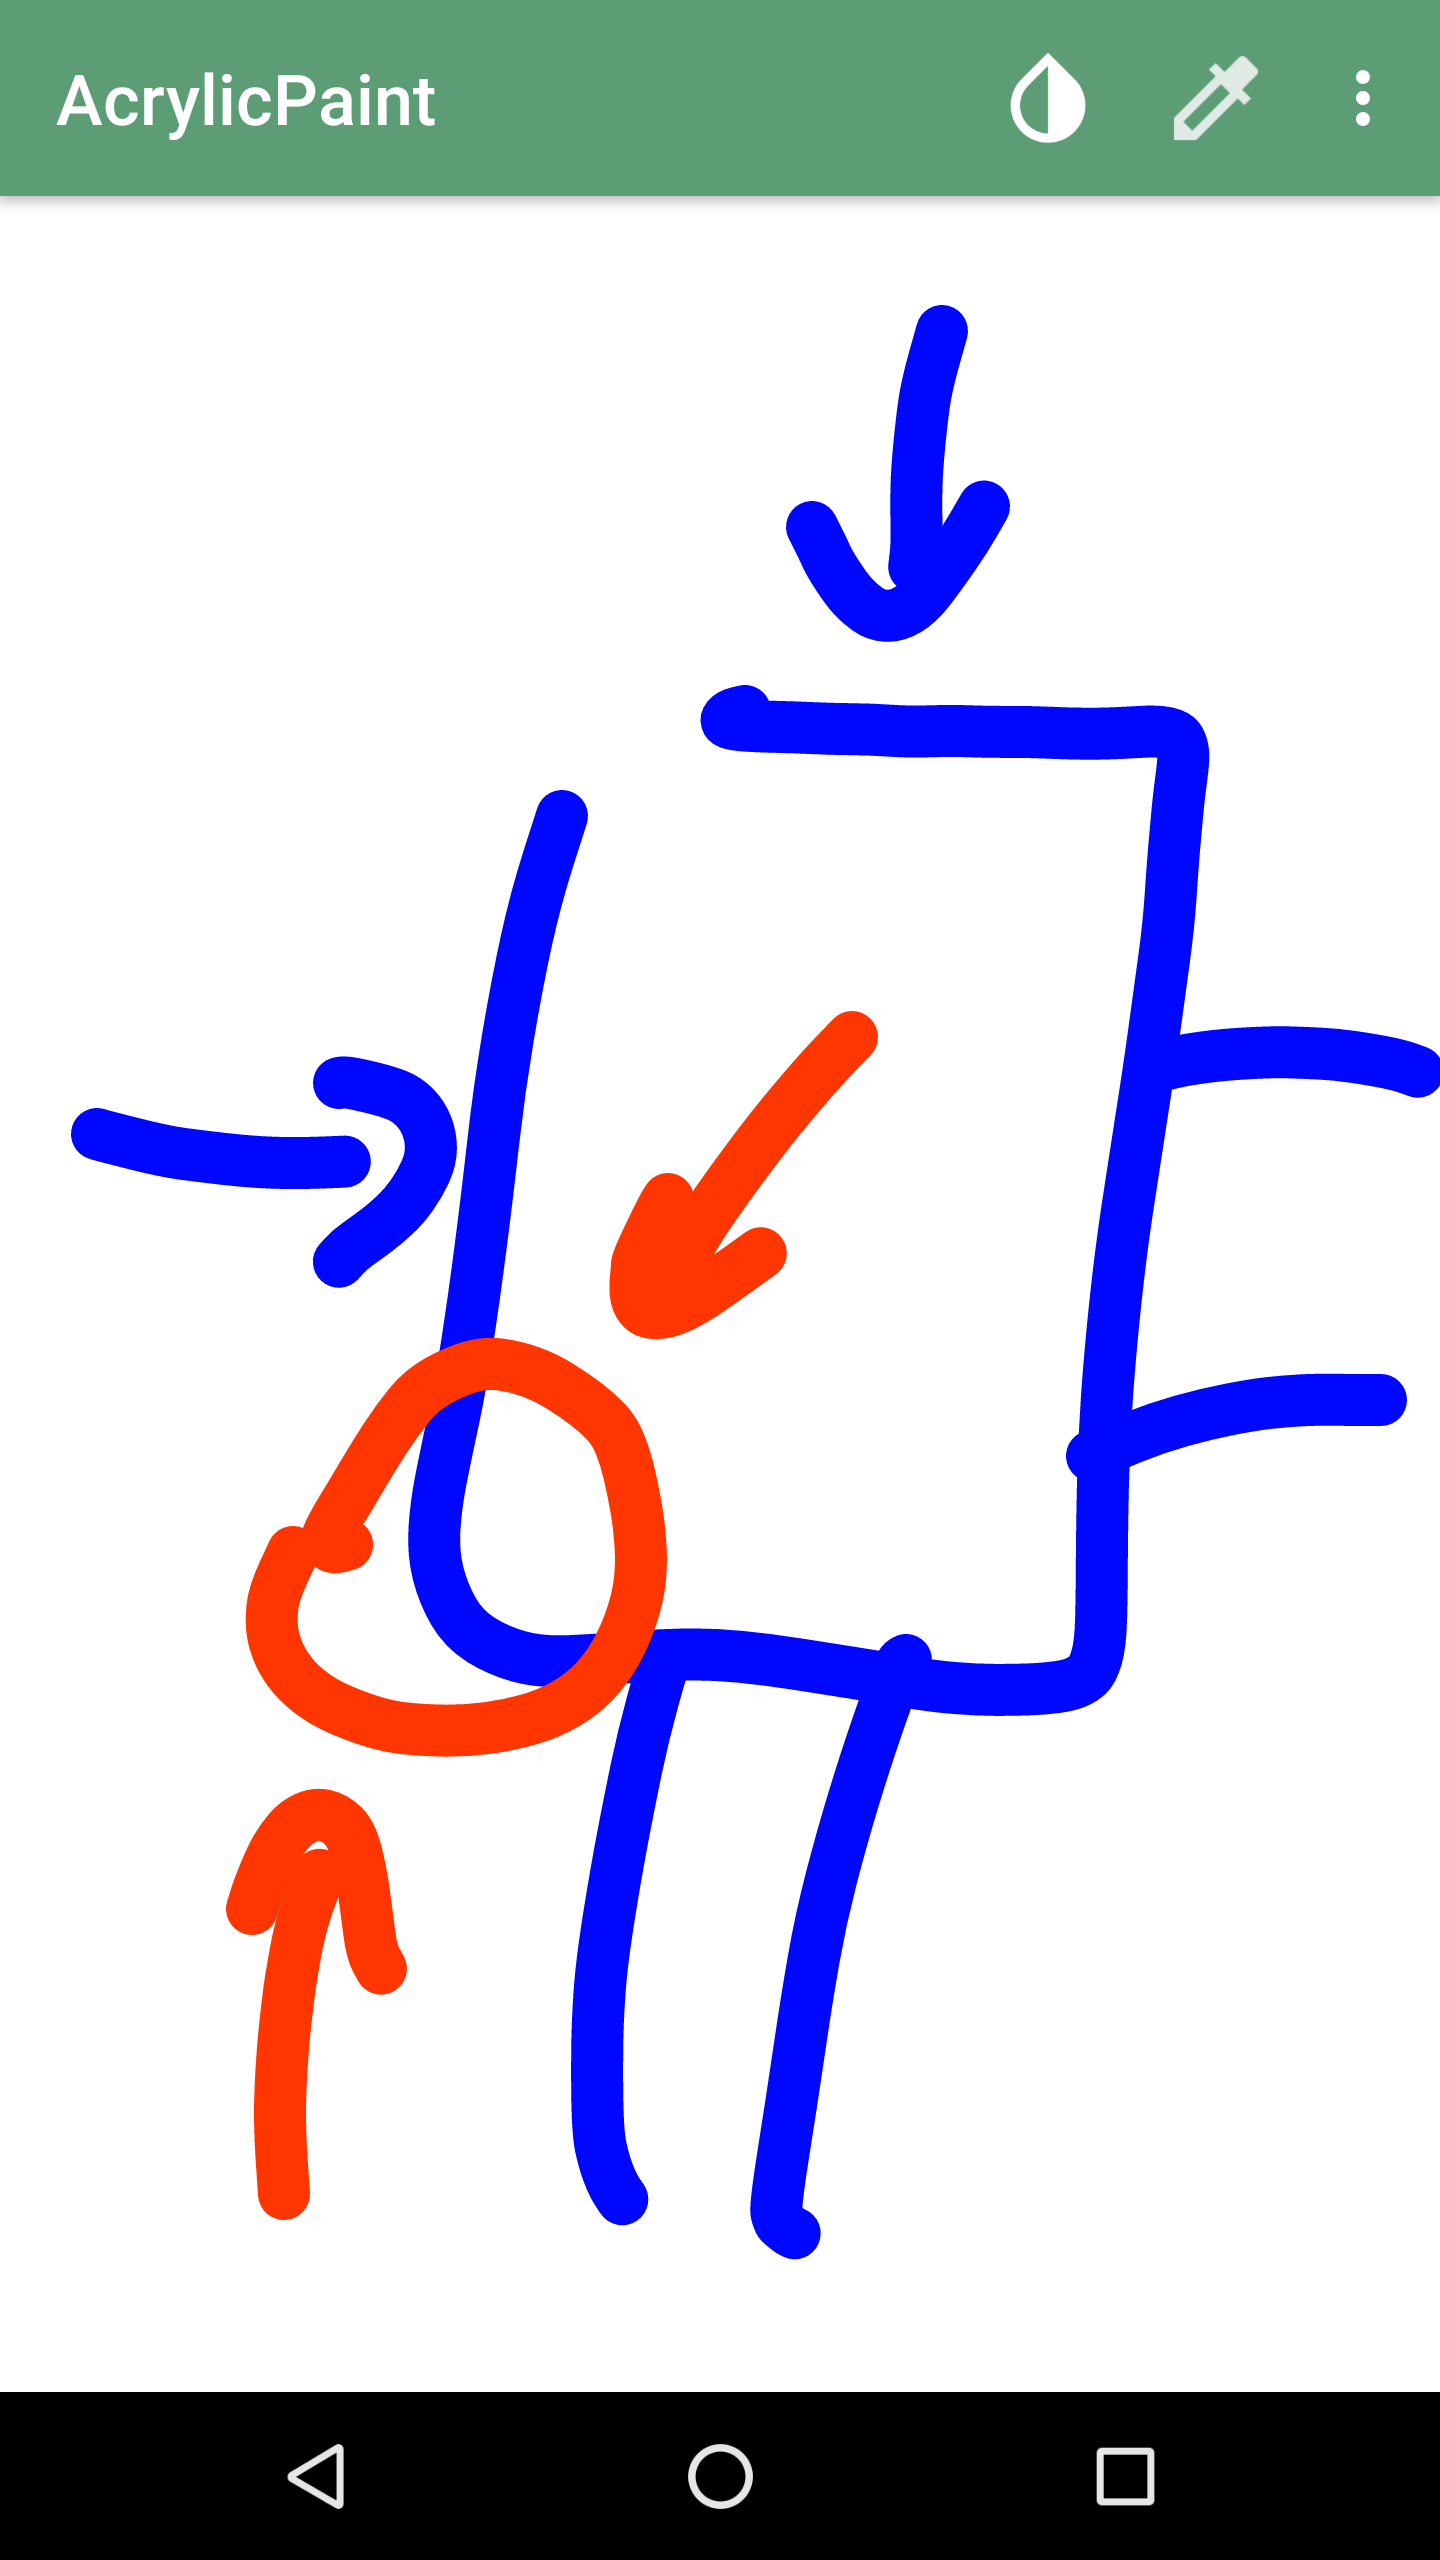
Selecting Simple Sketch, you can change stroke style, color, and width. The sketch panel comes from the open source app Acrylic Paint.
| If your device has room in the Action Bar, for example holding your phone in landscape instead of portrait, the Simple Sketch icon will appear in the Action Bar and the Simple Sketch item will be removed from the menu. |
| Once a simple note has been saved, it can’t be modified. |
Selecting Layout Settings allows you to change the text size on the Note buttons and the number of columns. This can be useful to make the Add Notes screen easy to read while in the field.
Form based notes
Form based notes allow you to take complex notes containing detailed information. Some example forms are included in the installation of geopaparazzi.
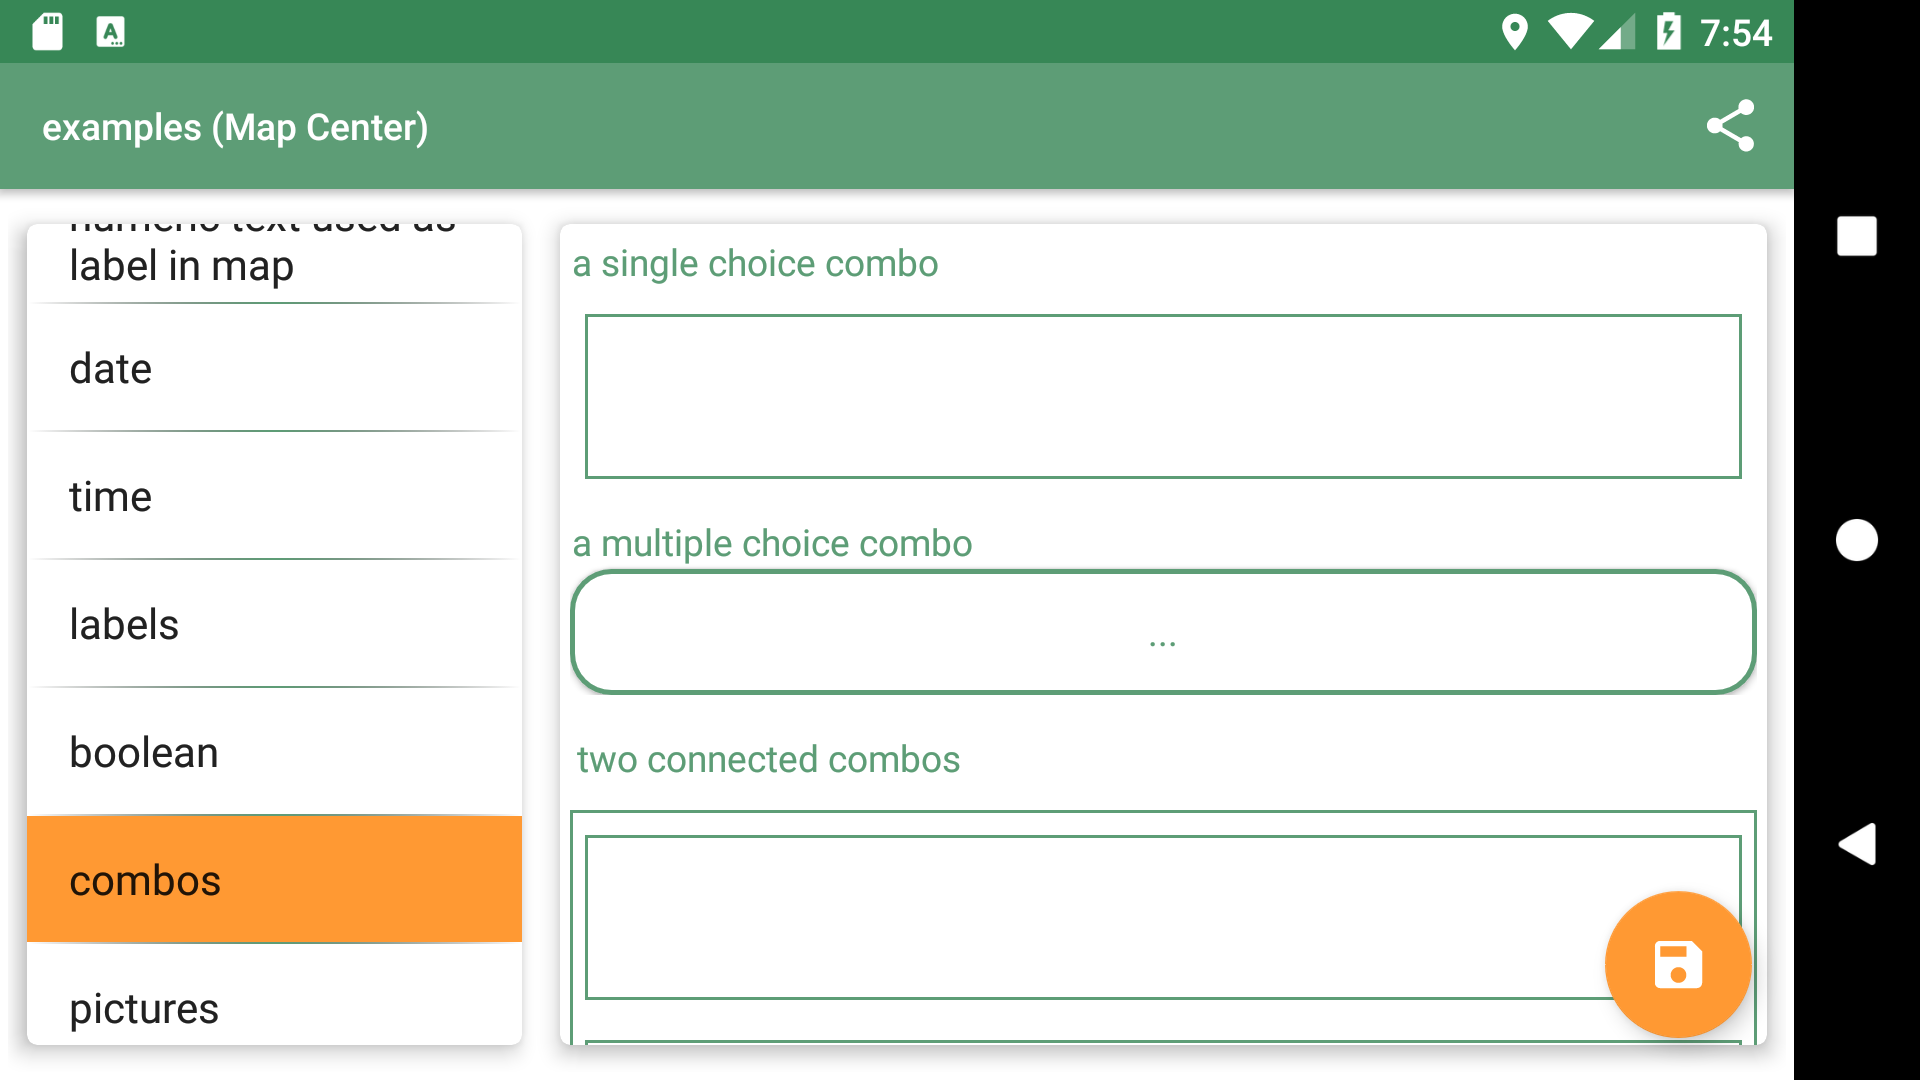
The example button in particular shows all the possible form widgets available:
The notes can be saved and modified at any time.
To understand how to create forms, have a look at the section dedicated to [forms].
3.3.2. Project Info
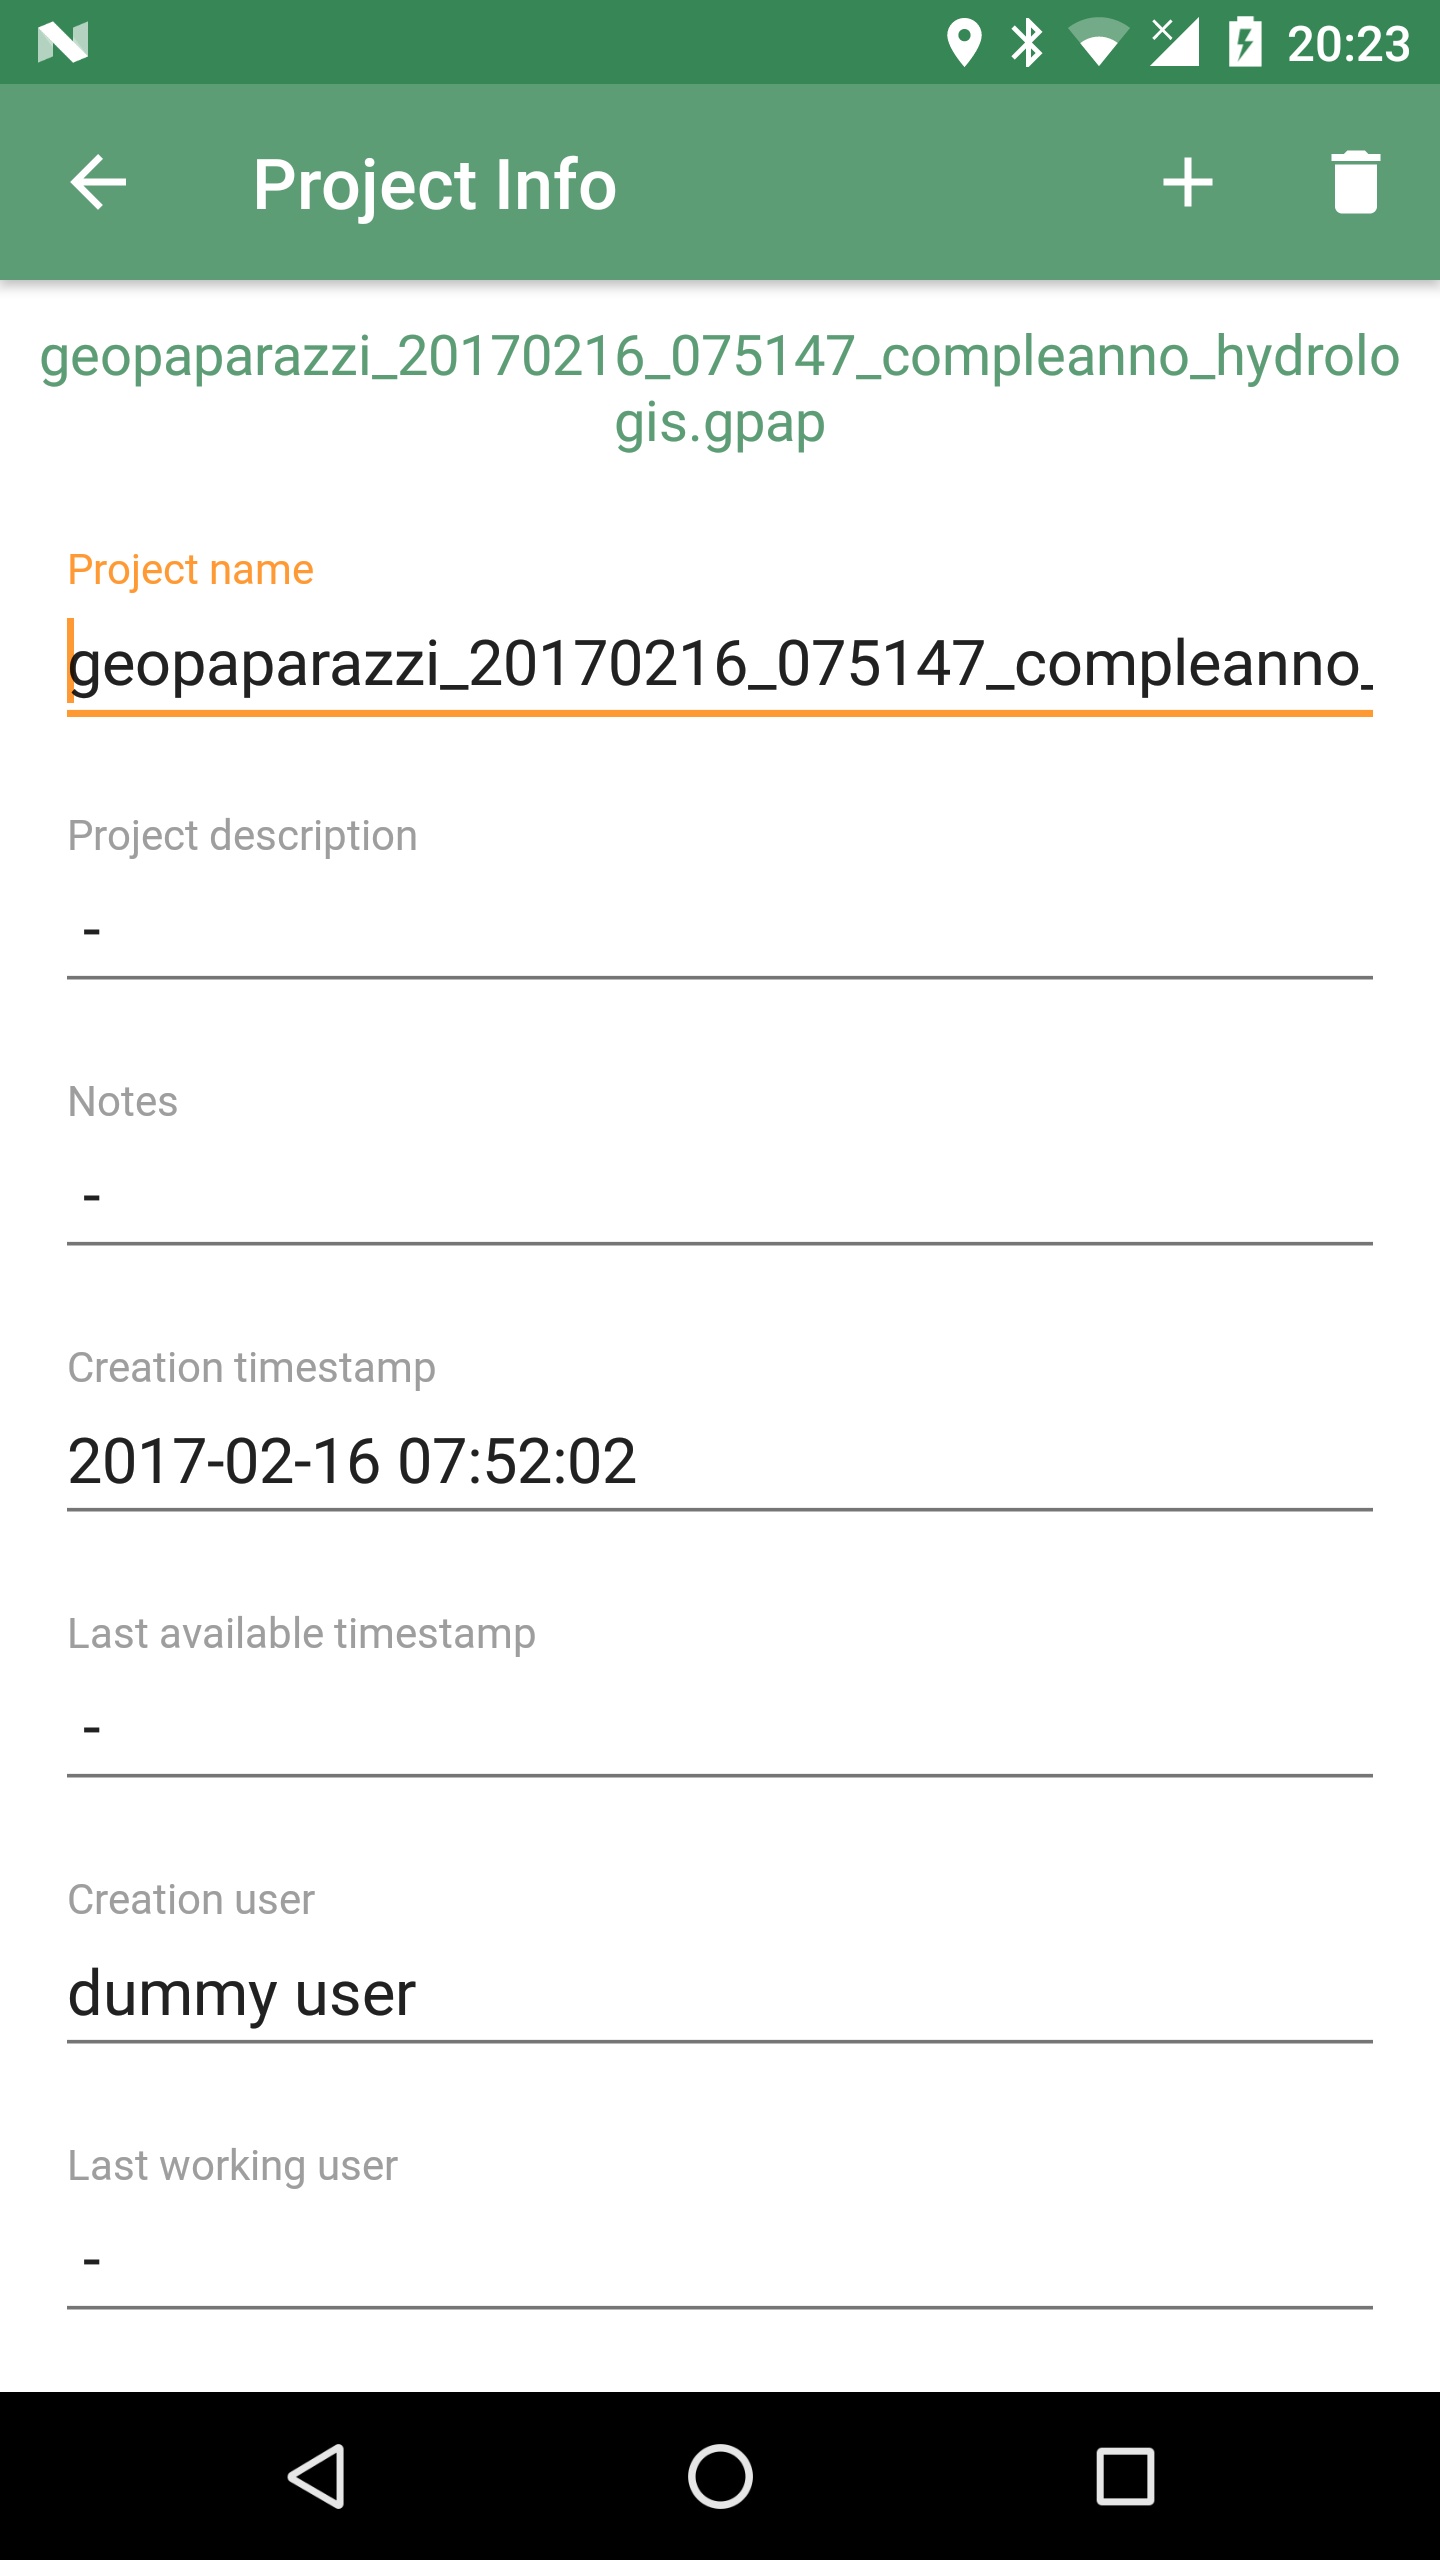
The Project Info screen shows information about your current Geopaparazzi project database.
It shows:
-
the database file name
-
the project name
-
the project description
-
project notes
-
creation and last closing dates
-
the user that created the project
-
the user that last modified the project
Apart from the dates, that are set by the system, all data can be changed and saved through the save button.
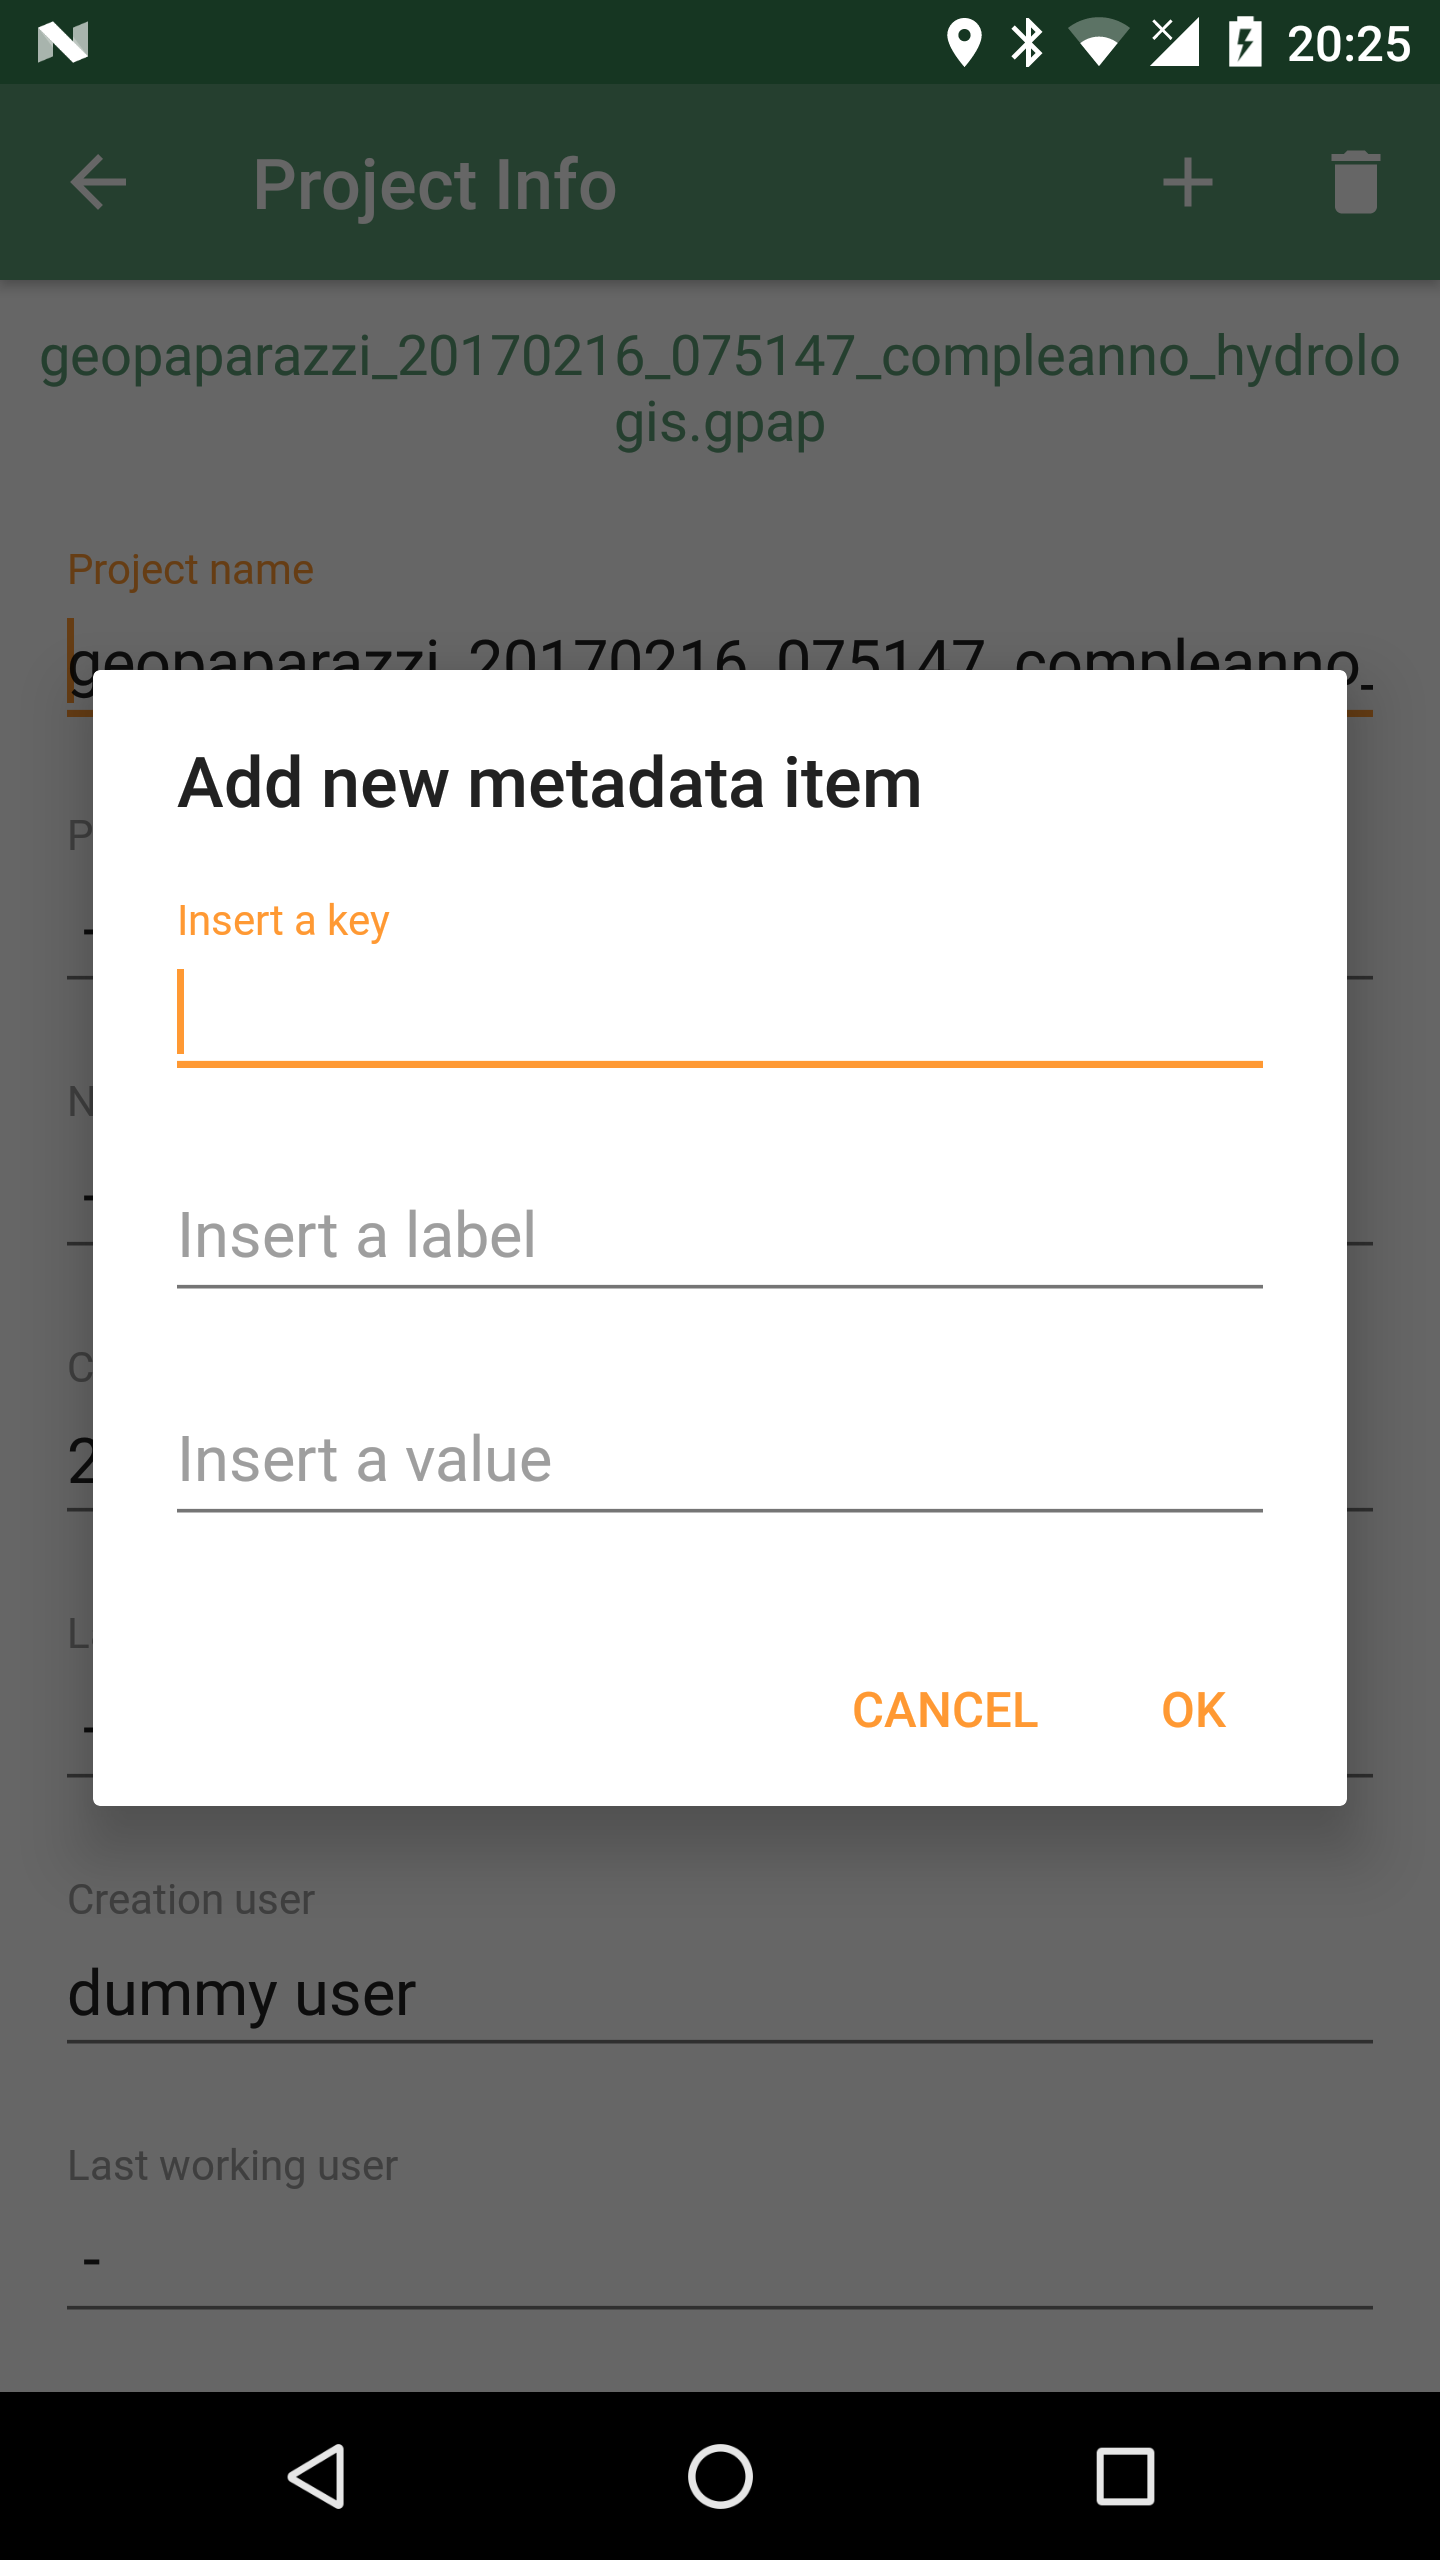
It is also possible to add additional metadata to the project information. The plus button at the right side of the actionbar opens an input dialog that allows the user to define a key, a label and a value for the new metadata entry:
3.3.3. GPS Logging
To start logging, the user simply has to push the logging button.
Once it is tapped, the user is prompted to insert a name for the log or to accept the one generated based on the current date and time ( log_YYYYMMDD_HHMMSS ).
It is also possible to attach the new log to the last created log by checking the box: Continue last log. In that case the proposed name of the log (or any user inserted) is ignored, since no new log is created.
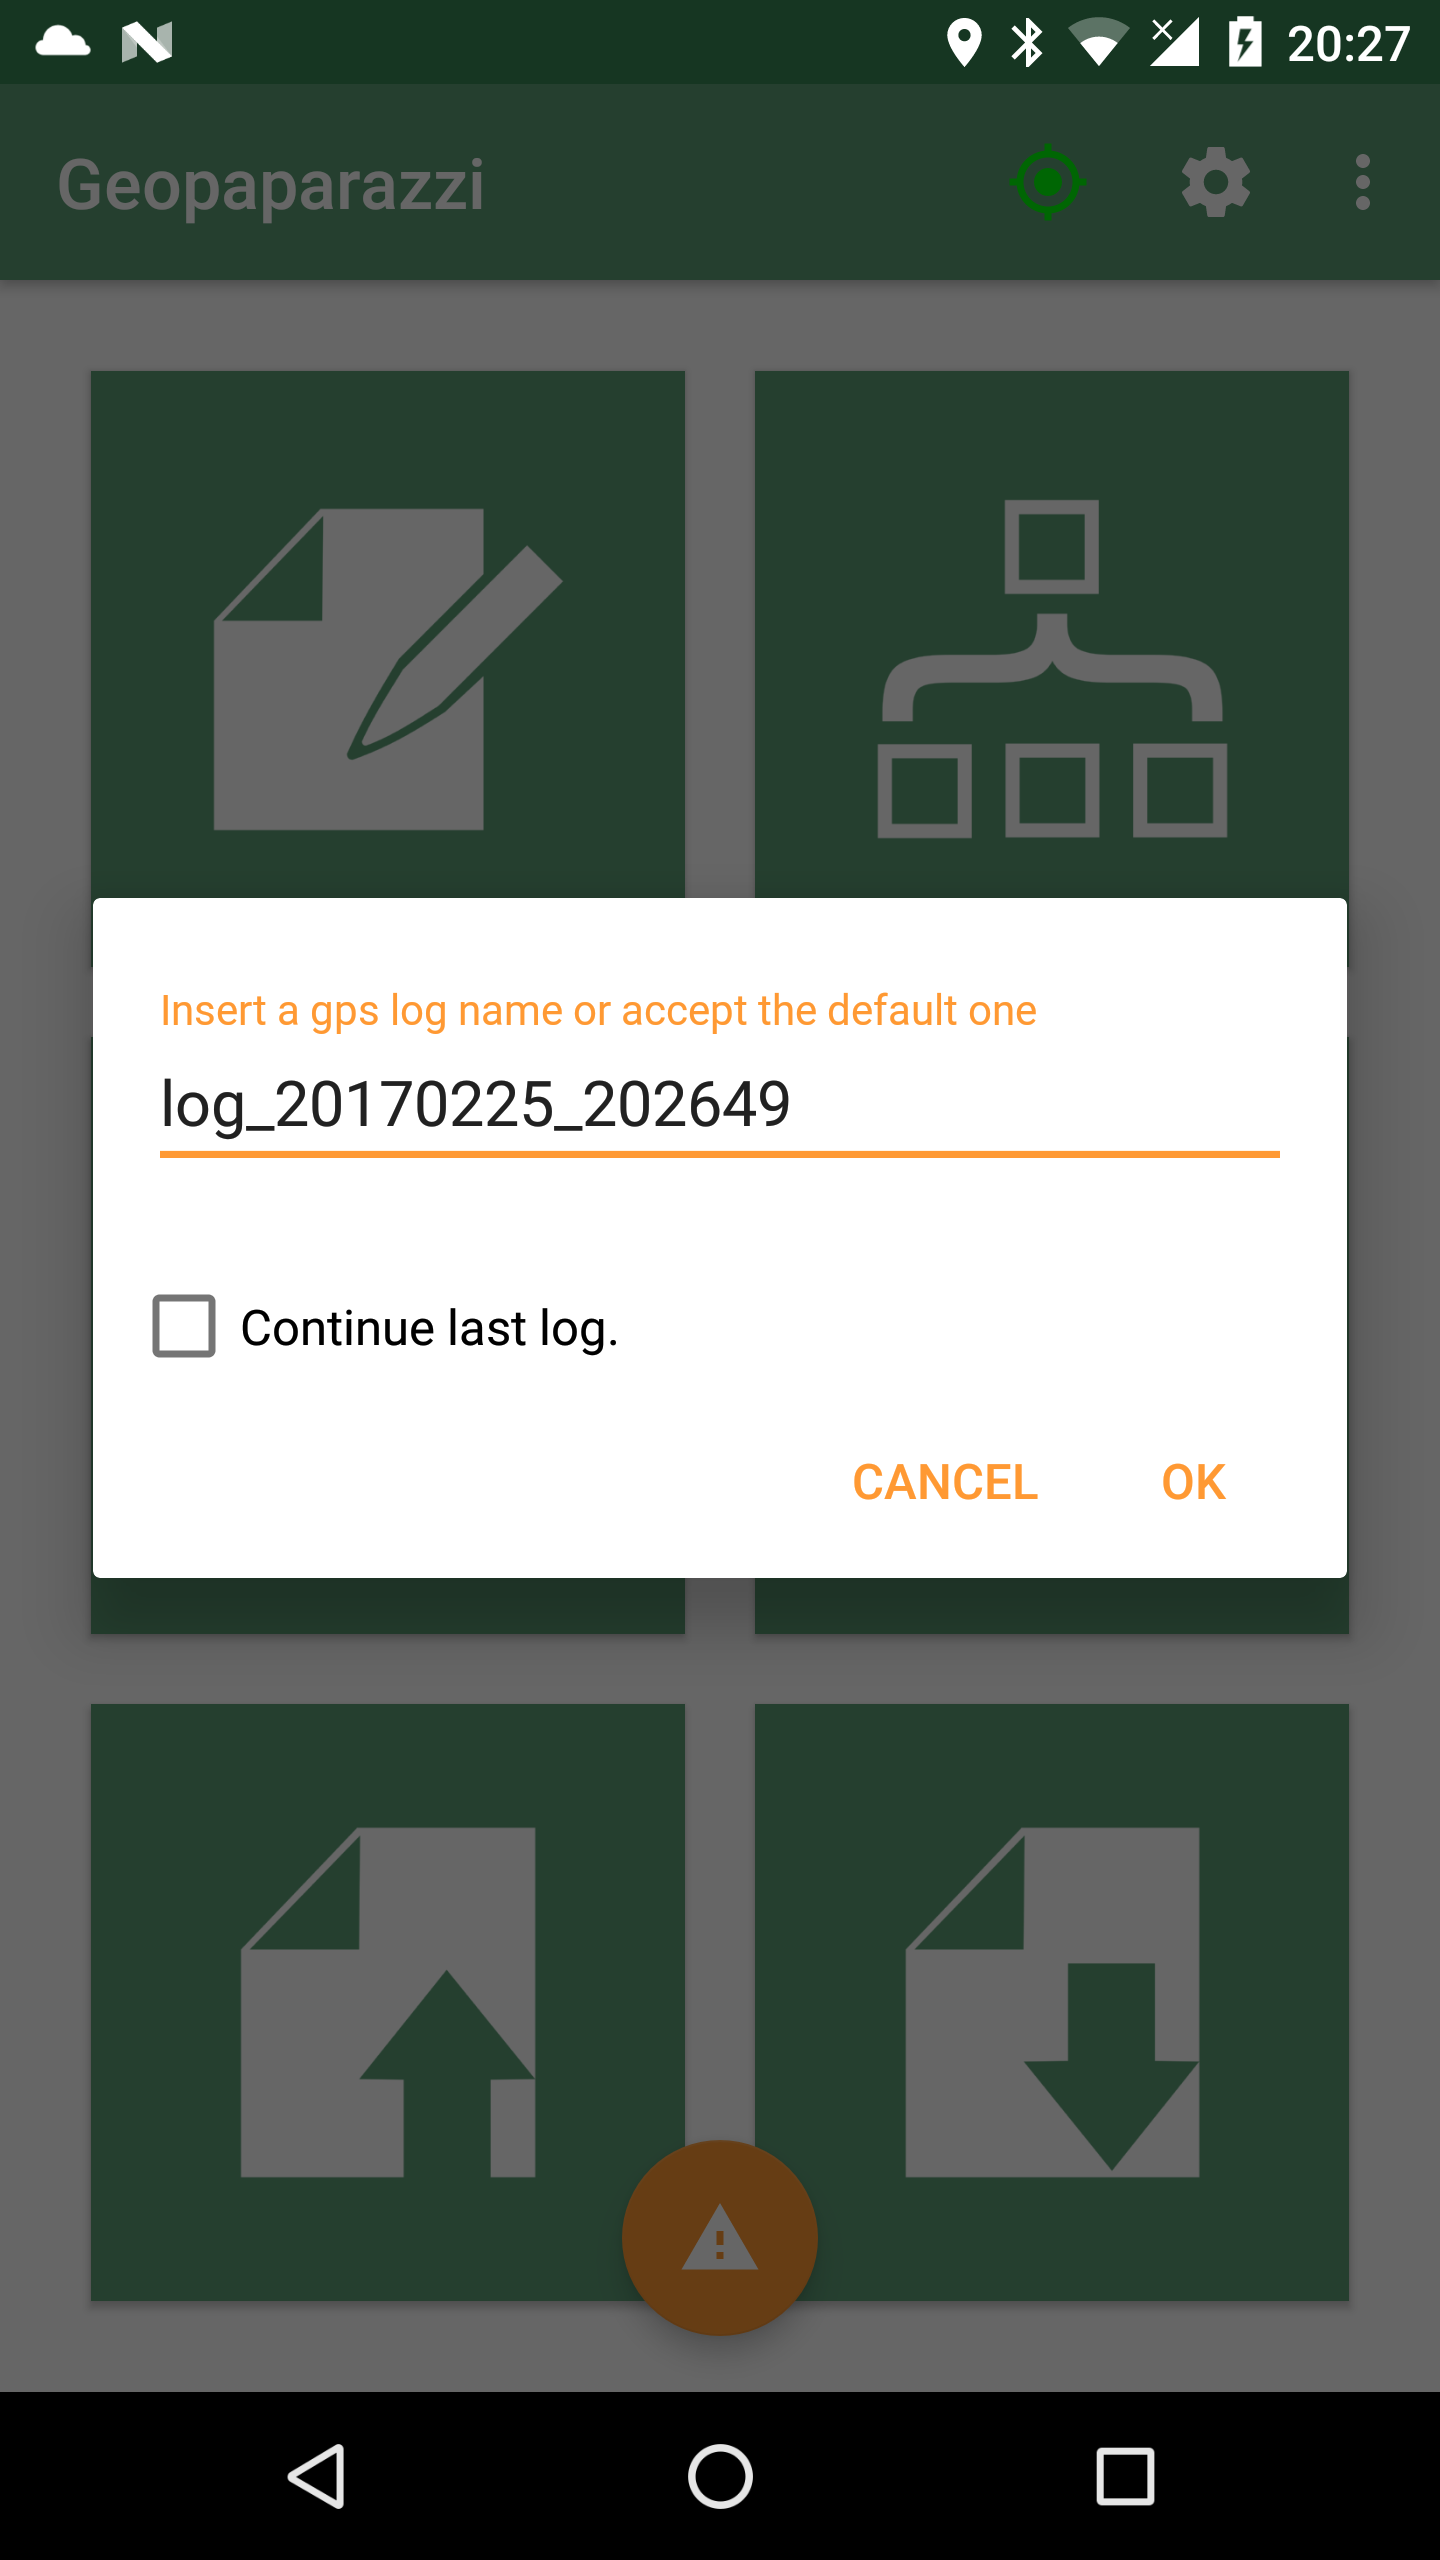
Once logging has started, the GPS logging button will turn orange and the GPS status icon blue.
To stop logging, the same button is used. Once tapped, you are prompted to verify the action.
3.3.4. Map View
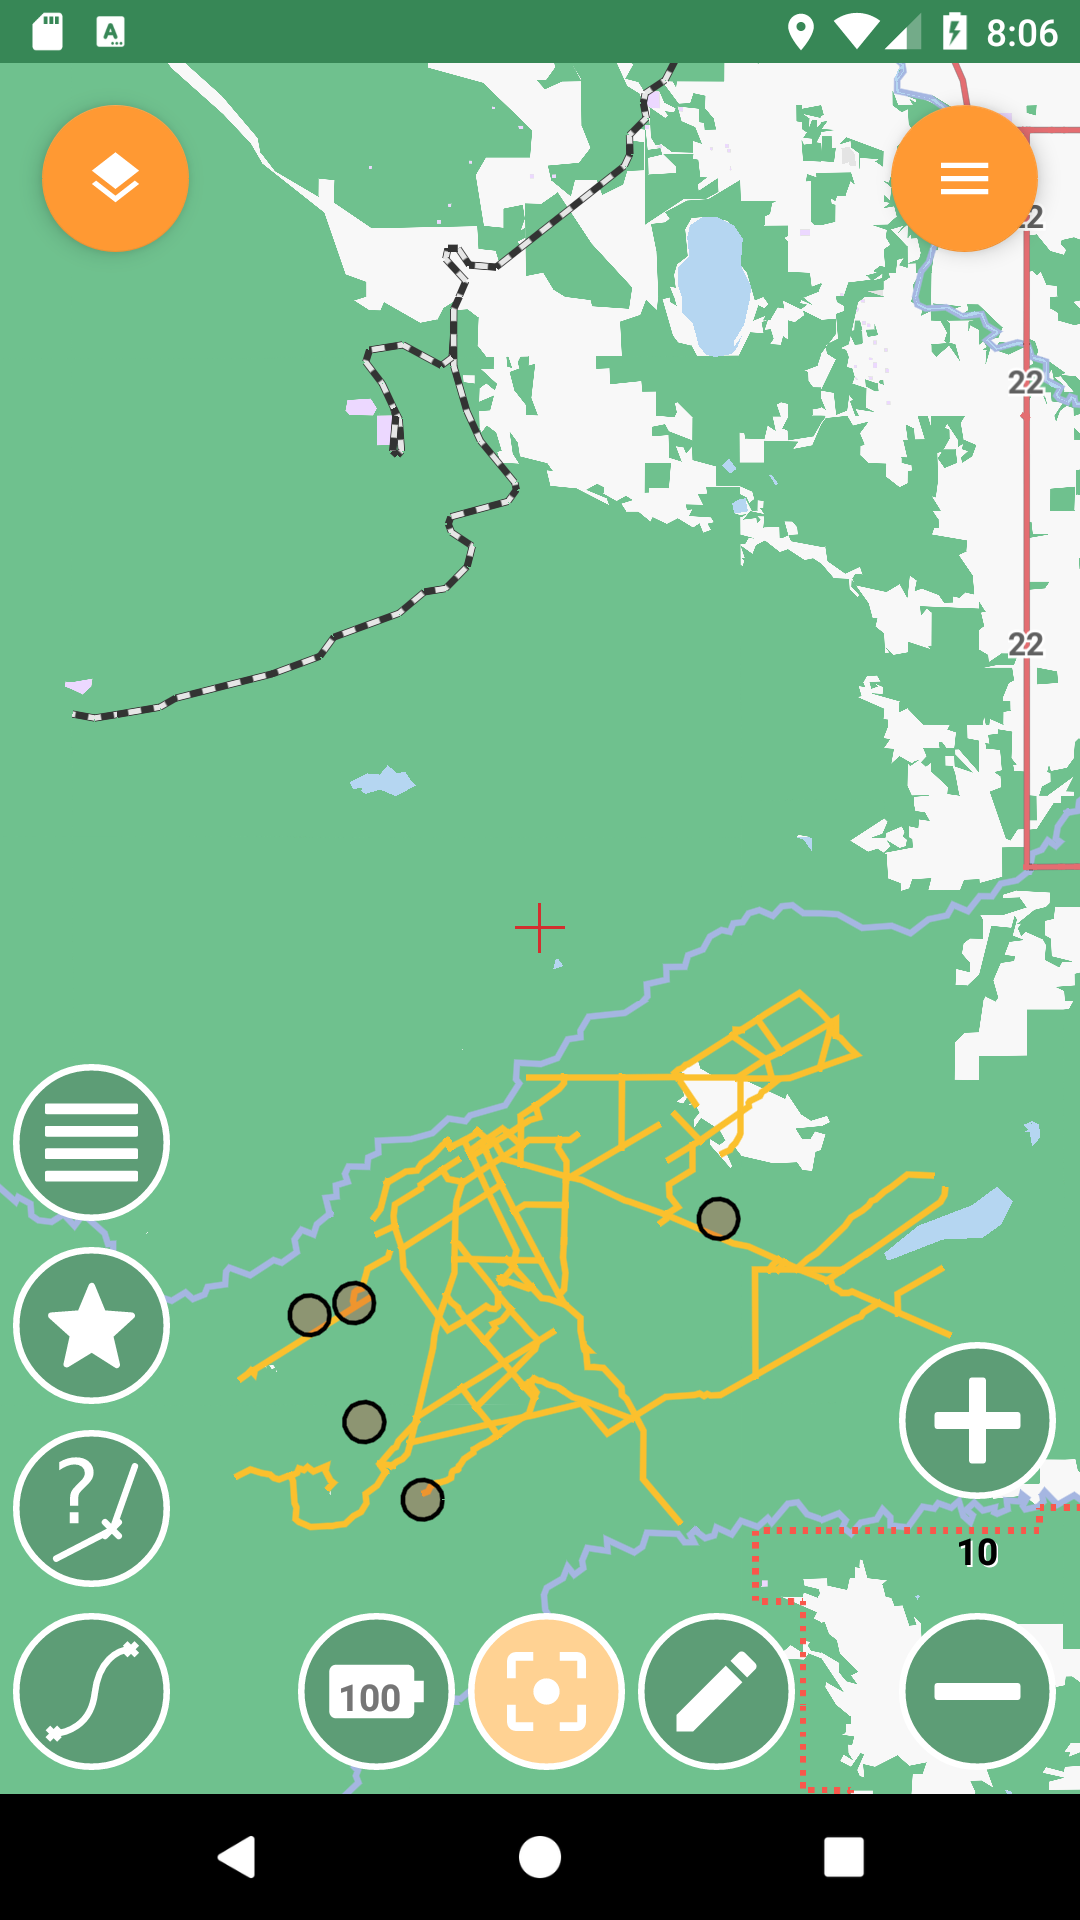
The Map View presents a map and a set of tools that can be used to navigate the map, make measurements, or edit datasets. The various tools are described in the section dedicated to the Map View.
3.3.5. Import
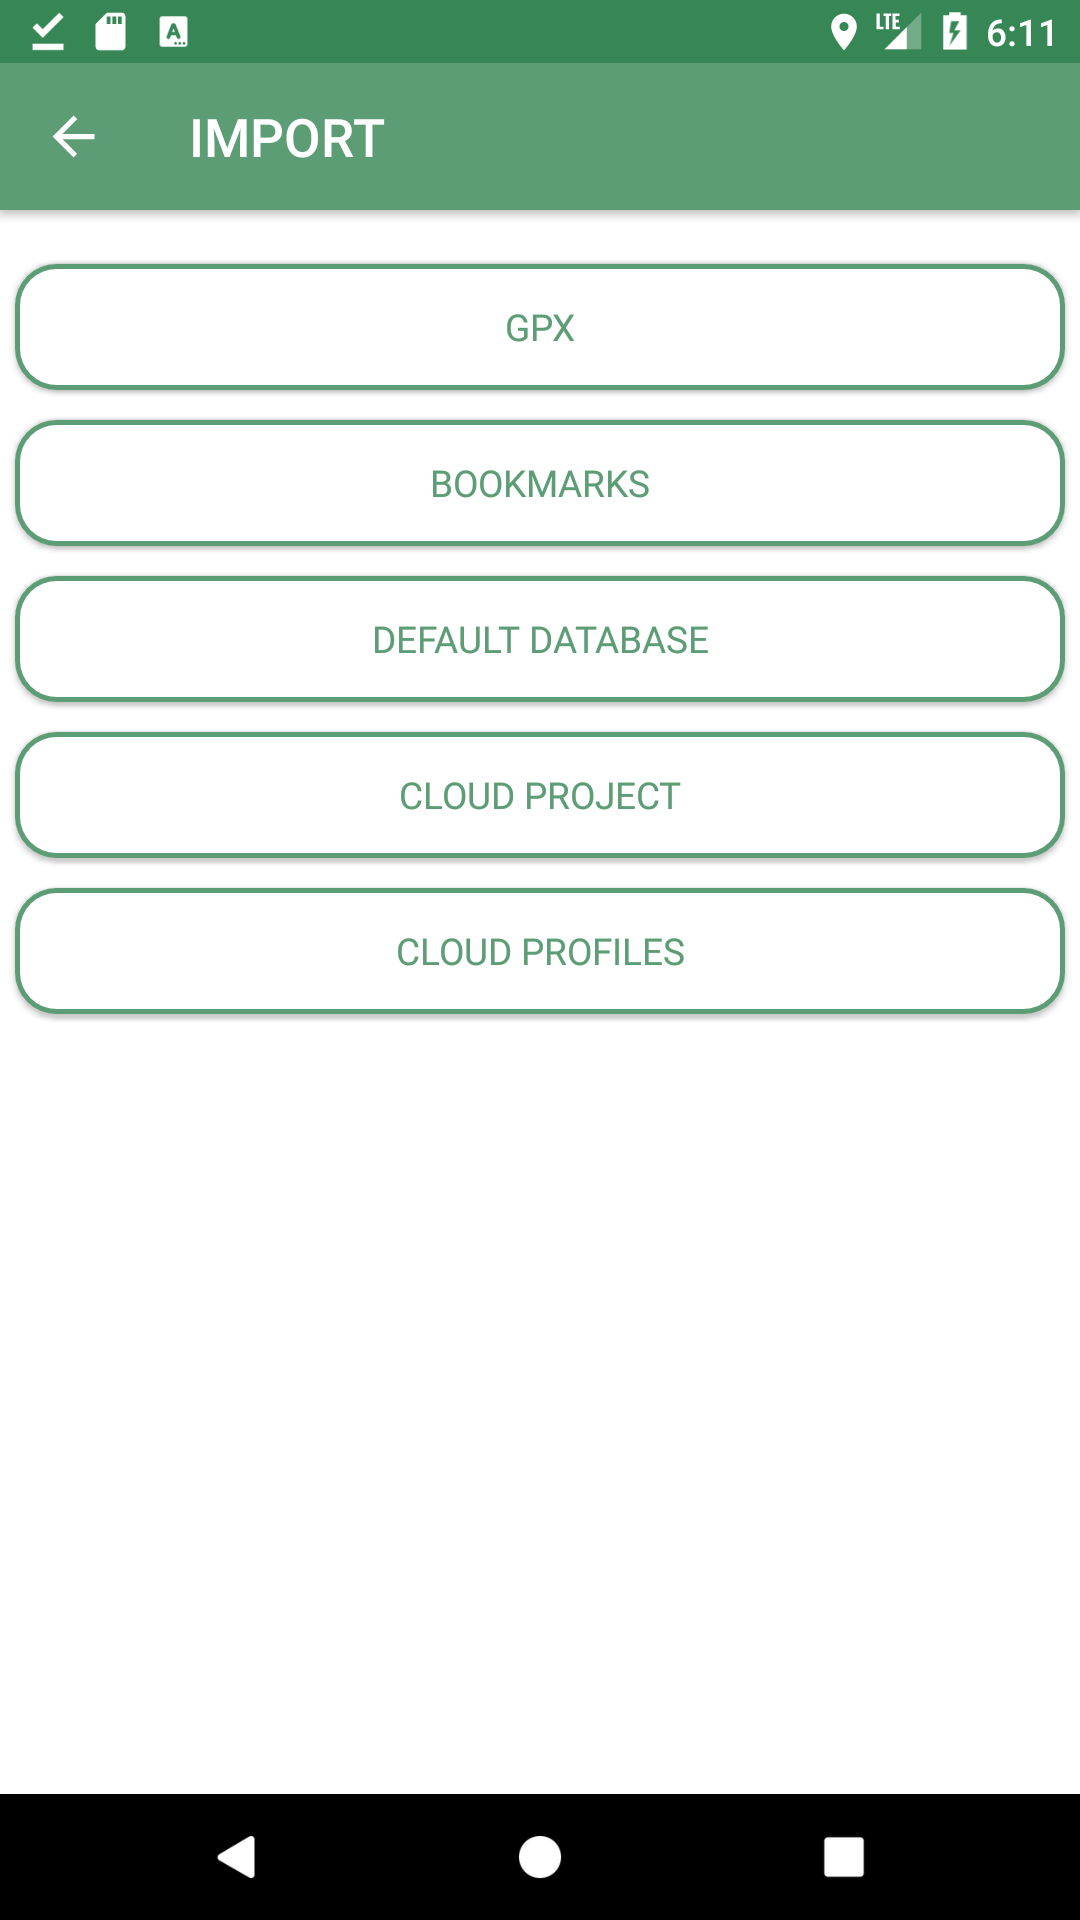
Geopaparazzi supports the import of:
-
GPX datasets
-
bookmarks
-
default Spatialite database
-
geopaparazzi cloud projects
-
geopaparazzi Cloud Profiles
GPX
By tapping on the GPX icon, a simple file browser is shown to import your GPX file.
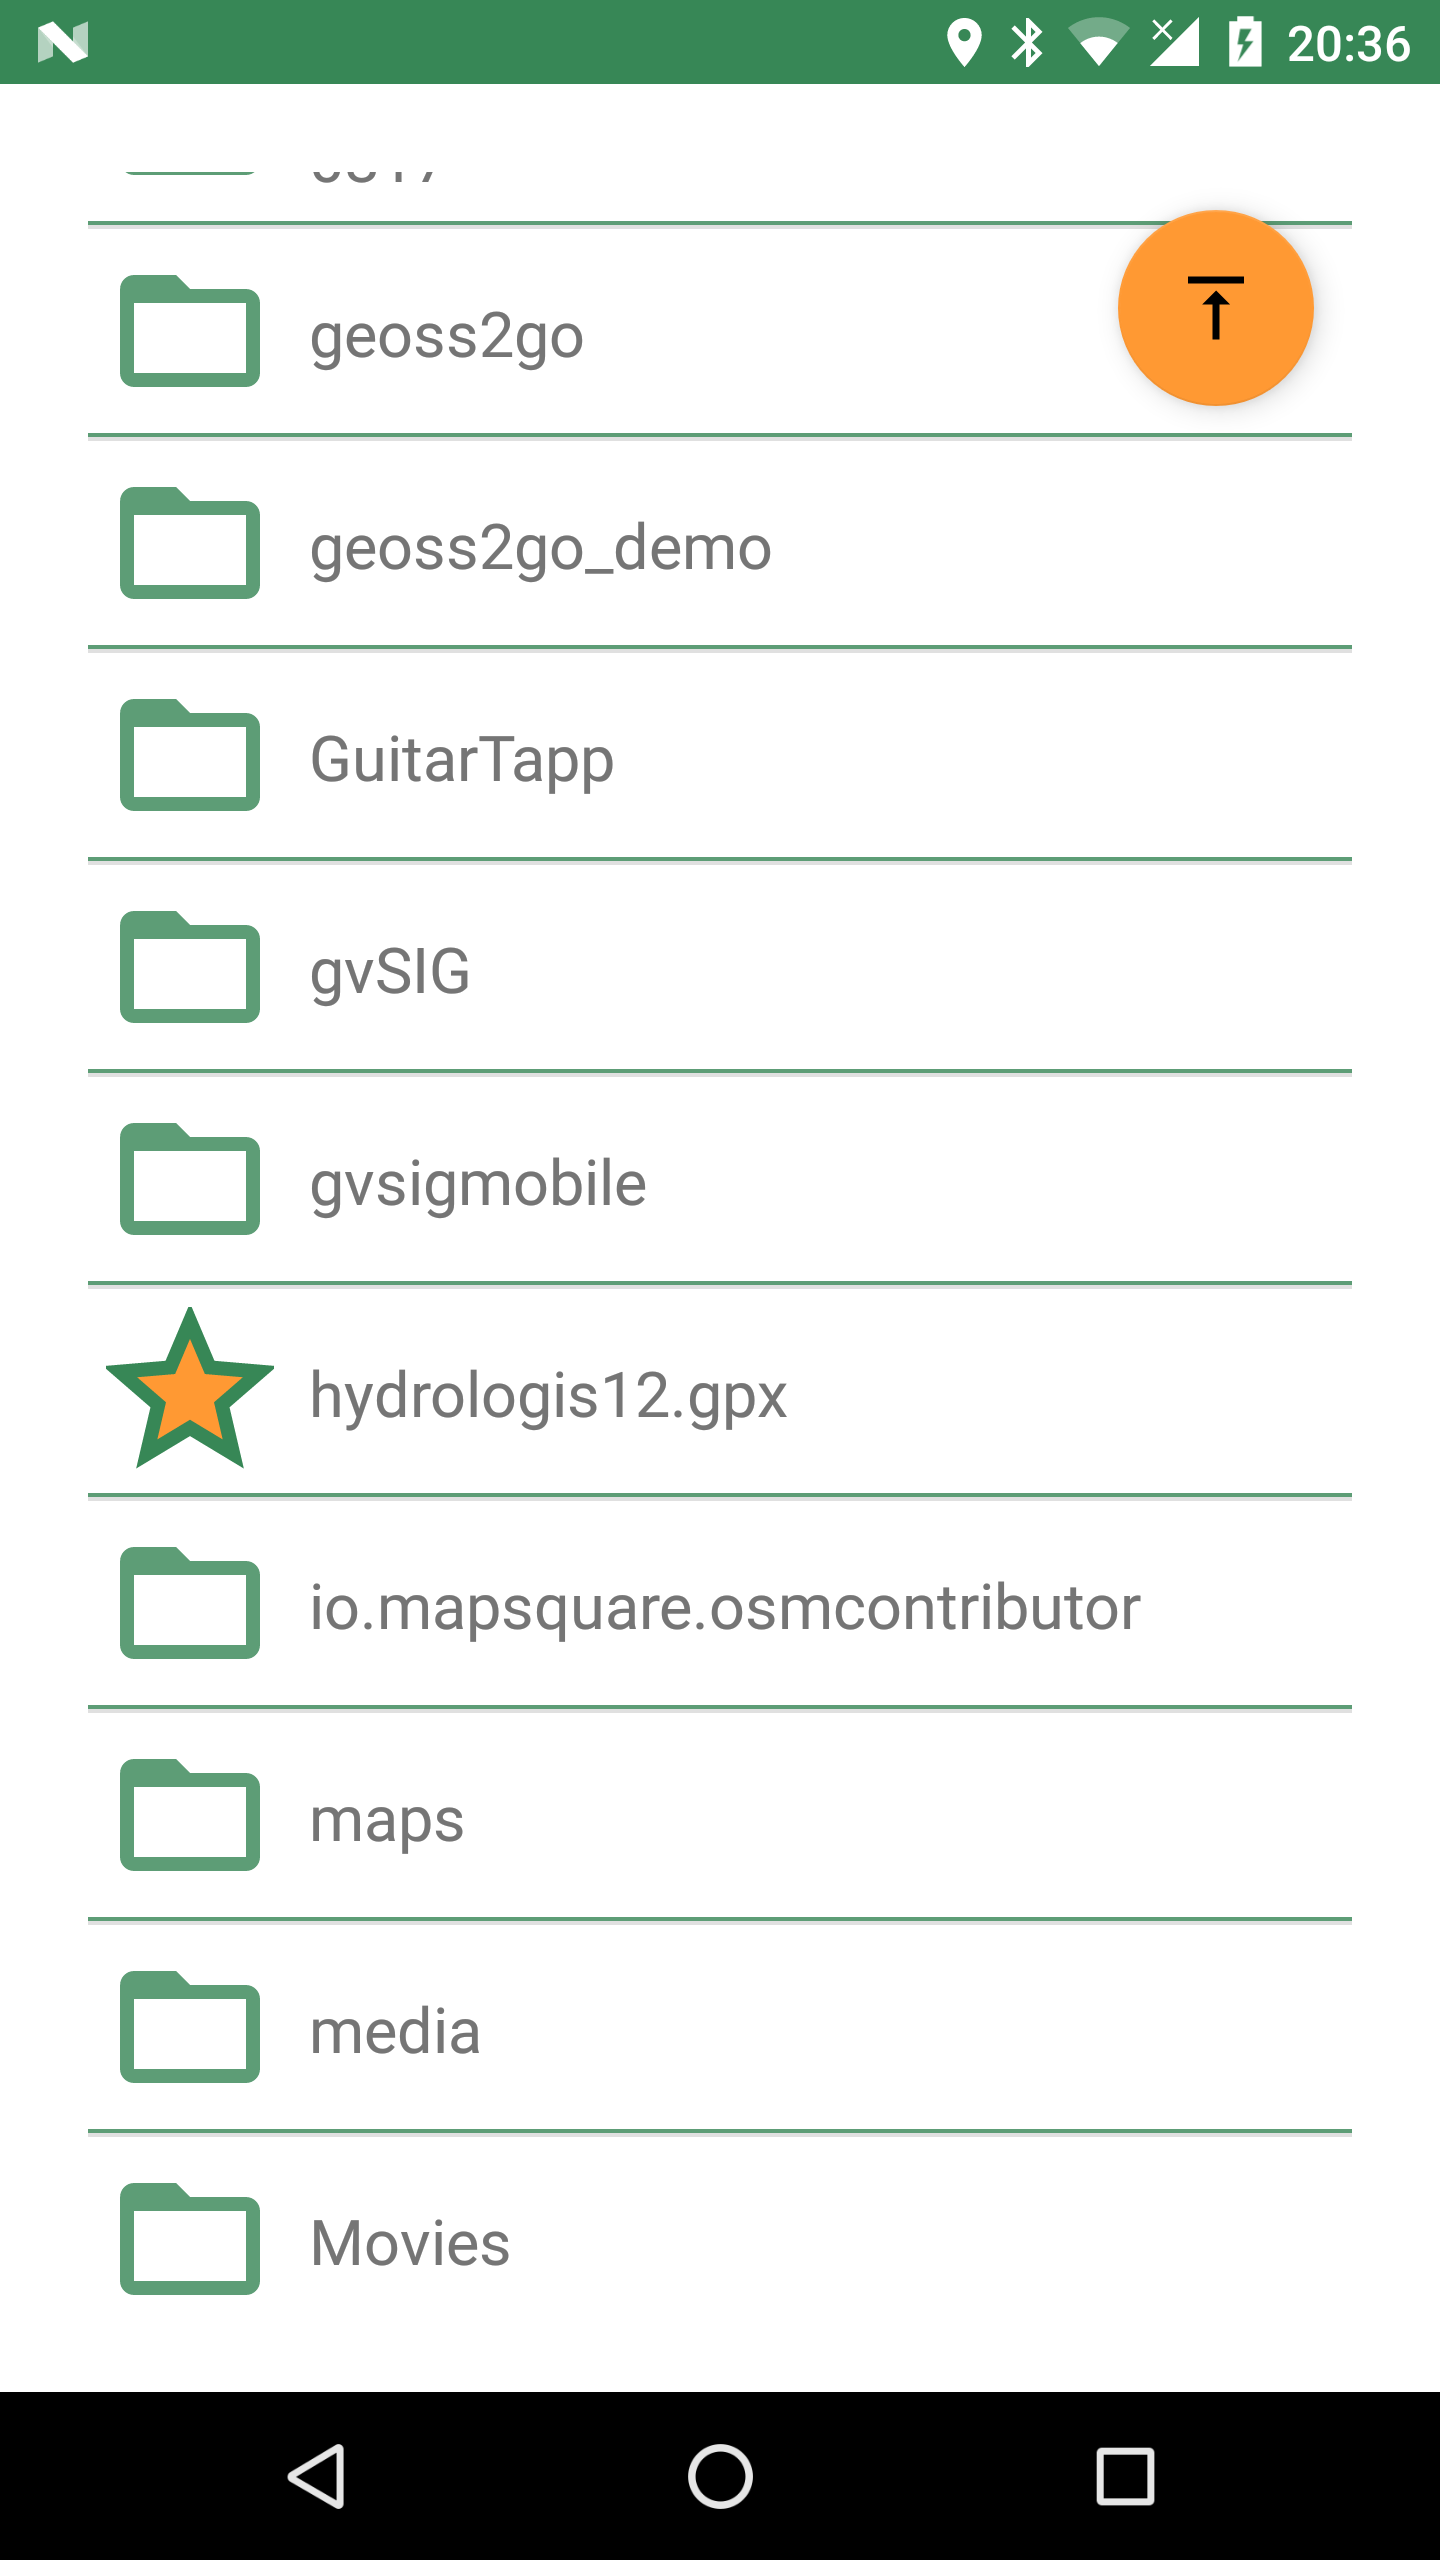
The browser only shows folders and files with gpx extensions. On selection, the file is imported into the current project.
Bookmarks
Bookmarks can be imported from csv files that must be placed in the root of the sdcard and the name of which has to start with the part bookmarks and to end with the extension .csv.
Geopaparazzi will let you select the files to import if more than one are available import only those that do not exist already.
The format of the csv is: NAME, LATITUDE, LONGITUDE as for example:
Uscita Vicenza Est, 45.514237, 11.593432
Le Bistrot, 46.070037, 11.220296
Ciolda, 46.024756, 11.230184
Hotel Trieste, 45.642043,13.780791
Grassday Trieste,45.65844,13.79320
Default databases
When tapping the default database import button, you are asked to name the new Spatialite database to create, with the default name based on the current date and time:
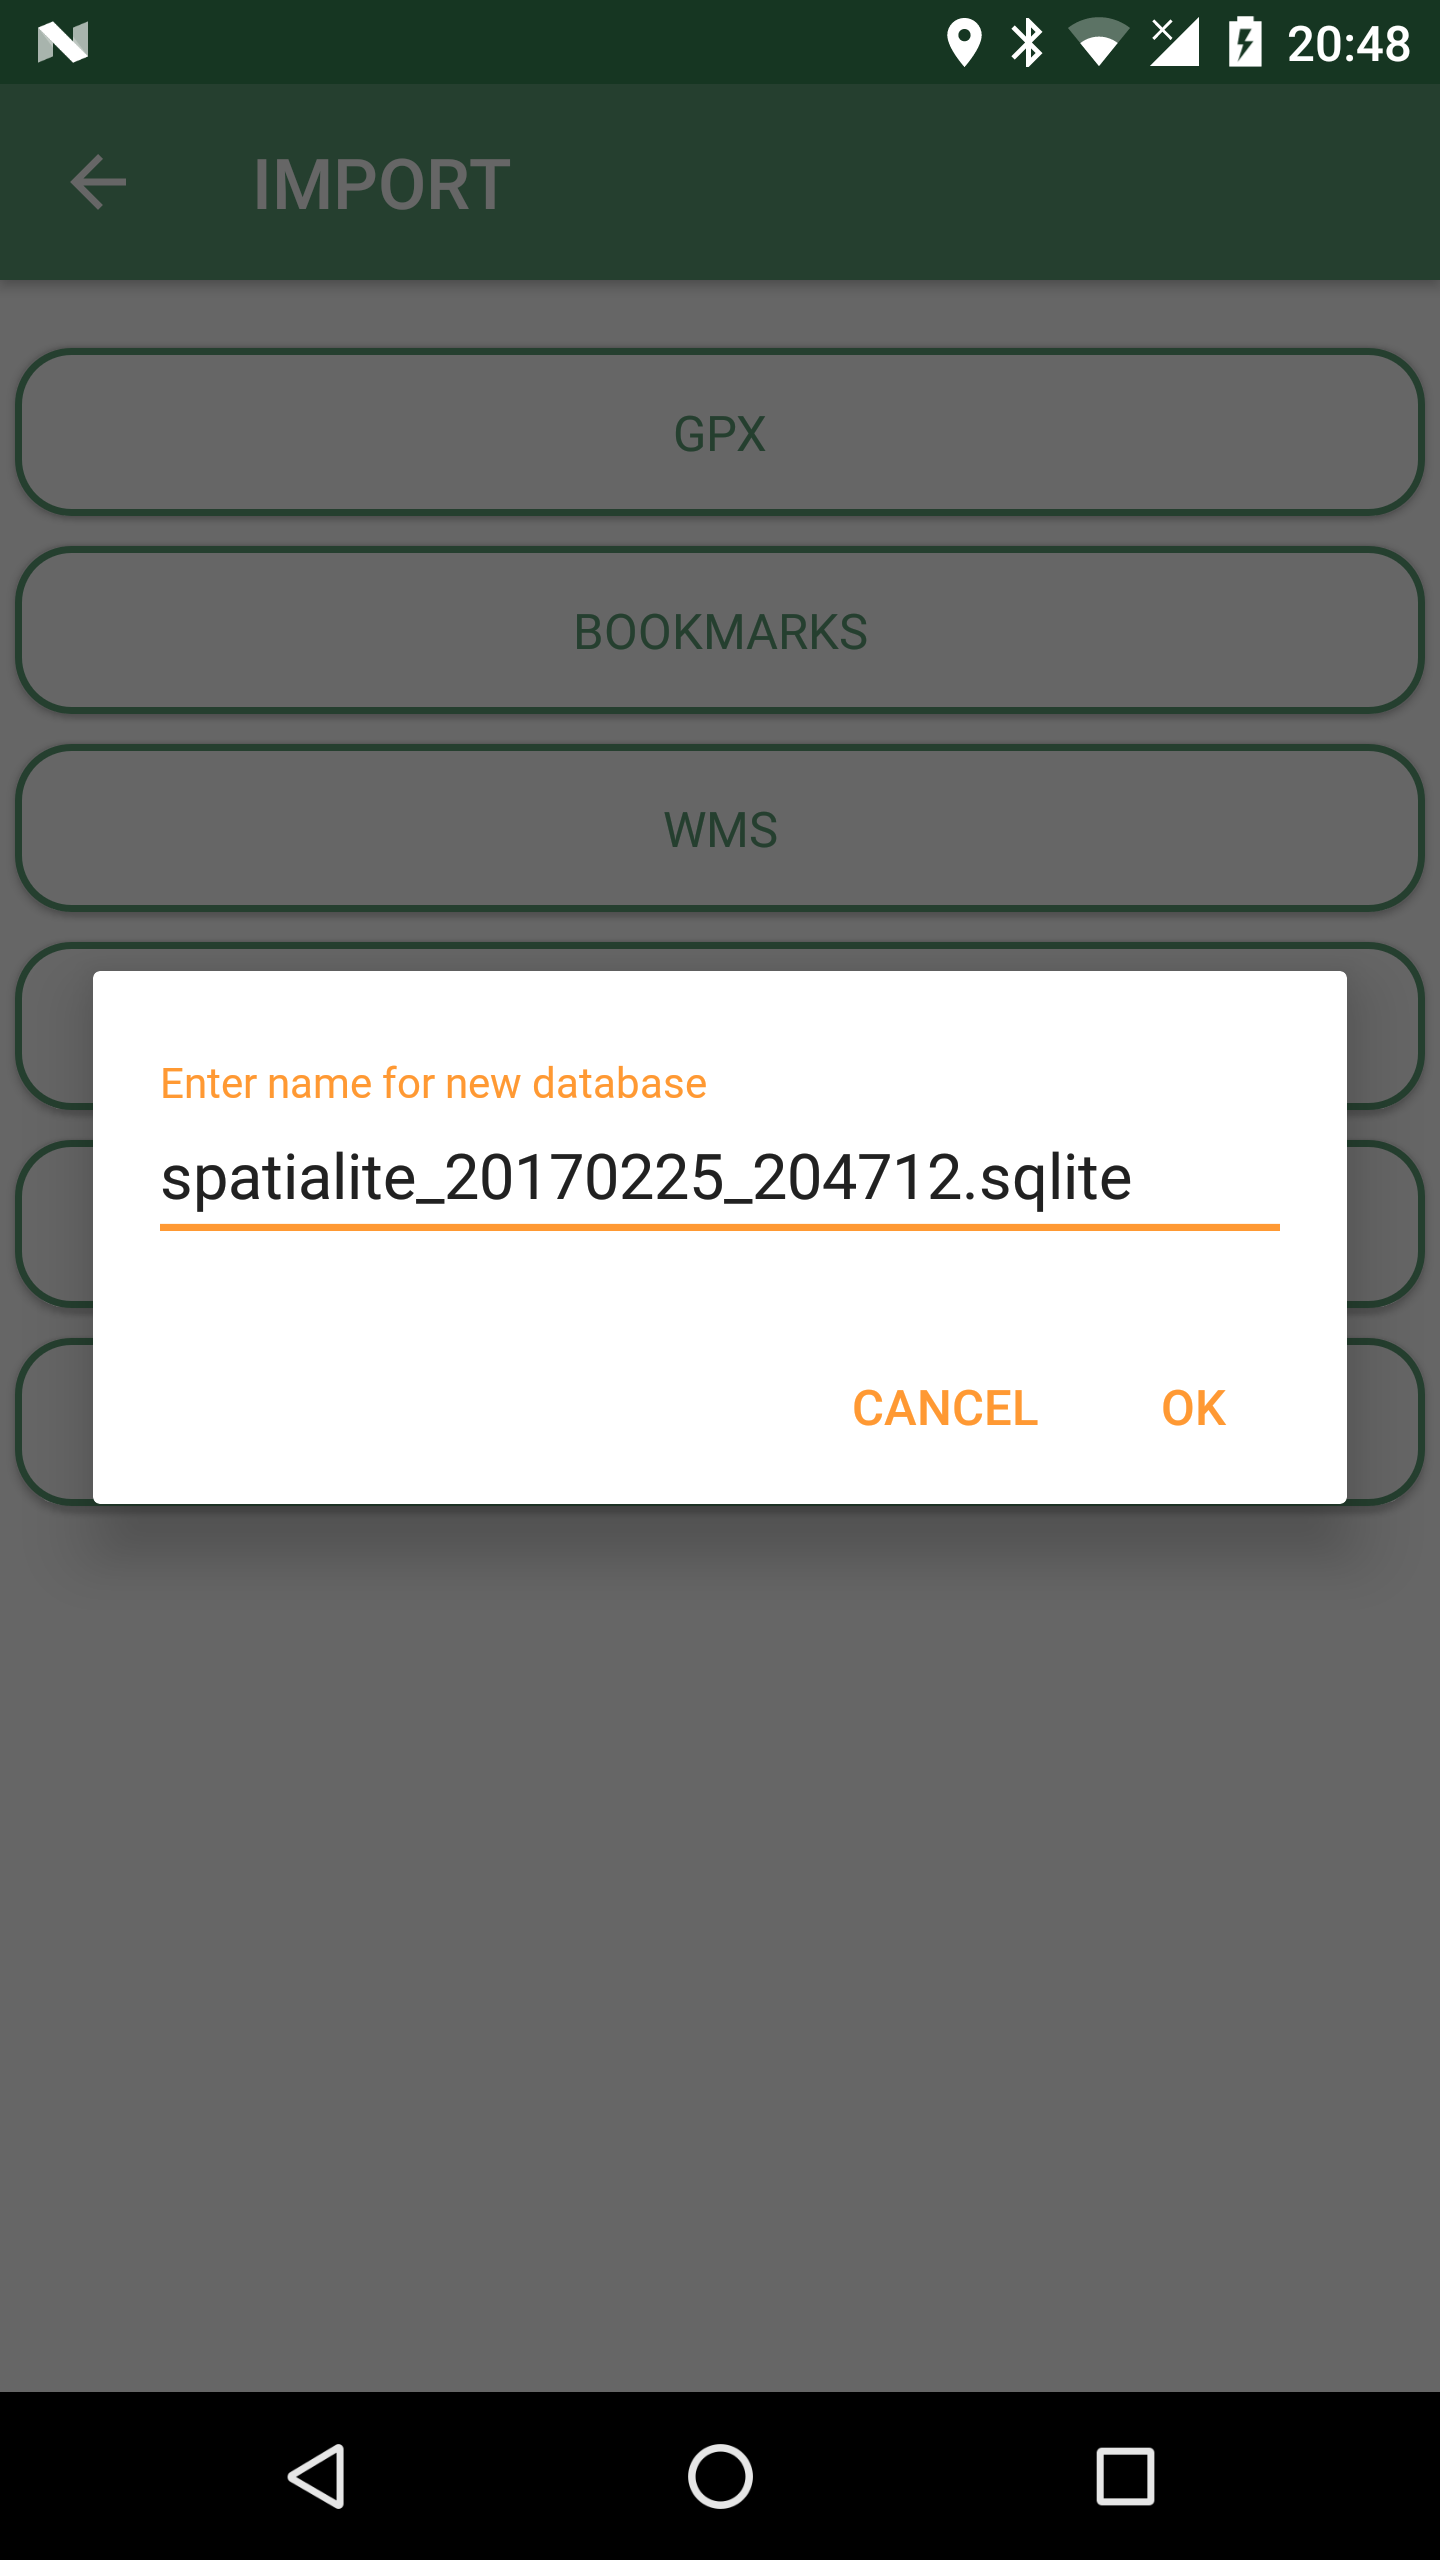
The newly created database is editing ready and contains a layer of each type geometry type (points, lines, polygon). Since it is a template db, the attributes table have been created as generic fields with names from field1 to field20. It is very generic and simple, but still of use when you have to quickly draw some spatial data with attributes and have no database prepared.
Cloud Projects
Geopaparazzi Project files can be downloaded from a Geopaparazzi Project server. To enable the import of projects from the Cloud, make sure you enter the settings in the Cloud Projects Sync Settings
Cloud Profiles
Profiles are a convenient way to group map layers, note forms, a project file, and other files. Geopaparazzi Cloud Profiles must be downloaded from a Geopaparazzi Profile server (standard local Profiles can be created on your device using the Profiles screen rom the main menu). To enable the import of Profiles from the Cloud, make sure you enter the settings in the Cloud server Settings.
Once your Cloud server Settings are set, and you press the Cloud Profiles button on the Import view, the server will send a list of Profiles available for download.
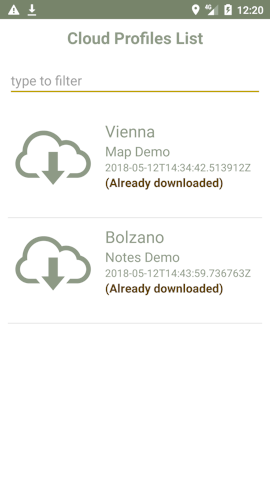

Select a Profile for download by pressing on the icon of the Profile. This will start the download of the Profile and the files associated with the Profile. The download may take some time depending on the size of the files.
When the download is completed, you can activate the Profile by using the Profile view from the Main View menu, selecting the Profile Info tab, and sliding the Activate profile switch.
3.3.6. Export
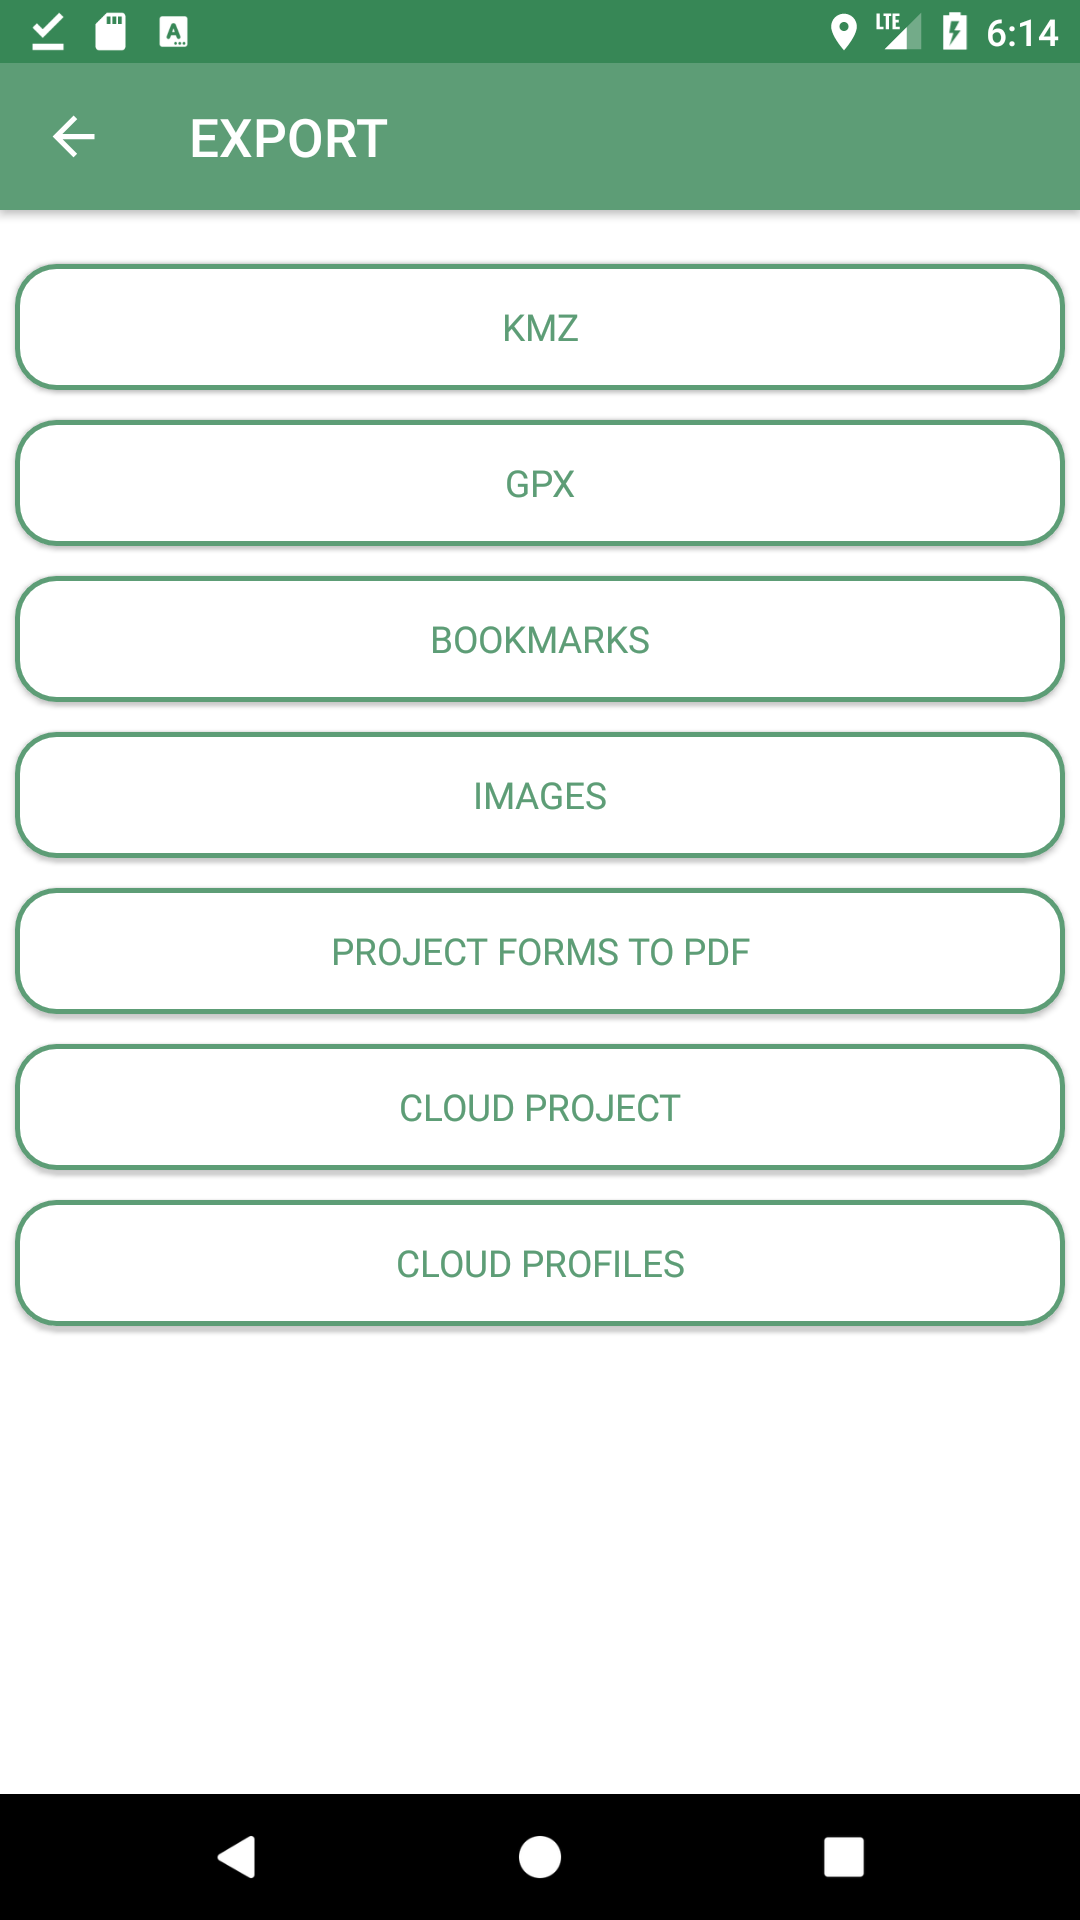
Geopaparazzi supports the export to the following formats:
-
KMZ
-
GPX
-
bookmarks
-
images
-
Project Forms to PDF
-
geopaparazzi cloud projects
-
geopaparazzi cloud profiles
KMZ
It is possible to export all collected data to KMZ format.
KMZ is well known as it can be visualized in the 3D viewer Google Earth.
In the export:
-
the notes are placed as red pins having the first letters of the text content as label
-
the images are placed as yellow pins
-
the GPS logs are visualized as tracks
GPX
The lines and notes data are exported to GPX, creating tracks and waypoints.
Bookmarks
Bookmarks can be exported to a csv file that has to be called bookmarks.csv and are placed in the root of the sdcard.
Geopaparazzi will write to the file only those bookmarks that do not exist already in the csv.
Images
Since images are kept inside the database, this export is handy if the user needs to use the images inside a different software. In this case all the images of the project are exported inside a folder and a popup message shows the folder path.
Project Forms to PDF
You can export your notes to a simple PDF document. After pressing the "Project Forms to PDF" button you can select which notes you would like to include in the PDF file. The PDF file created will be a the root of the device’s file system and named "geopaparazzi_projectexport_" with a timestamp and a .pdf extension in the file name.
Cloud Projects
Geopaparazzi Project files can be uploaded to a Geopaparazzi Project server. To enable the upload of projects to the Cloud, make sure you enter the settings in the Cloud Projects Sync Settings.
Cloud Profiles
Geopaparazzi Profile files (project and spatialite files) can be uploaded to a Geopaparazzi Profile server. To enable the upload of profiles to the Cloud, make sure you enter the settings in the Cloud Projects Sync Settings.
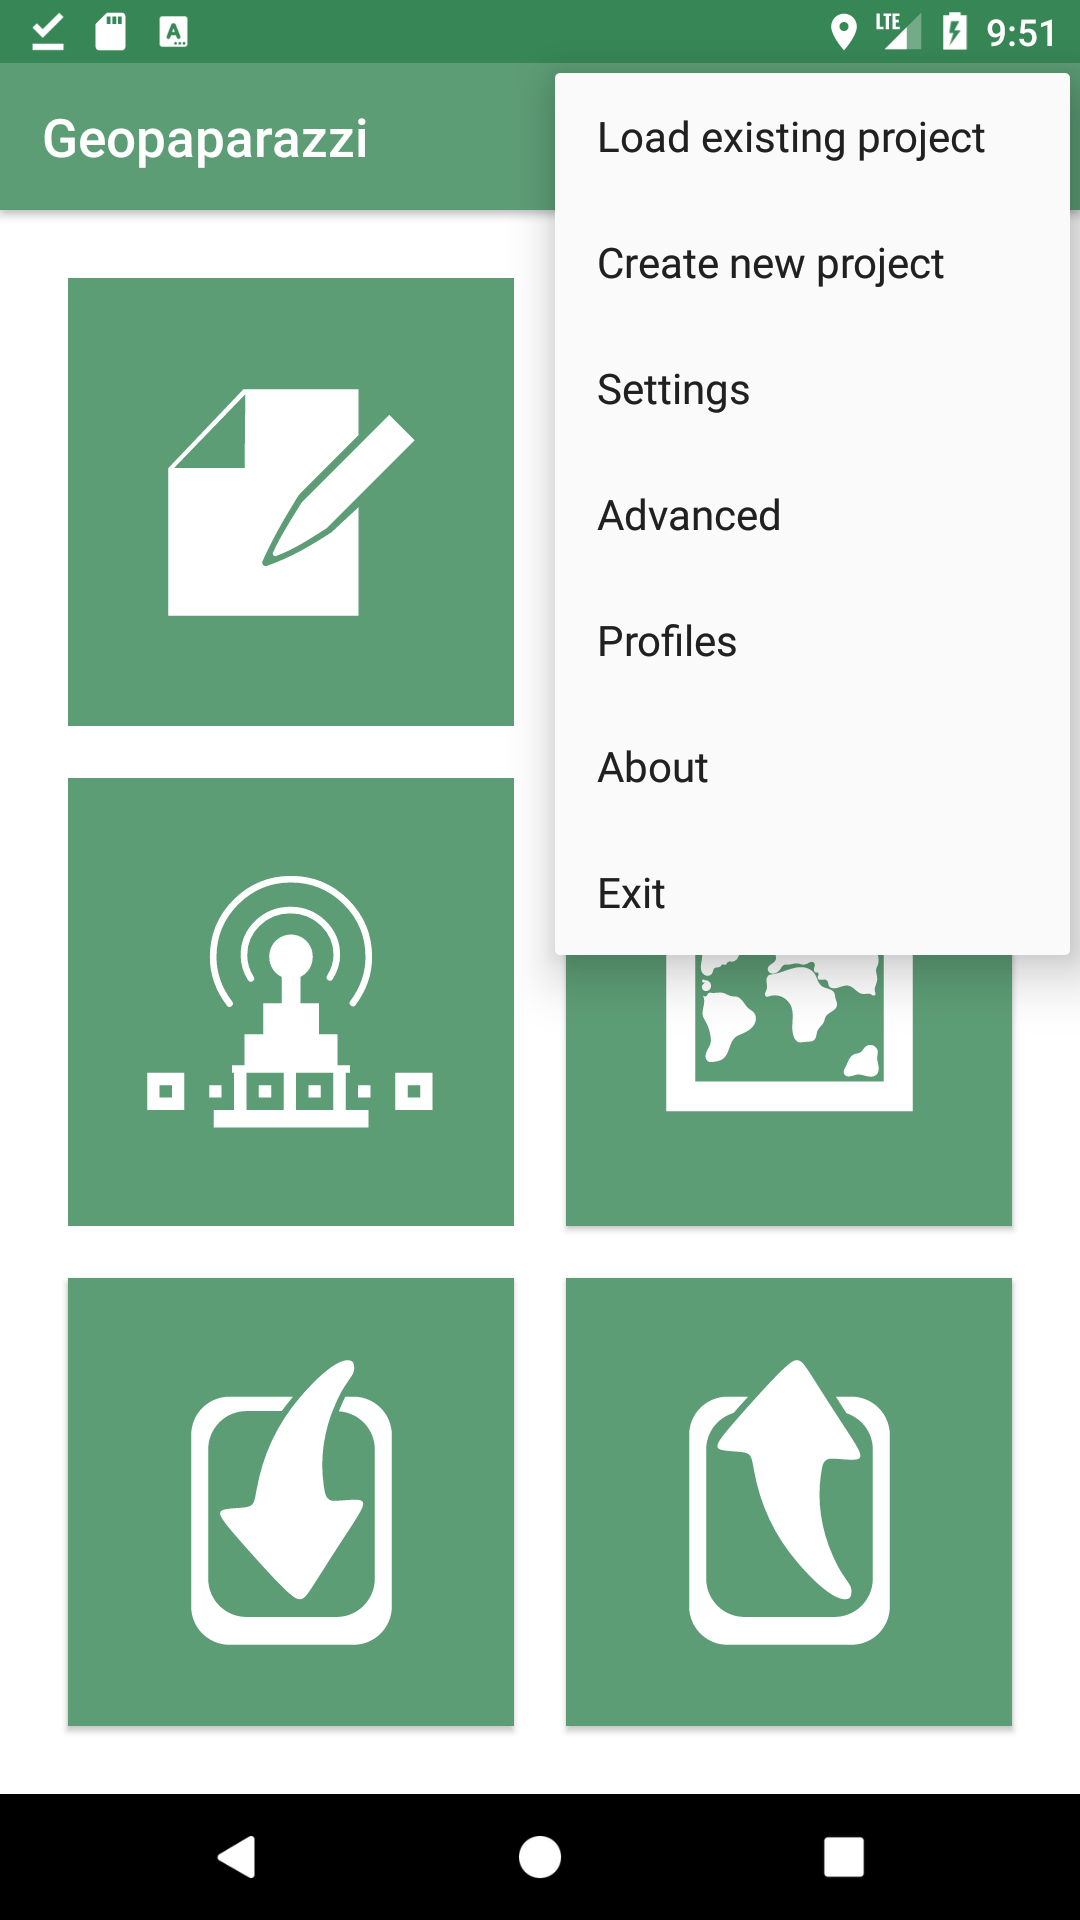
4. The Main View Menu
The main view menu presents the following options:
-
Load existing project: allows the browsing of the filesystem to select an existing Geopaparazzi project file to load it
-
Create new project: creates a new project on the sdcard. A timestamp based name is created by default but you can change it
-
Settings: shows the list of settings you can change
-
Advanced: shows some advanced user options such as the application log or custom database queries
-
Profiles: allow creation and editing of Profiles.
-
About: shows the about page, which contains info, links and acknowledgments
-
Exit: shuts down Geopaparazzi properly. If you use the Android home button to exit, it will continue to work in background, draining the battery through GPS use.
4.1. Load an existing project
An existing project can be loaded using a simple file browser from within Geopaparazzi. The Geopaparazzi project files are shown with an icon to help the user to choose the proper file.
4.2. Create a new project
When a new project is created, you are prompted to give a file name for the new project file. This is the name that will be given to the database file that contains all data collected in Geopaparazzi.
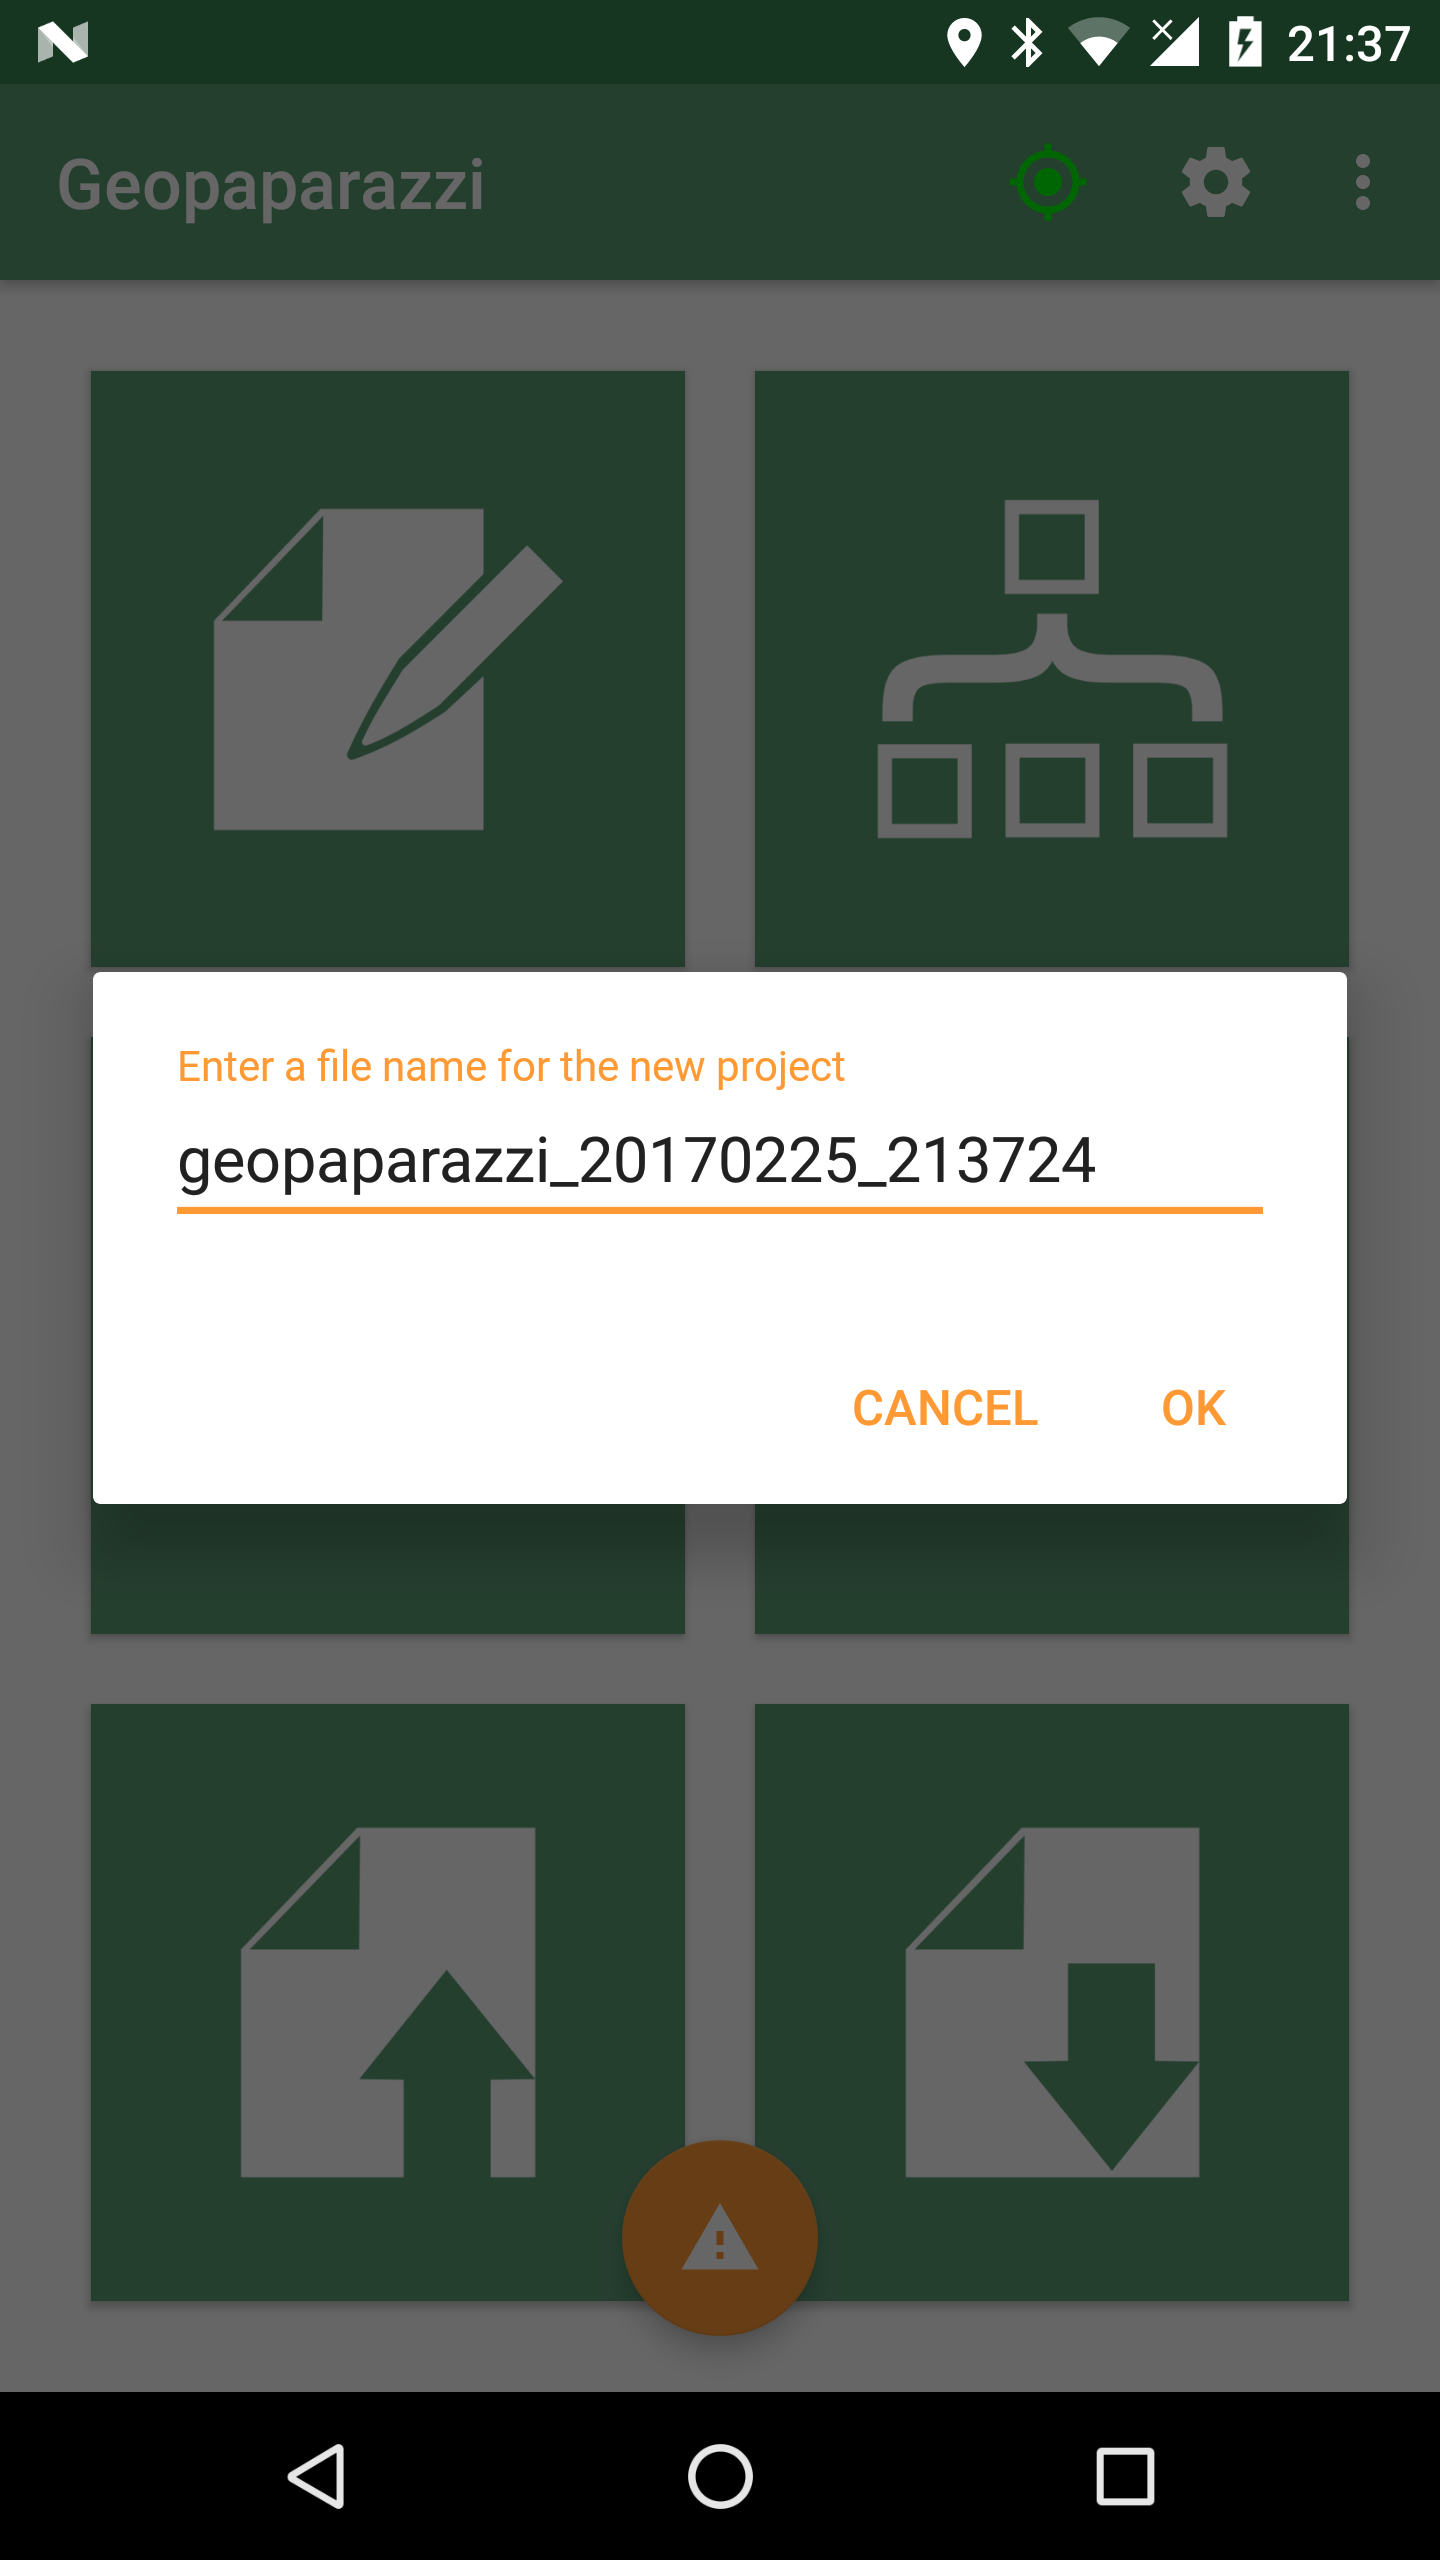
Once the name is defined, an new empty database is created and Geopaparazzi is restarted and opened loading the new created project.
4.5. Profiles
Profiles enable you to configure the Geopaparazzi environment by grouping specific basemaps, overlays, a notes form, and a project file into a Profile. You can configure many different profiles and easily switch between them in Geopaparazzi.
4.5.1. Creating a Profile
To create a new profile simply push the orange button on the lower right of the view.

Once pushed, the main profile info dialog will pop-up. There you can insert a profile name and some description about the profile:
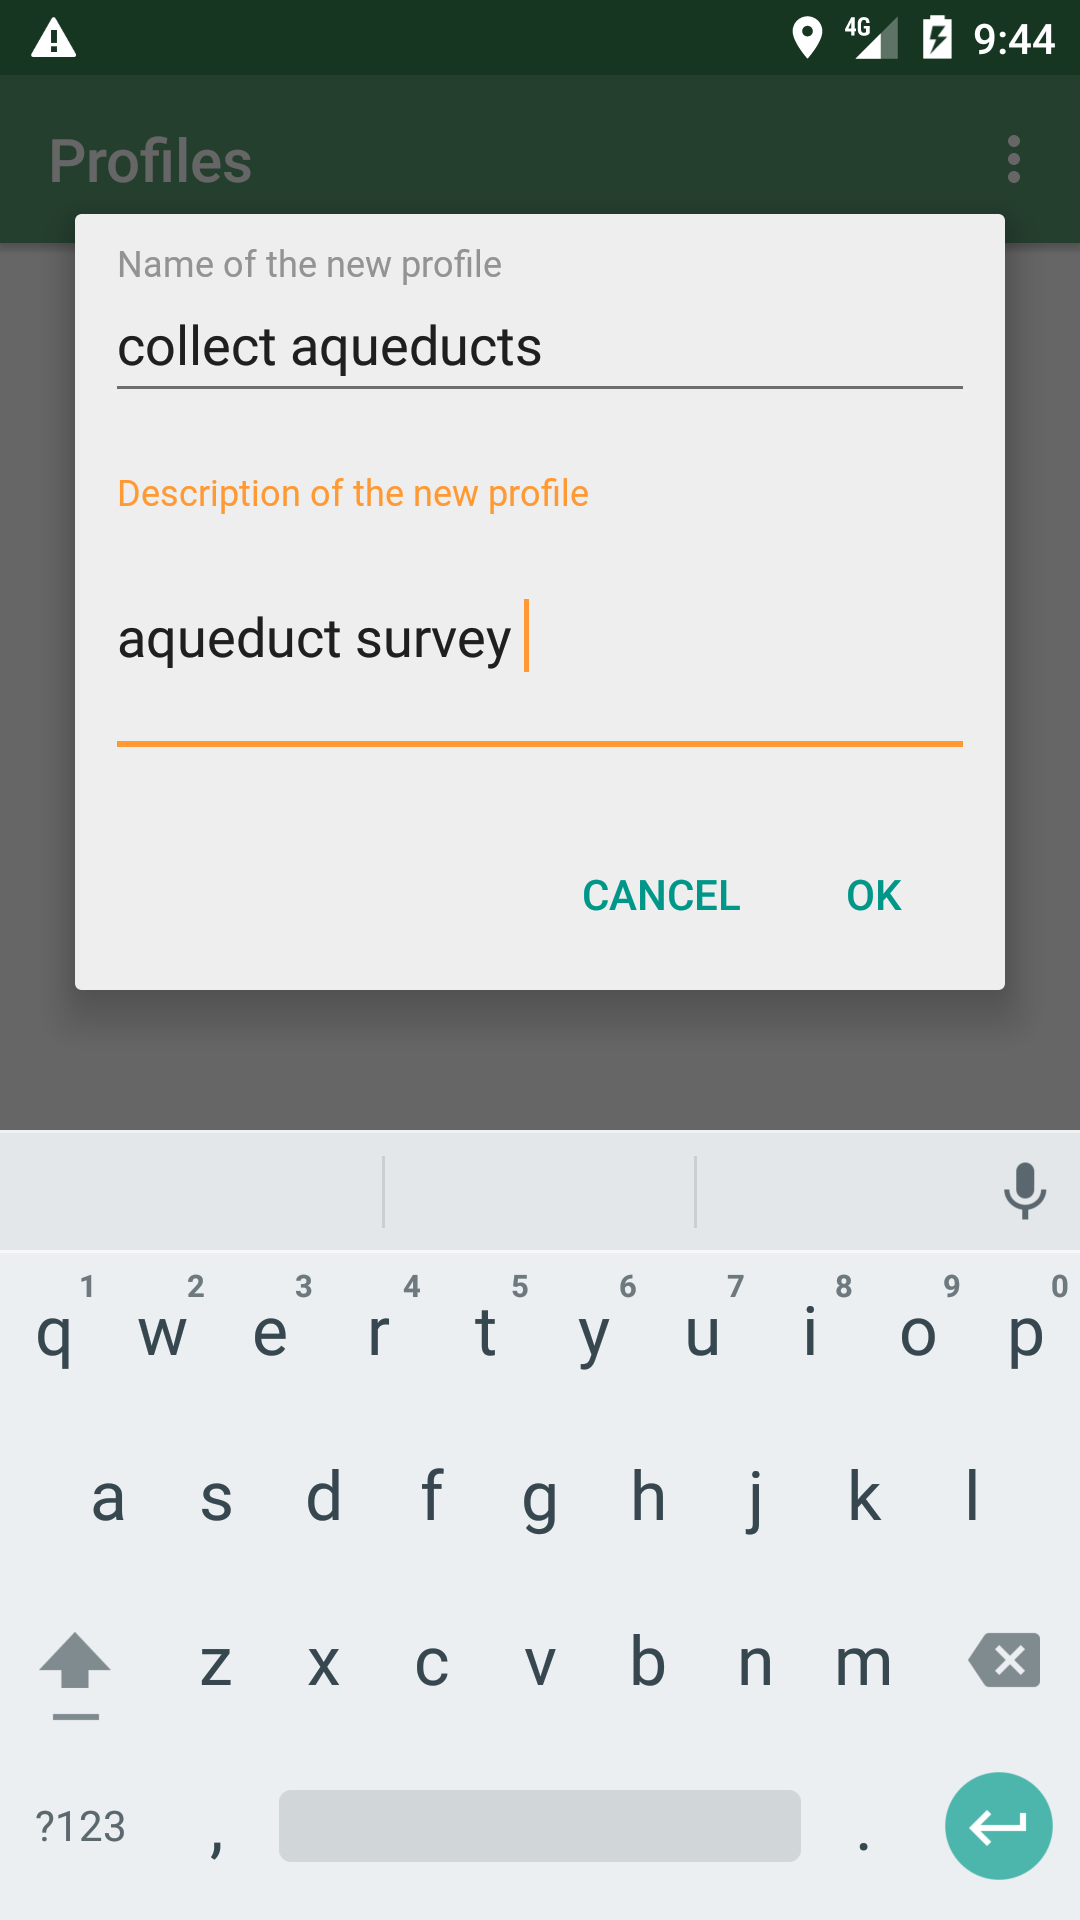
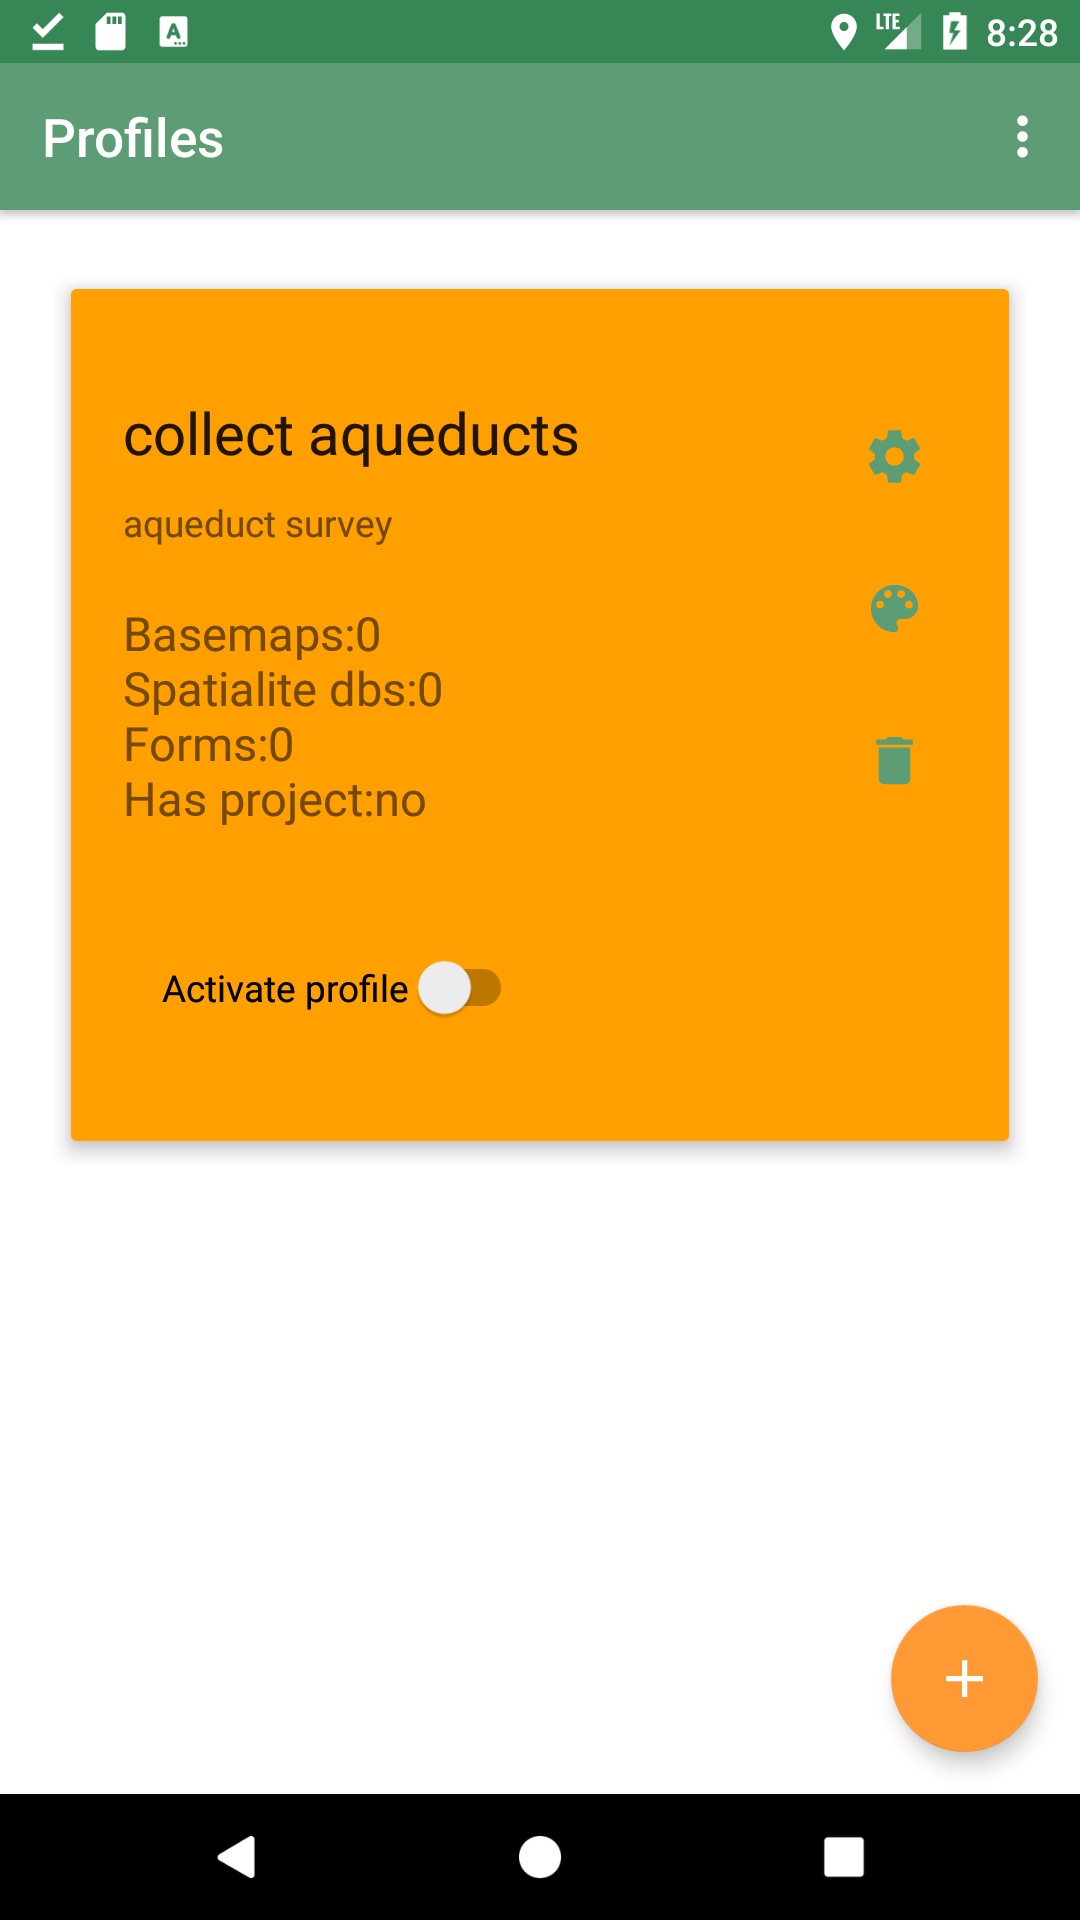
Once OK is pressed, an empty profile is created:
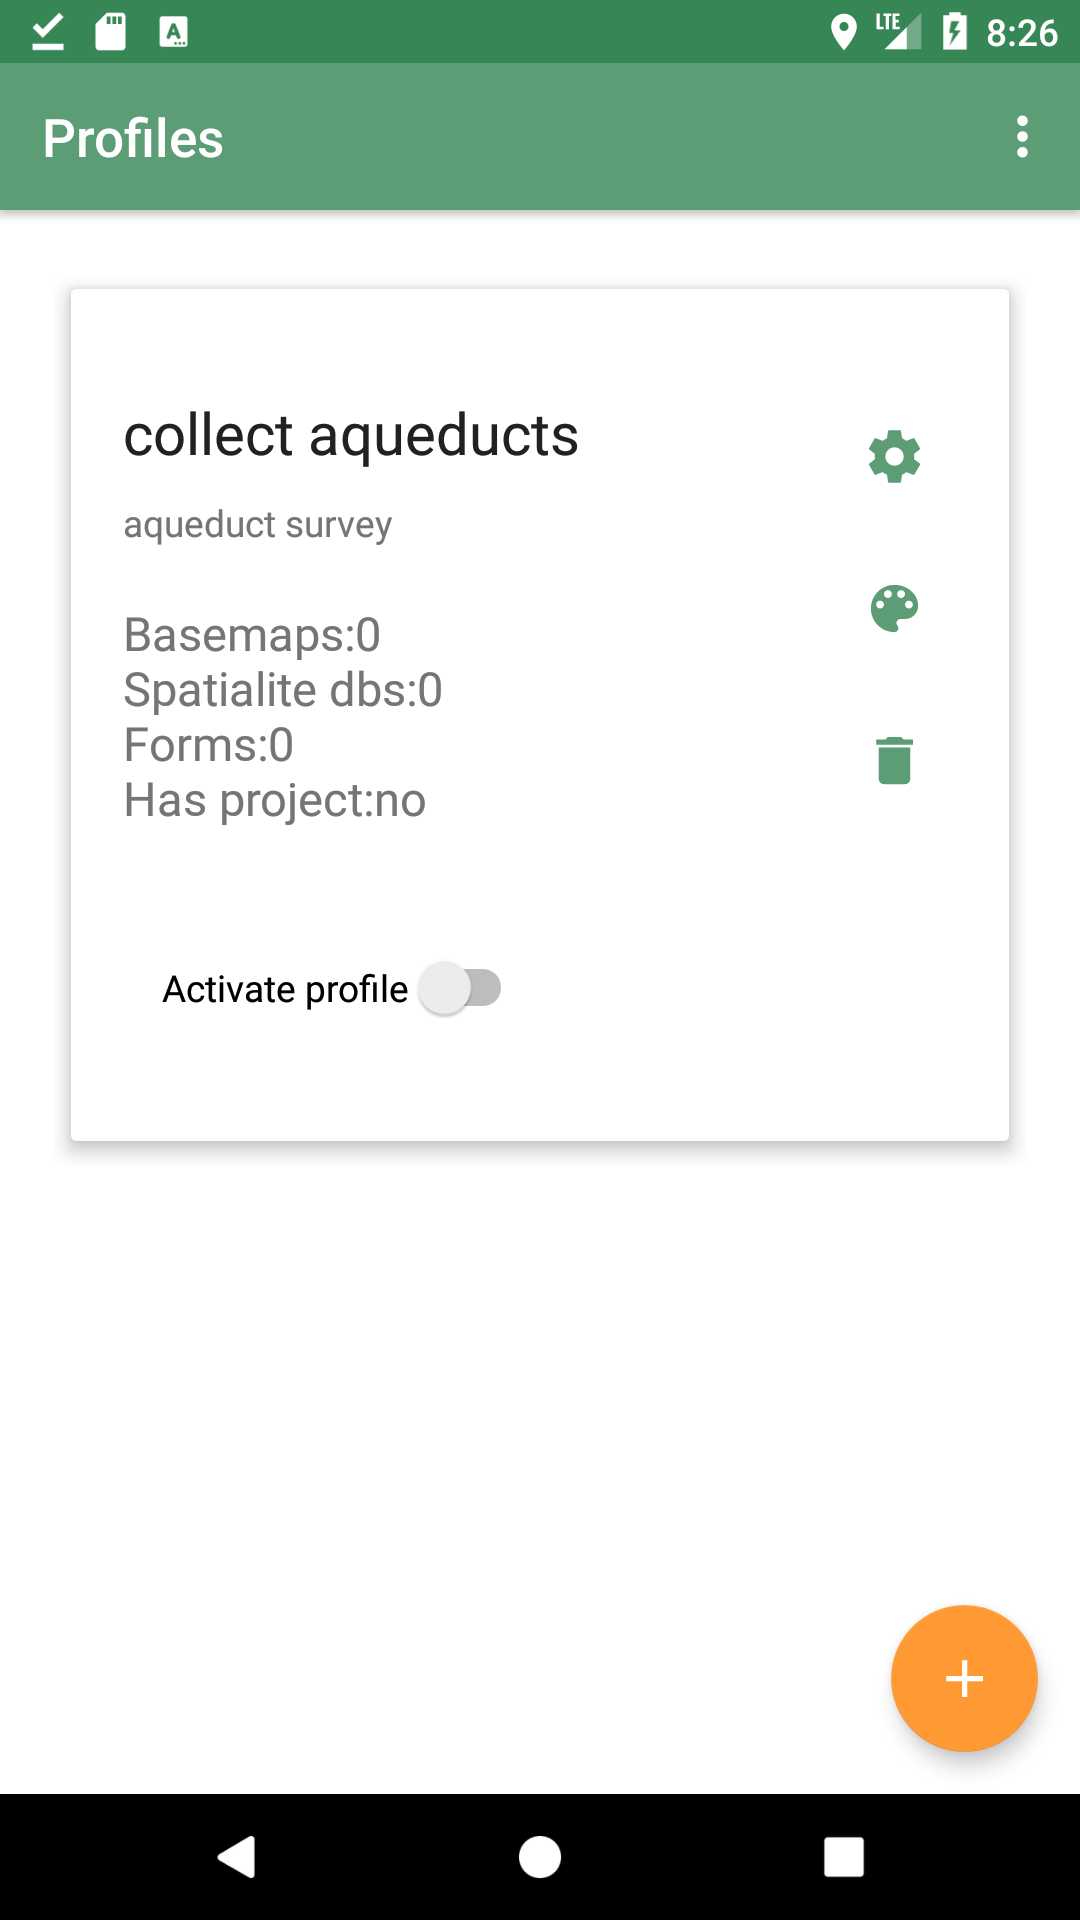
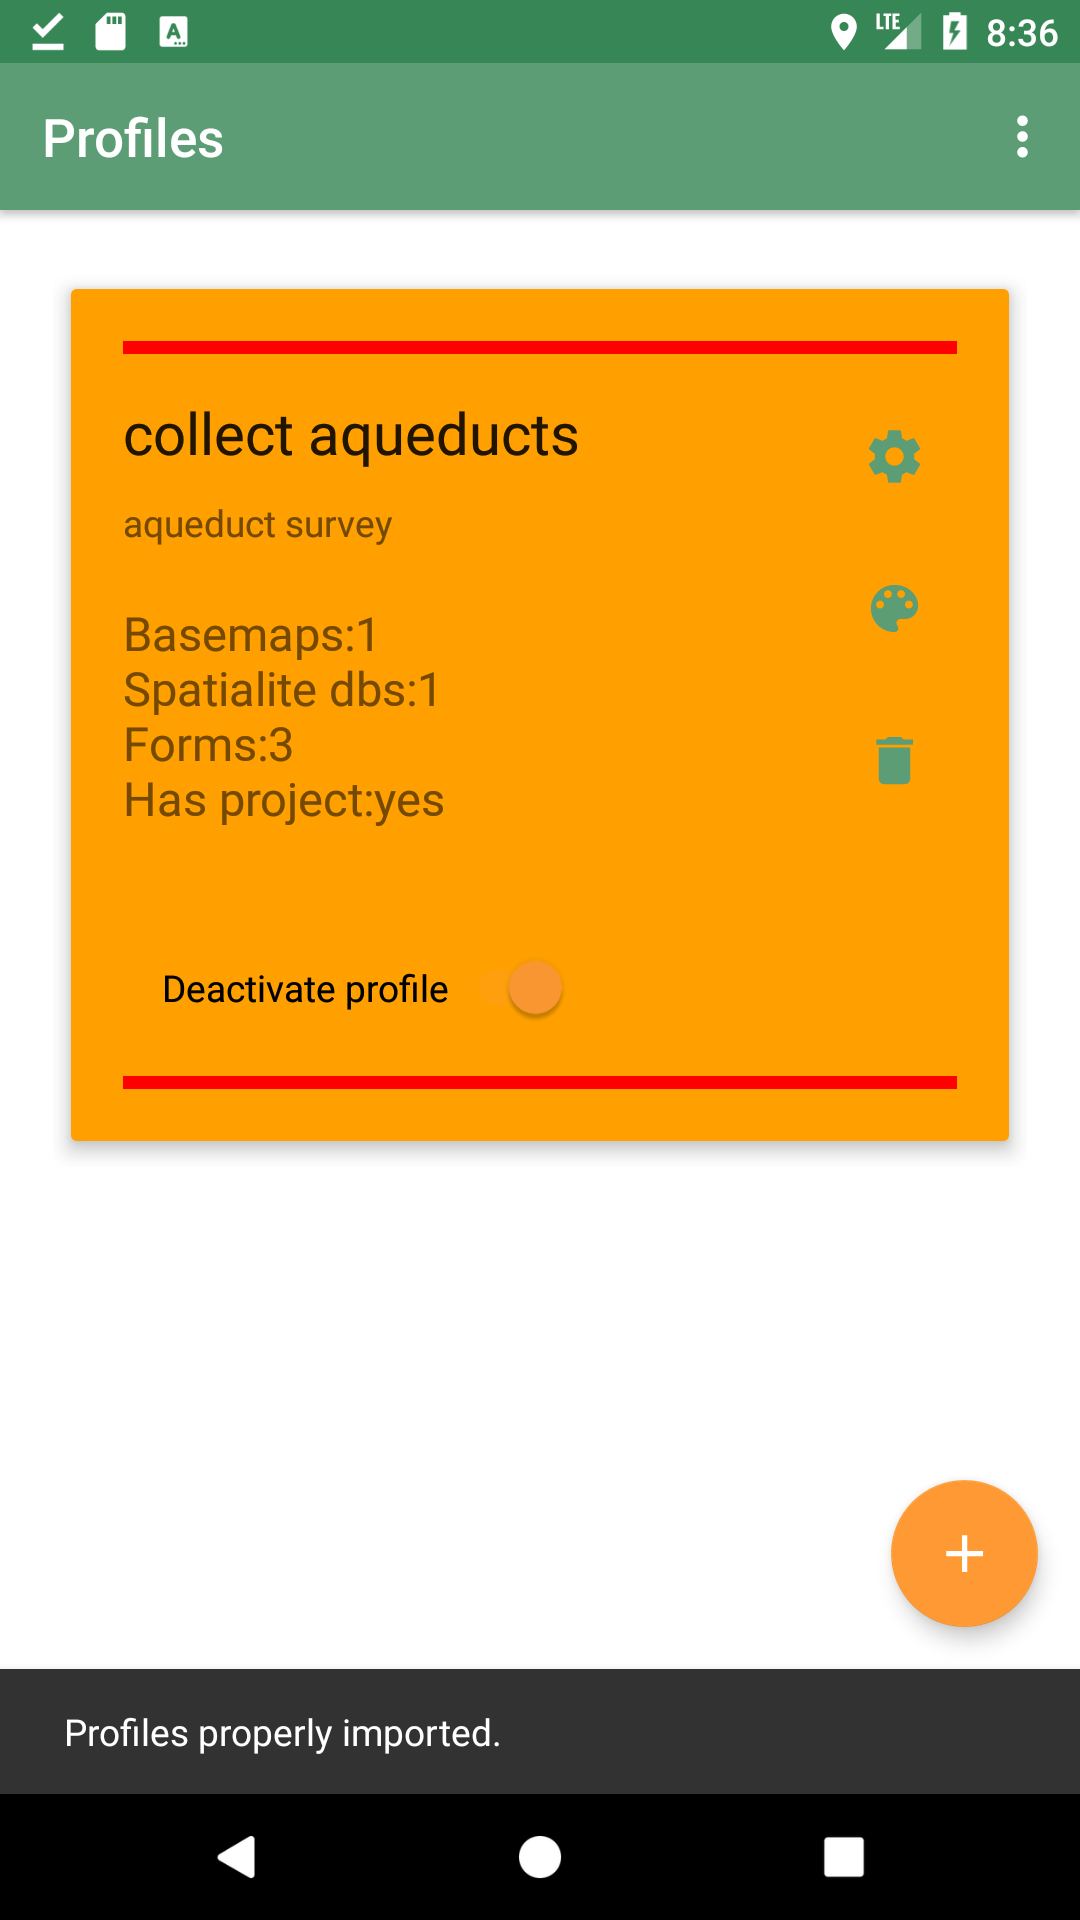
The profile list gives information about its content, listing the number of basemaps, spatialite database overlays, Note forms, and project file.
From this view it is also possible to activate the profile through the switch at the bottom of the view. Activating the Profile means the various files will be automatically attached to Geopaparazzi. Since only one Profile can be active at a time, the activation of a Profile automatically disables the previously active Profile, if there had been one.
Once a Profile is active, in the Profiles view it is marked with two red lines in the top and bottom part of the Profile’s card:
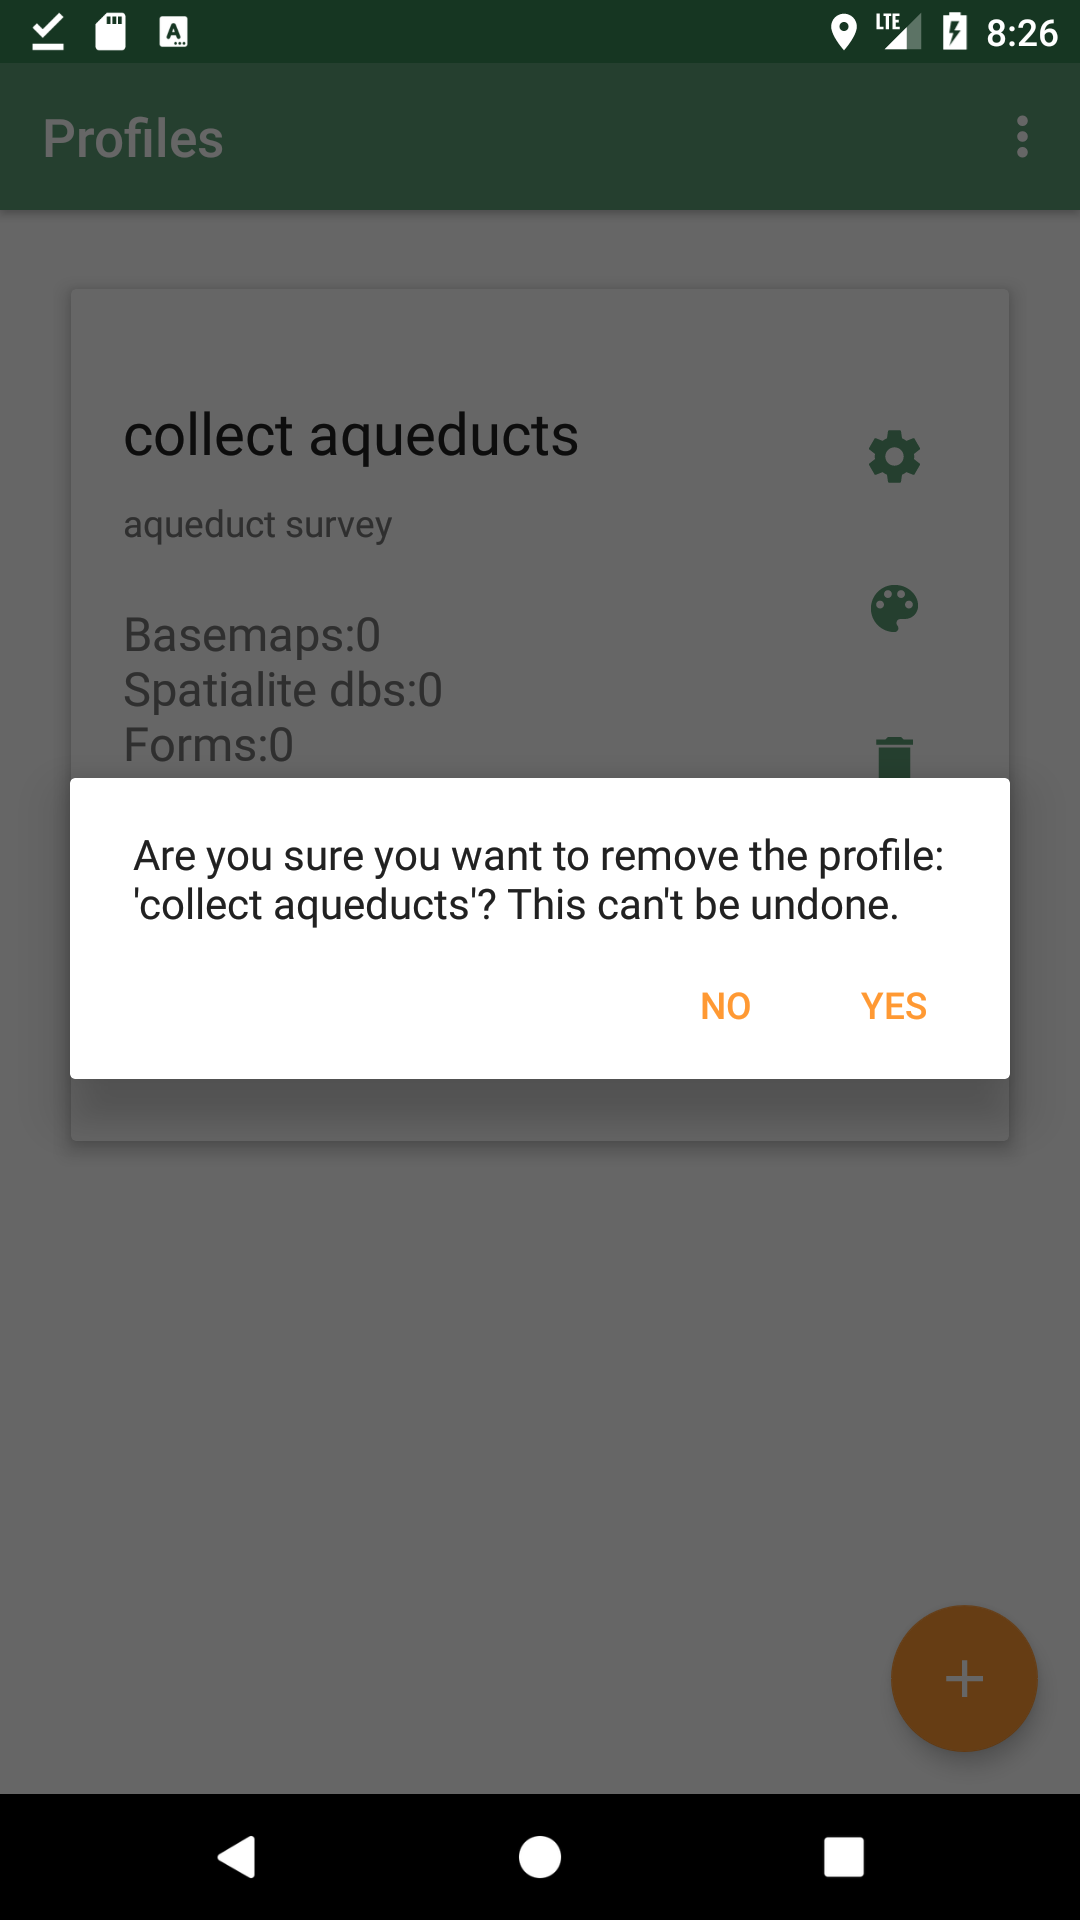
4.5.2. Deleting a Profile
Pressing the Profile’s Trashcan icon will delete the Profile. You will be prompted to make sure the Profile is not deleted by error:
4.5.3. Styling a Profile
It is possible to apply a color to the Profile cardview. Setting a color uniquely identifies a Profile while running Geopaparazzi. If a Profile has aproject attached, you will know a particular Profile is active because it uses the color to set the background color in the Main View.
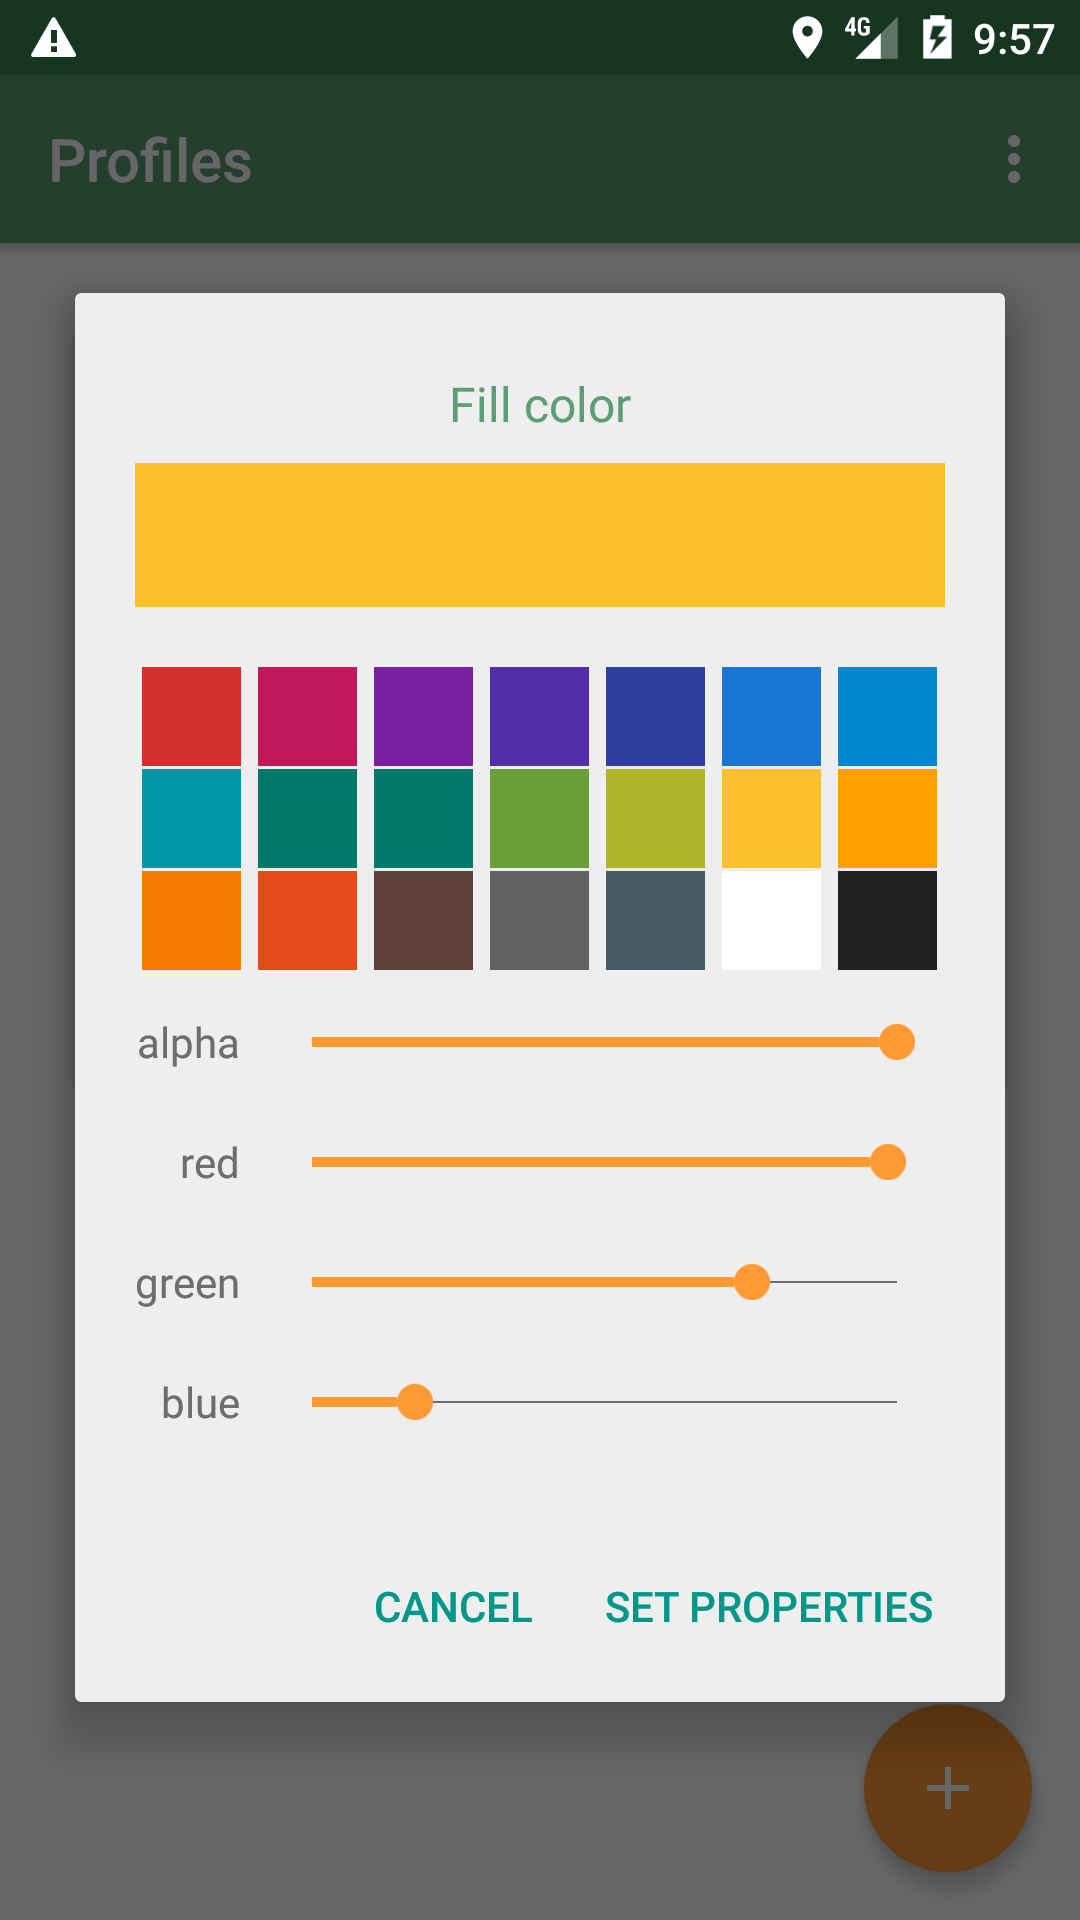
Once you press "Set Properties", the profile list will appear with the new profile entry colored with the color you selected:
4.5.4. Adding data to a Profile
To add data to a profile, press the settings icon (gear-like icon in the upper right of the profile’s cardview).

The view the opens is divided in different tabs, namely:
-
PROFILE INFO
-
BASEMAPS
-
SPATIALITE DATABASES
-
FORMS
-
PROJECT
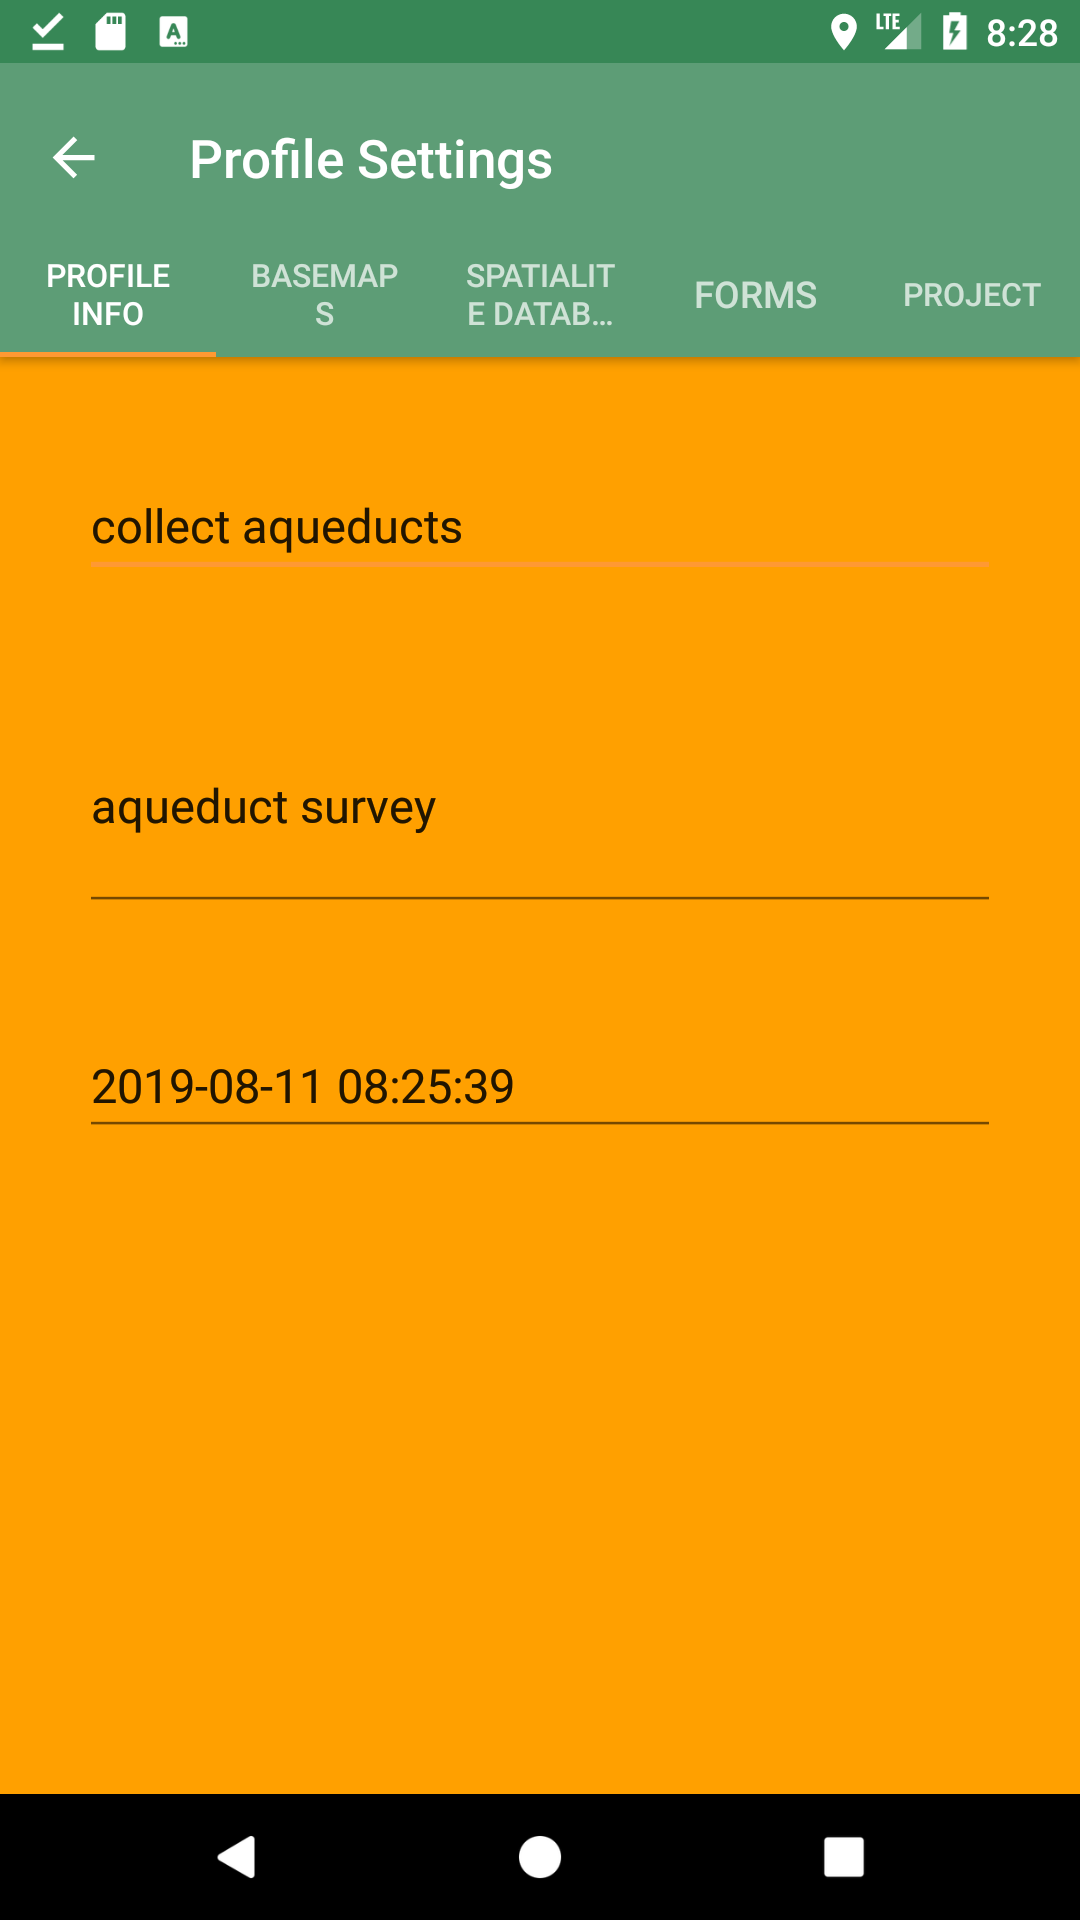
Profile Info
The Profile Info tab shows the main information about the Profile:
-
Profile Name
-
Profile Description
-
Creation Date
-
Activate Profile
Name and description can be modified from this view, while the creation date is read-only.
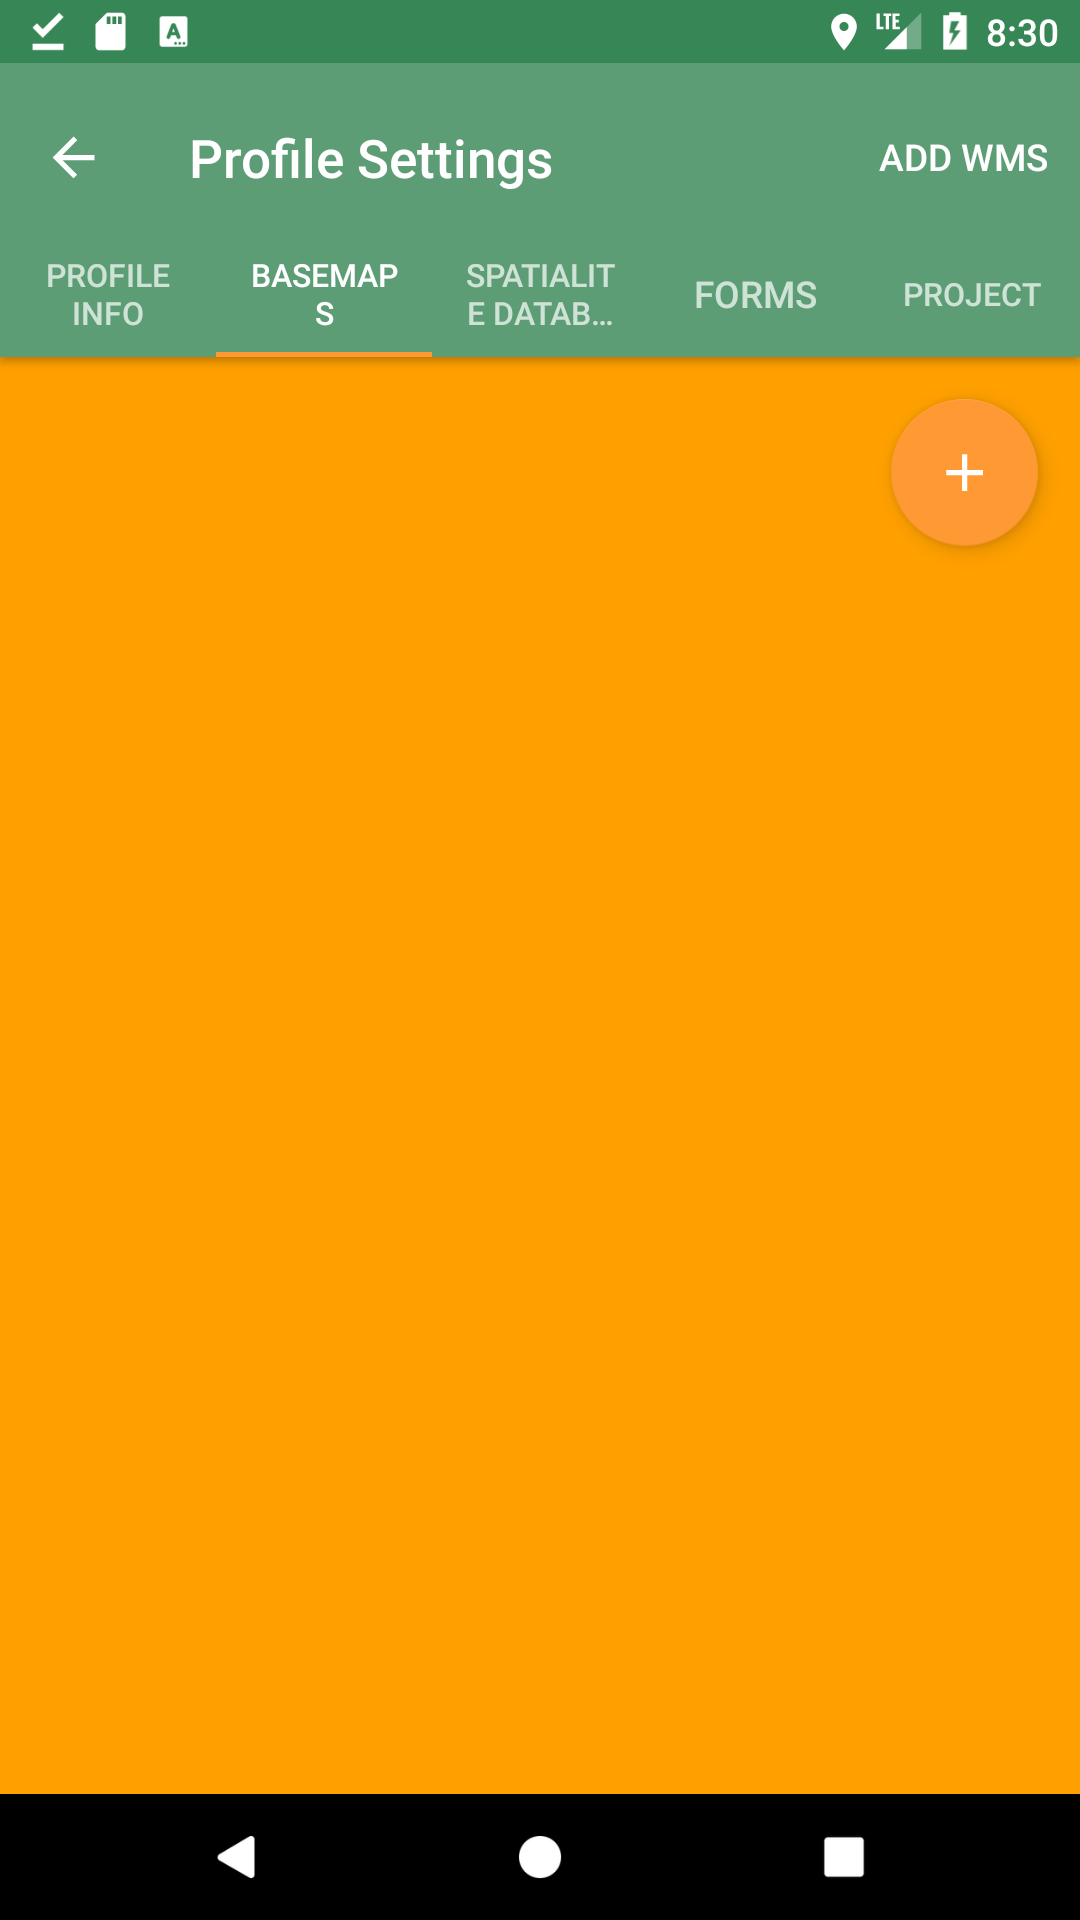
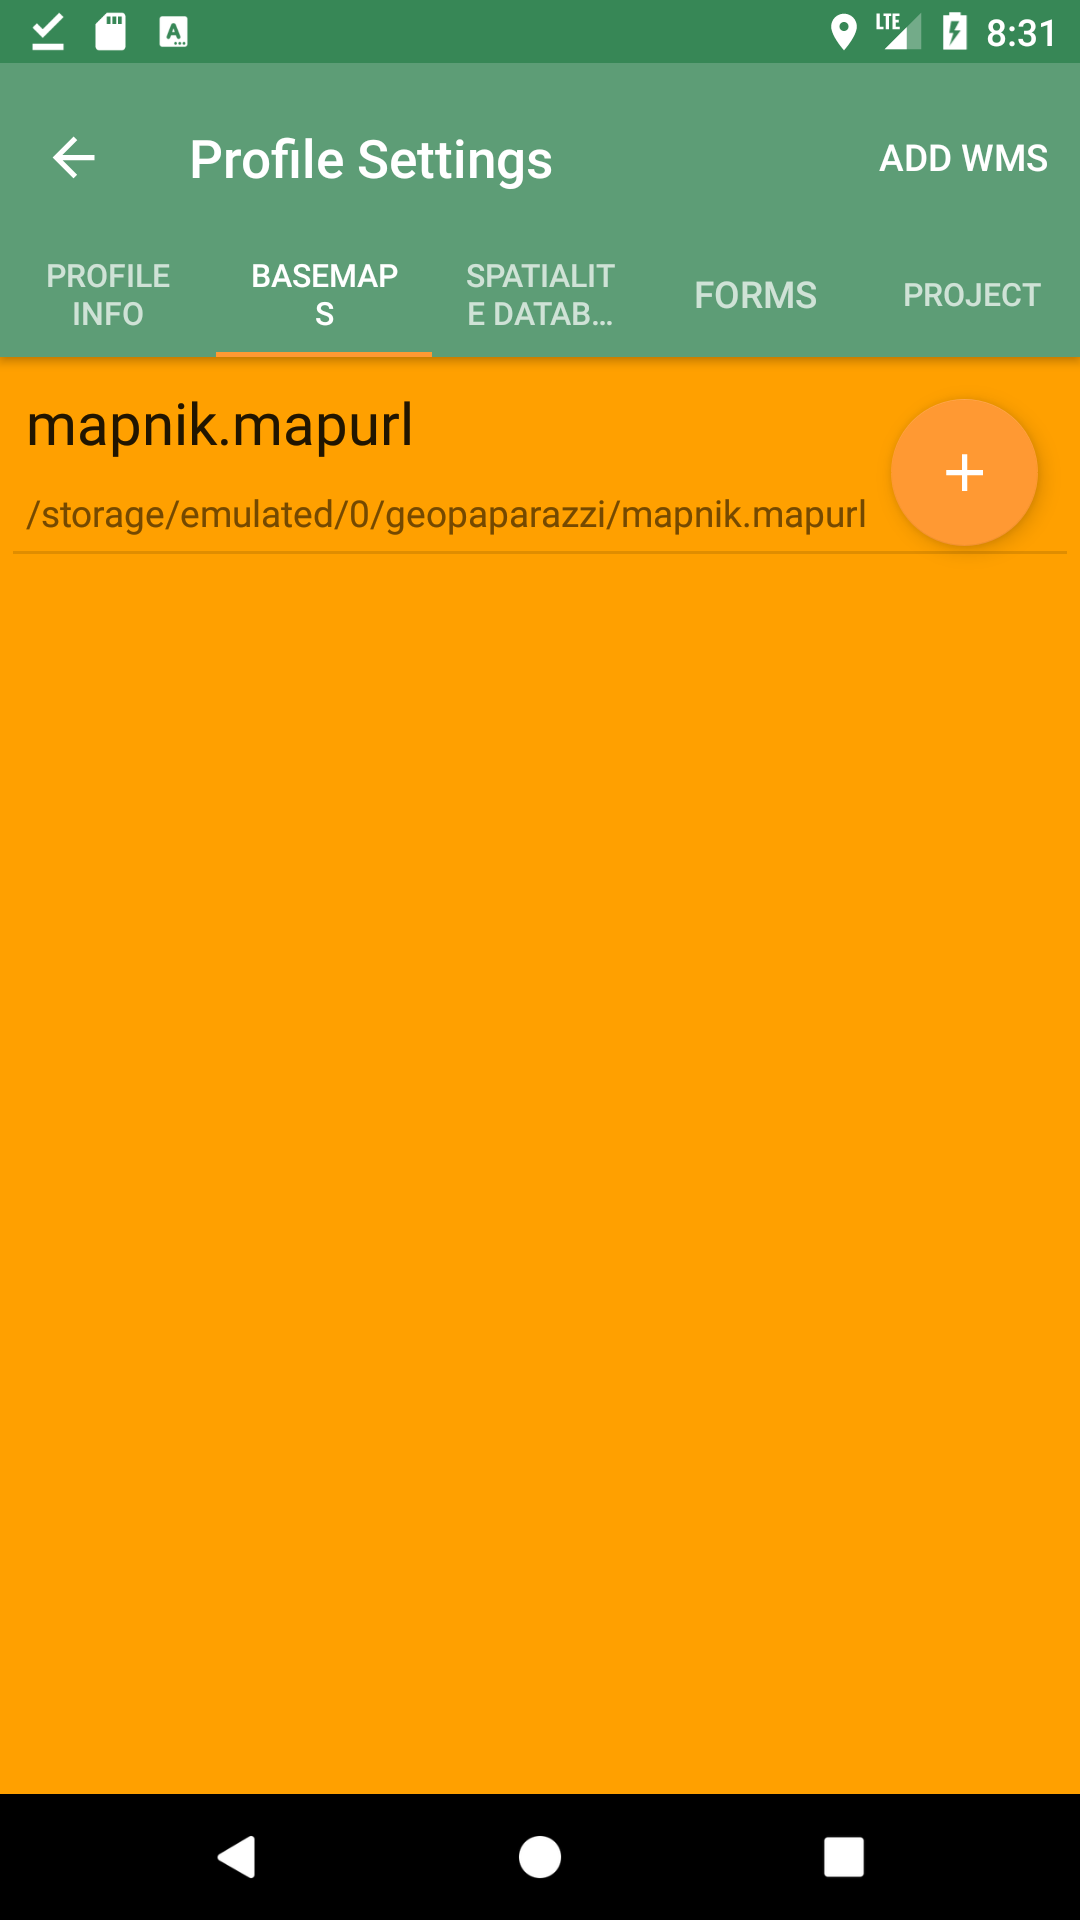
Basemaps
The Basemaps tab allows you to add background basemaps to the Profile configuration. Currently supported extensions are:
-
.map: mapsforge maps
-
.mbtile
-
.sqlite: sqlite databases containing rasterlite2 data
-
.mapurl: mapurl files that can contain configurations for local or on-line (TMS or Google) mapping services.
Press the orange plus button on the top right part of the view to browse the device’s filesystem and select the basemap files to add.
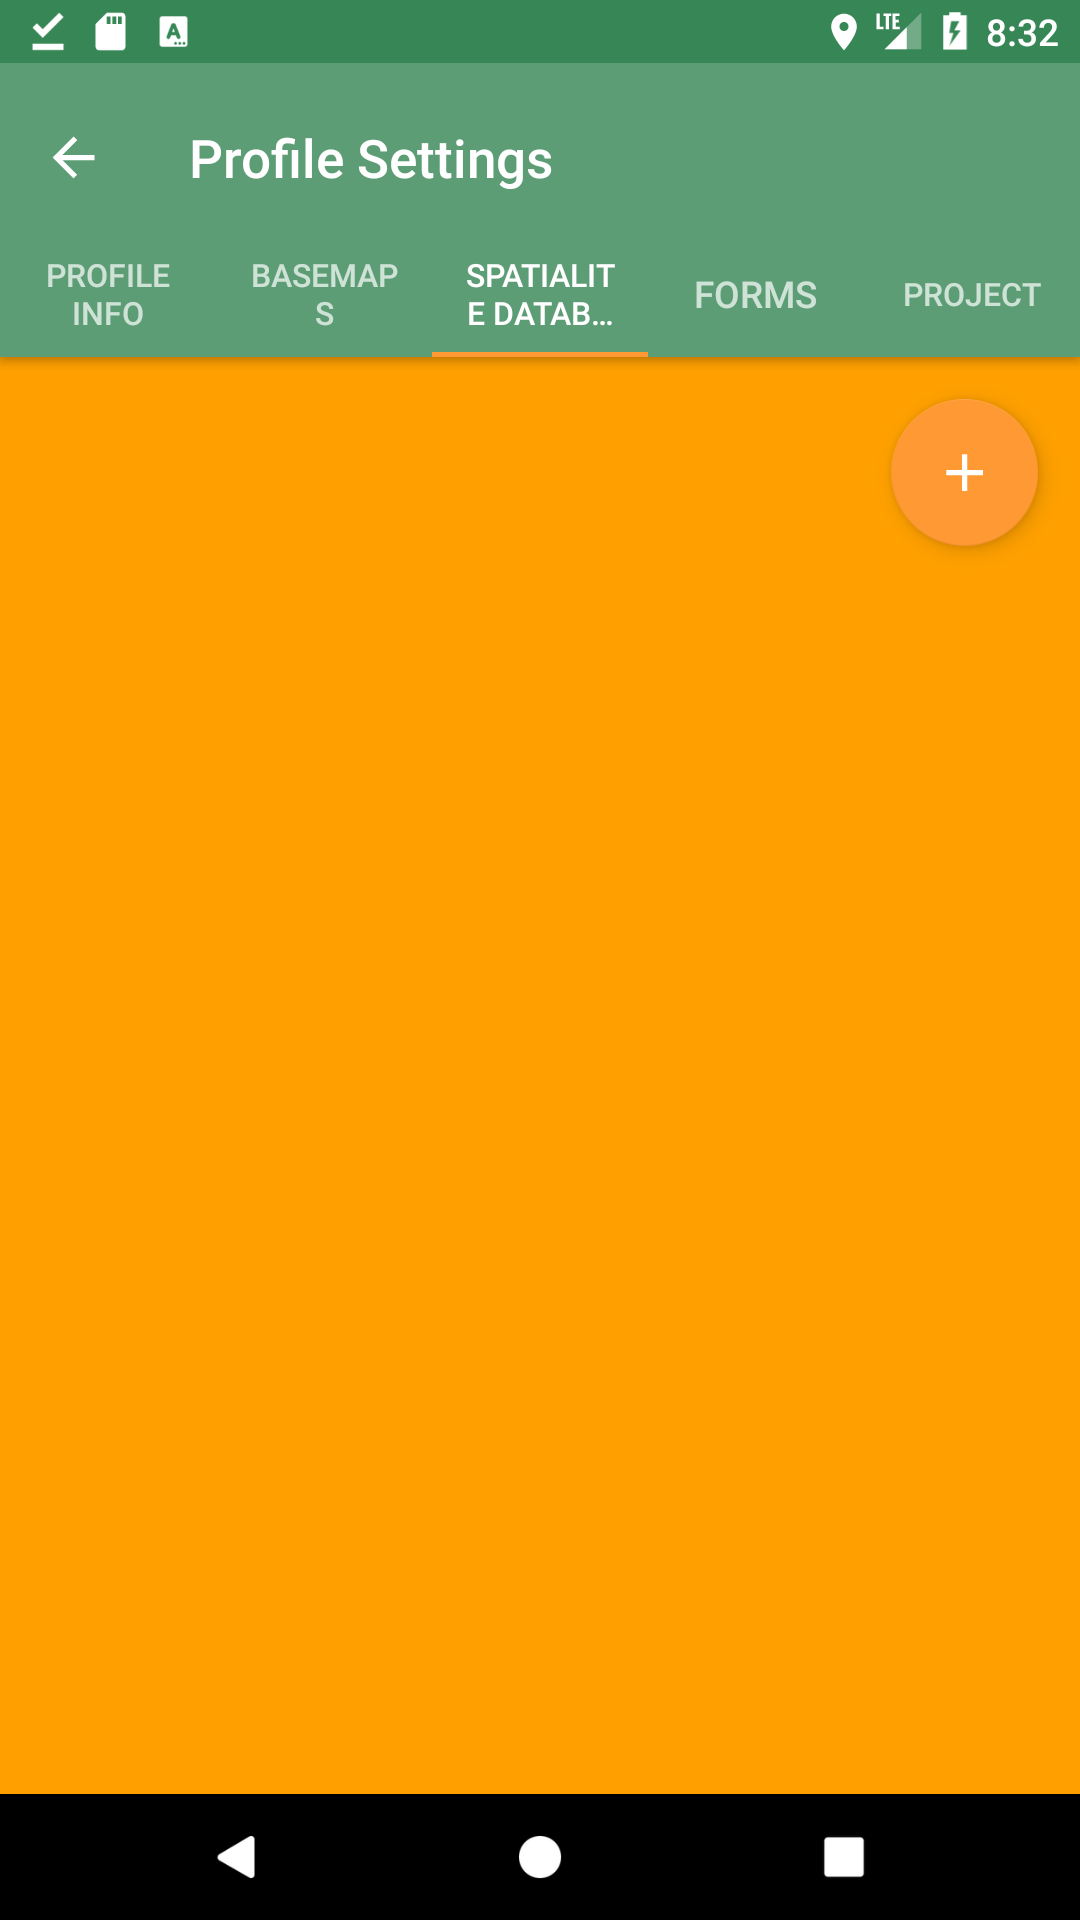
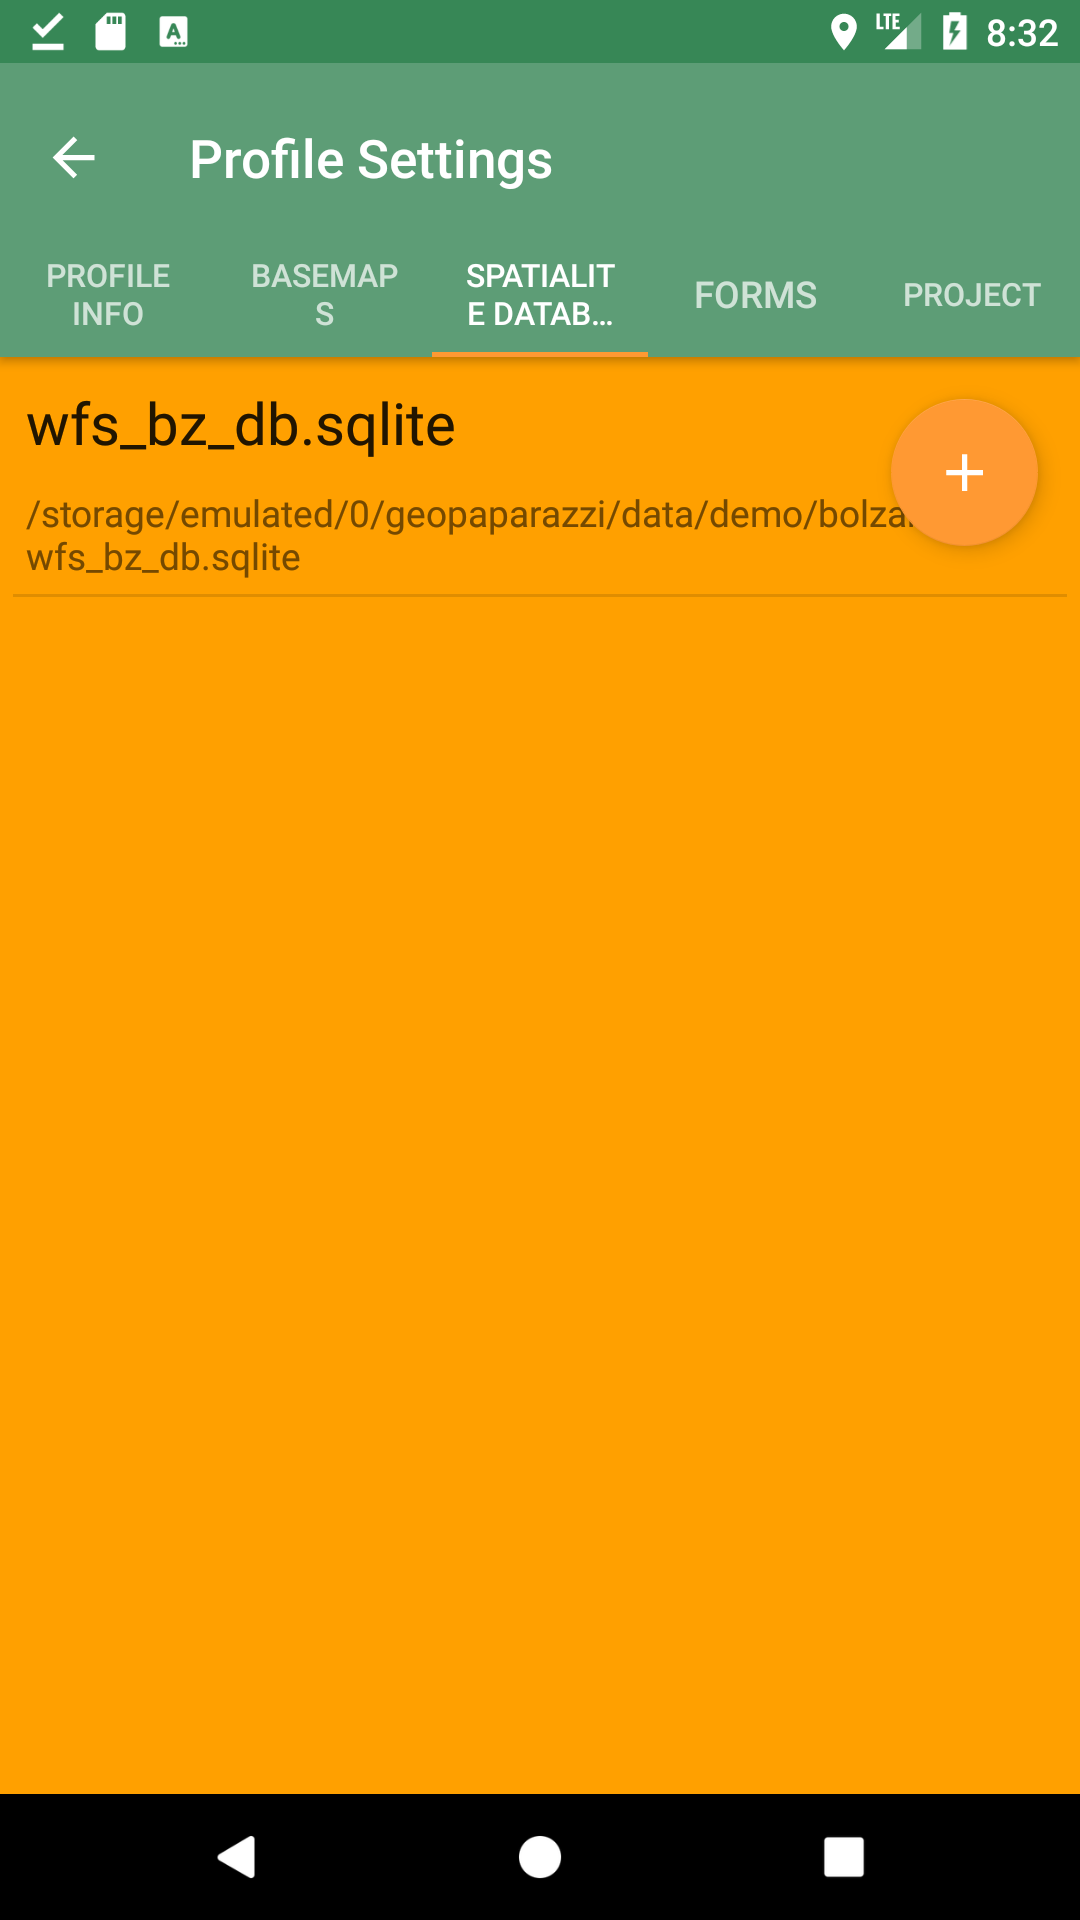
Spatialite Databases
The Spatialite Databases tab allows you to add Spatialite vector databases to the Profile configuration.
The database has to be a valid spatialite database with the extension sqlite.
Press the orange plus button on the top right part of the view to browse the device’s filesystem and select the Spatialite databases to add.
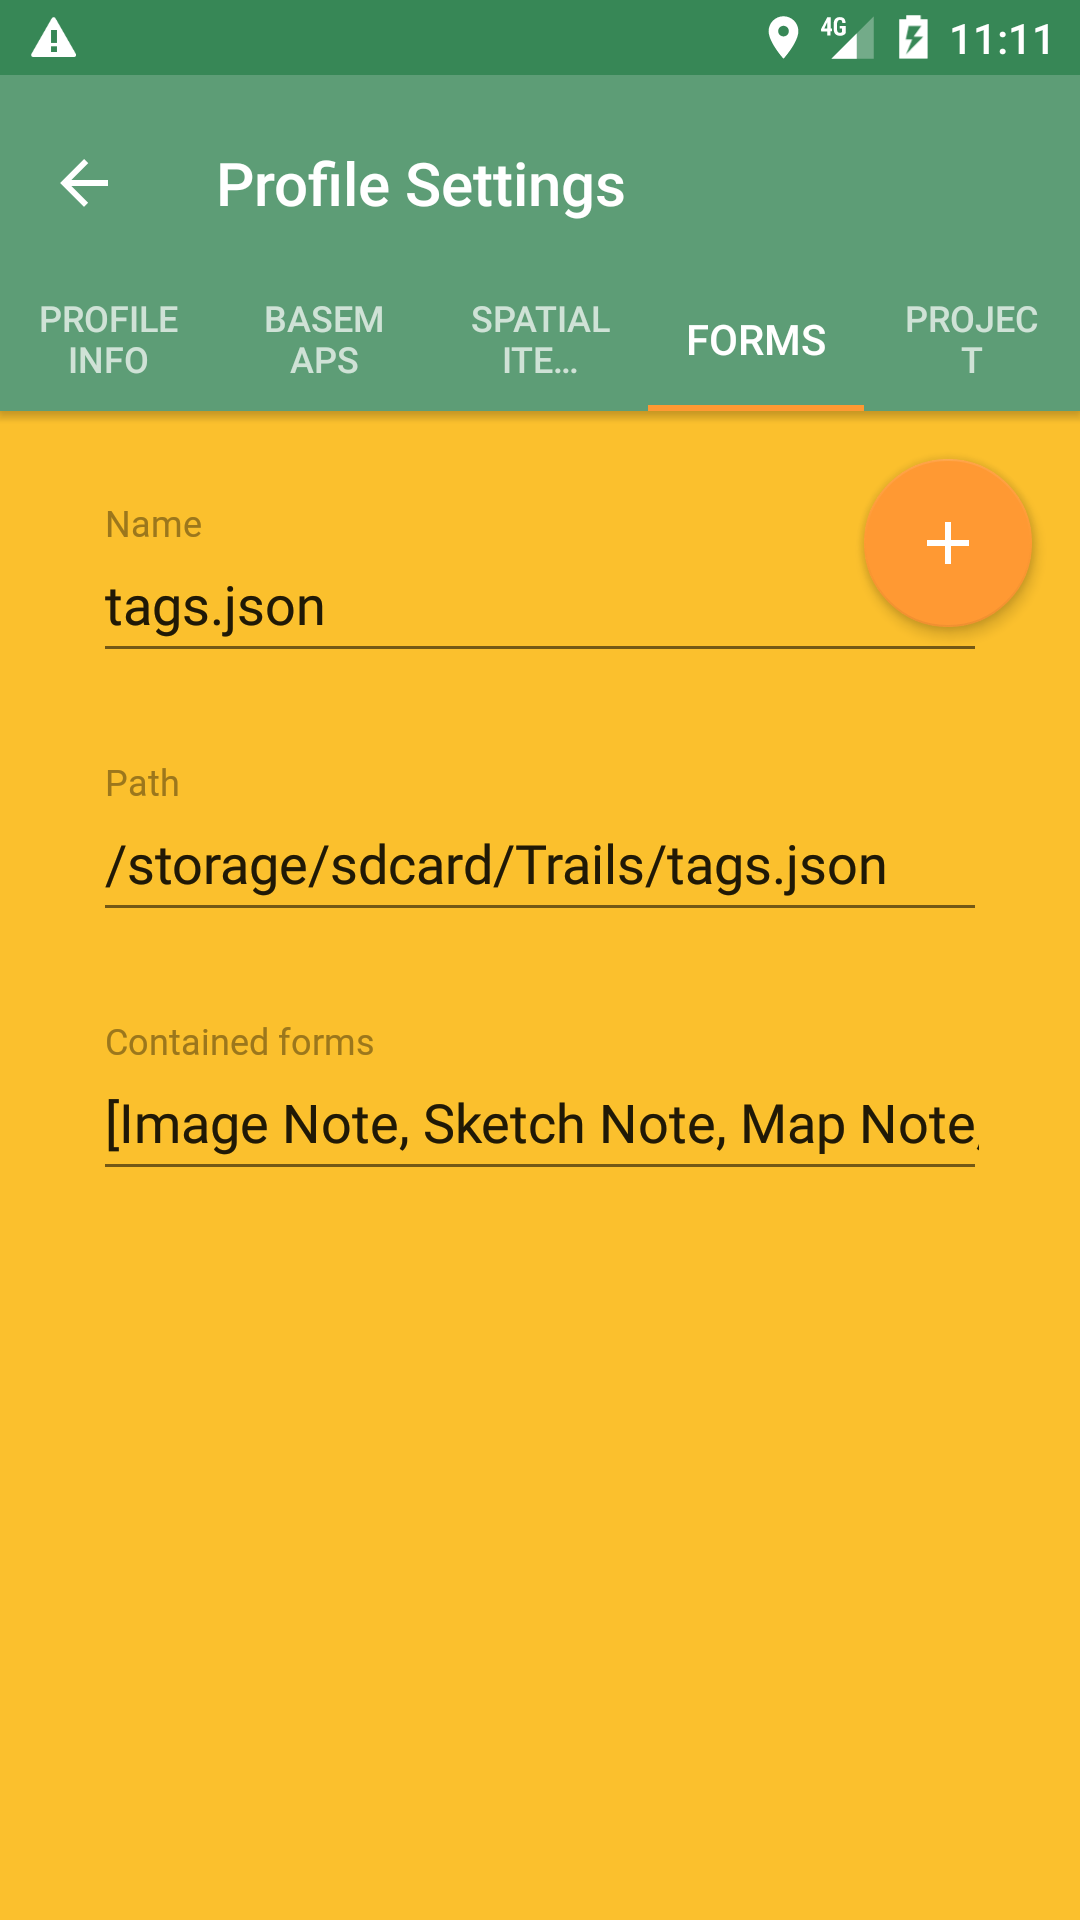
Forms
The Forms tab allows you to add a JSON file of forms definitions to use in the Profile.
Once the file is added (through the upper right plus button), basic information and the names of the forms contained in the file are shown:
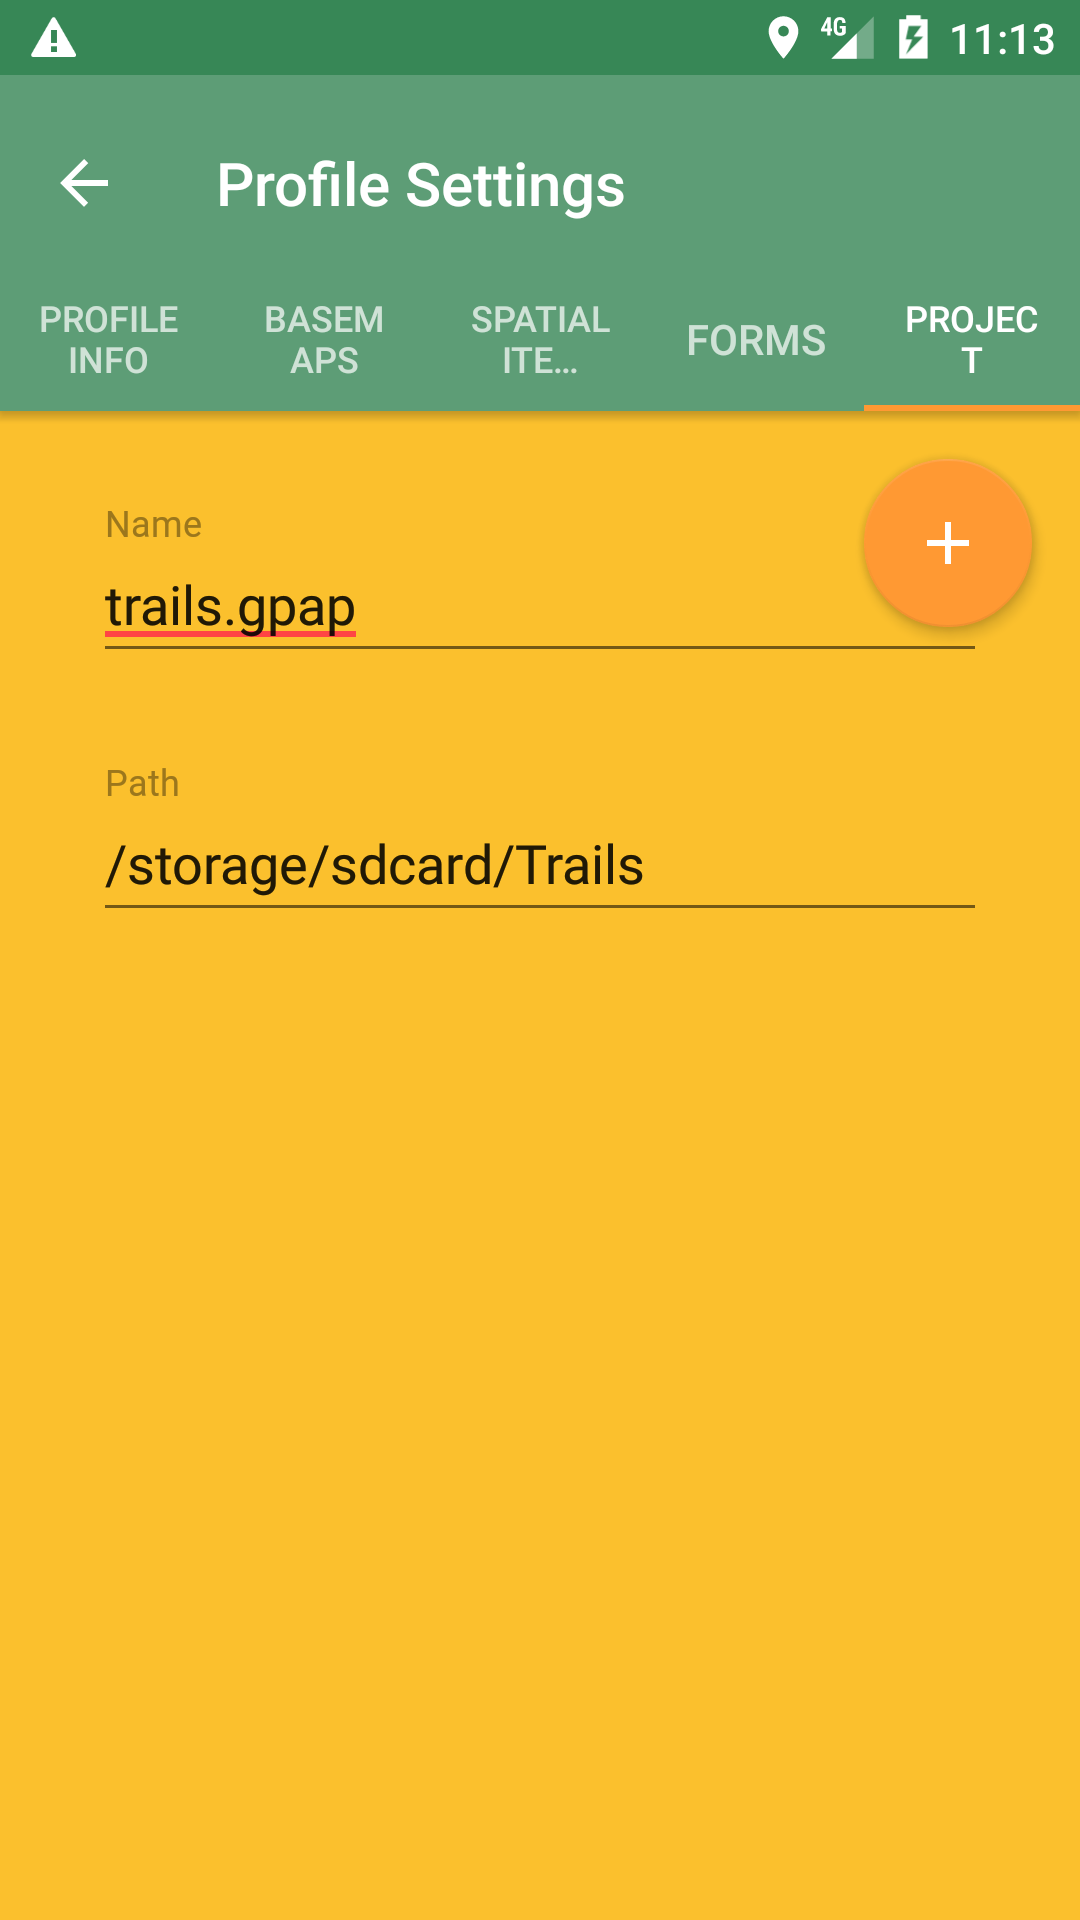
Project
It is also possible to bind a single Geopaparazzi project file to a Profile. In that case, from within geopaparazzi it will no longer be possible to open an existing project or create a new one.
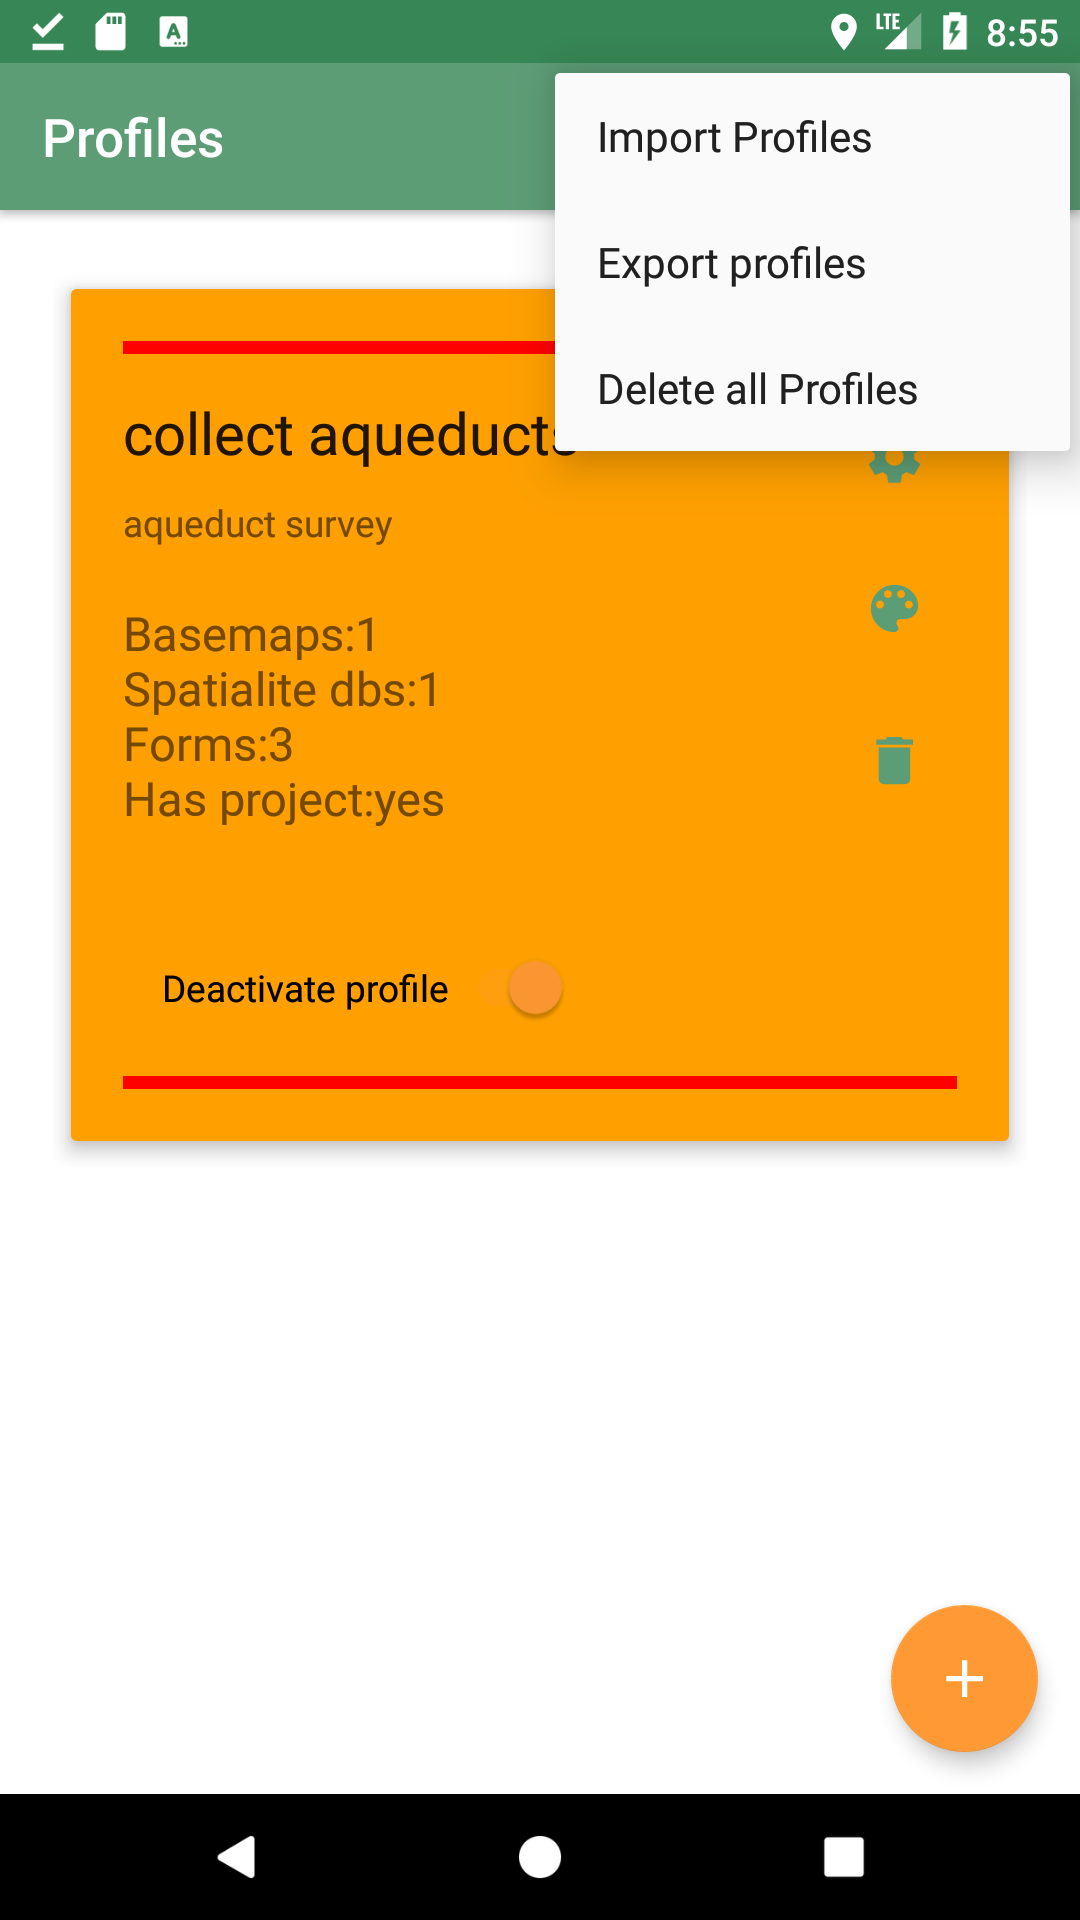
4.5.5. Importing, Exporting and Deleting Profiles
It is possible to import, export, and delete all Profiles. The menu available in the Profiles view allows access to:
-
Import Profiles
-
Export Profiles
-
Delete all Profiles
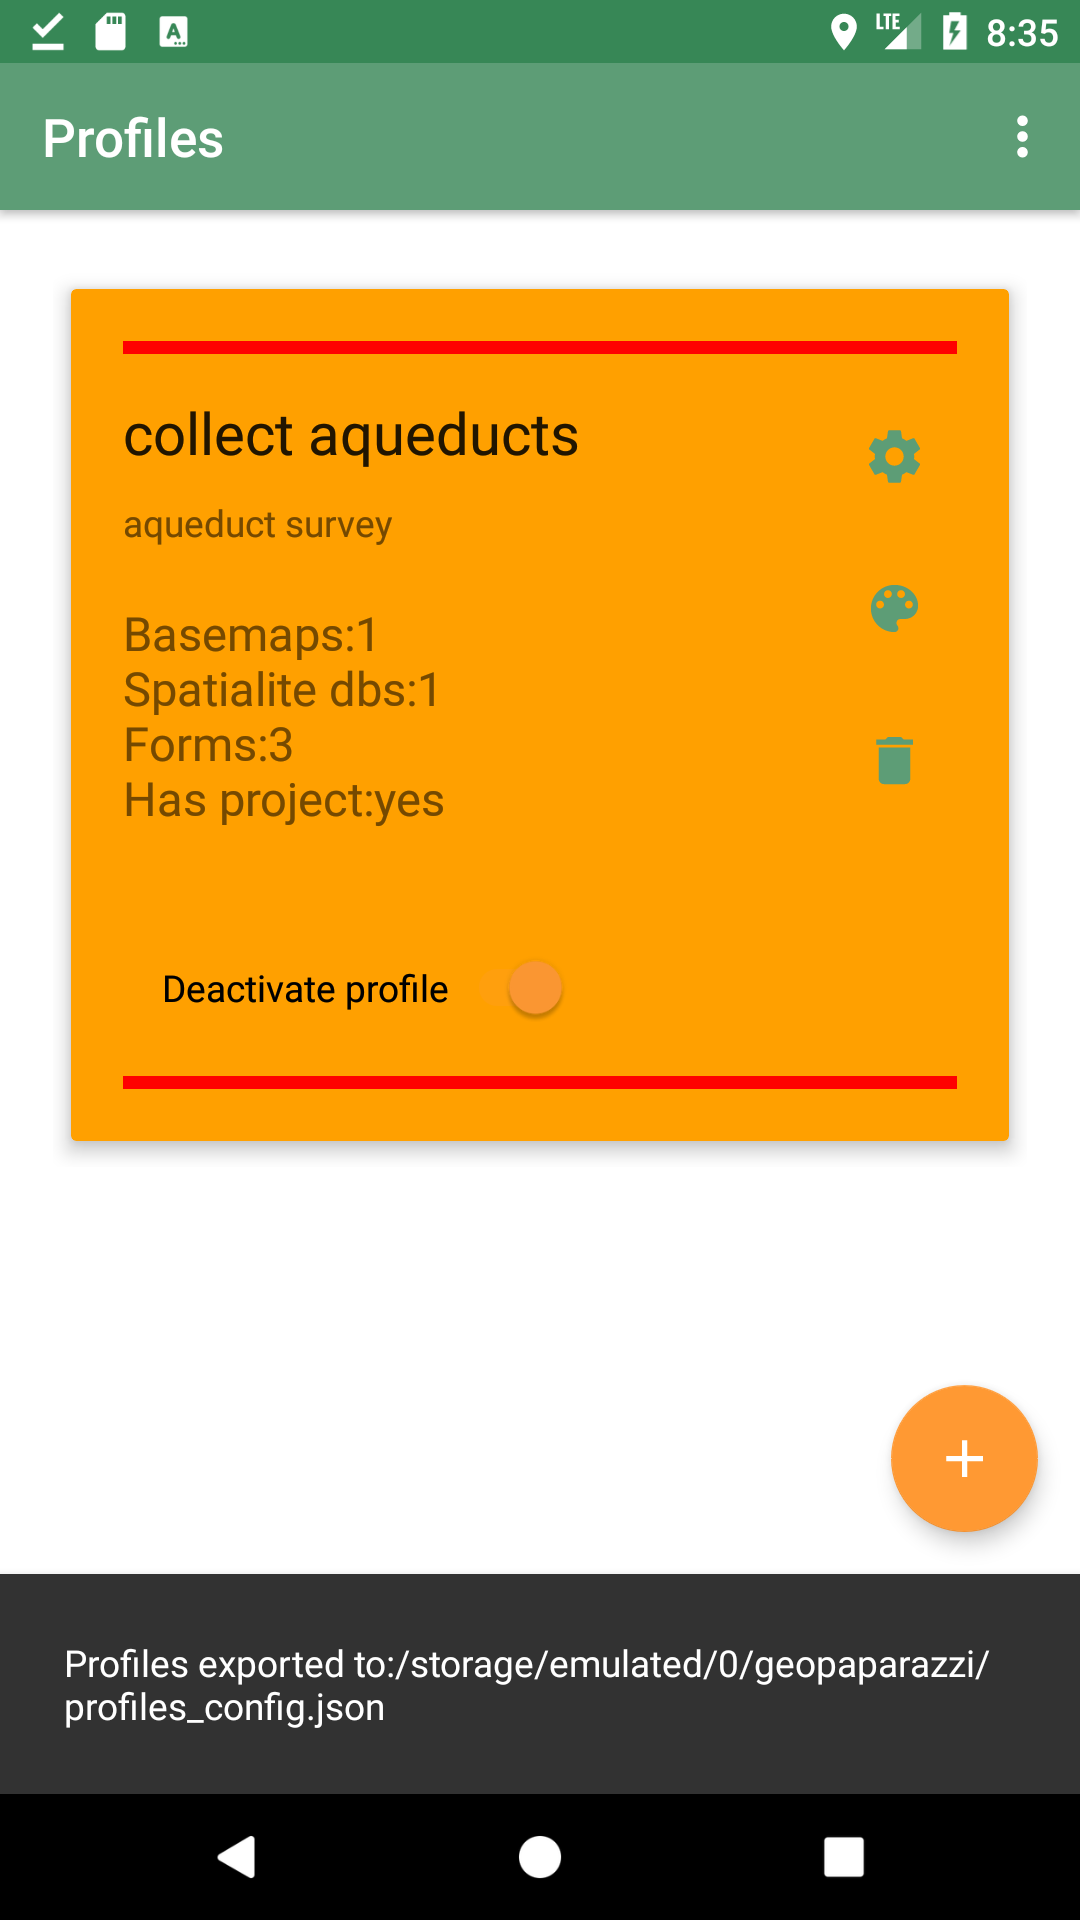
Export
When you press the Export Profiles menu entry, the Profile definitions are exported into a file in the path:
/STORAGE_PATH/geopaparazzi/profiles_config.json
Import
When you press the Import Profiles menu entry, the Profile definitions are imported from the fixed file in the path:
/STORAGE_PATH/geopaparazzi/profiles_config.json
The imported profiles are added to the profiles already present in Geopaparazzi.
In order to support sharing of data and profile configurations, the path of the data contained in the imported files are adapted to the storage path of the current device. This way relative paths in the filesystem are maintained and datasets can be loaded. In that case you download and import data that someone else prepared, but they will work in your device, even if the paths of the data refer to a different filesystem path.
4.6. Exit
The exit button closes Geopaparazzi and stops any ongoing logging and sensor activity.
This might seem obvious, but it is important to note that this is the only way to properly close Geopaparazzi. Pushing the home button of the device will not close Geopaparazzi, which will continue any activity started. This is important, because it makes very long GPS loggings possible even if interrupted by phone calls or other uses of the device.
Often users that ignore this, after pushing the home screen and thinking that Geopaparazzi has been closed, experience a faster battery drop, because of the active application in the background.
5. Settings
The Settings page is divided into main categories:
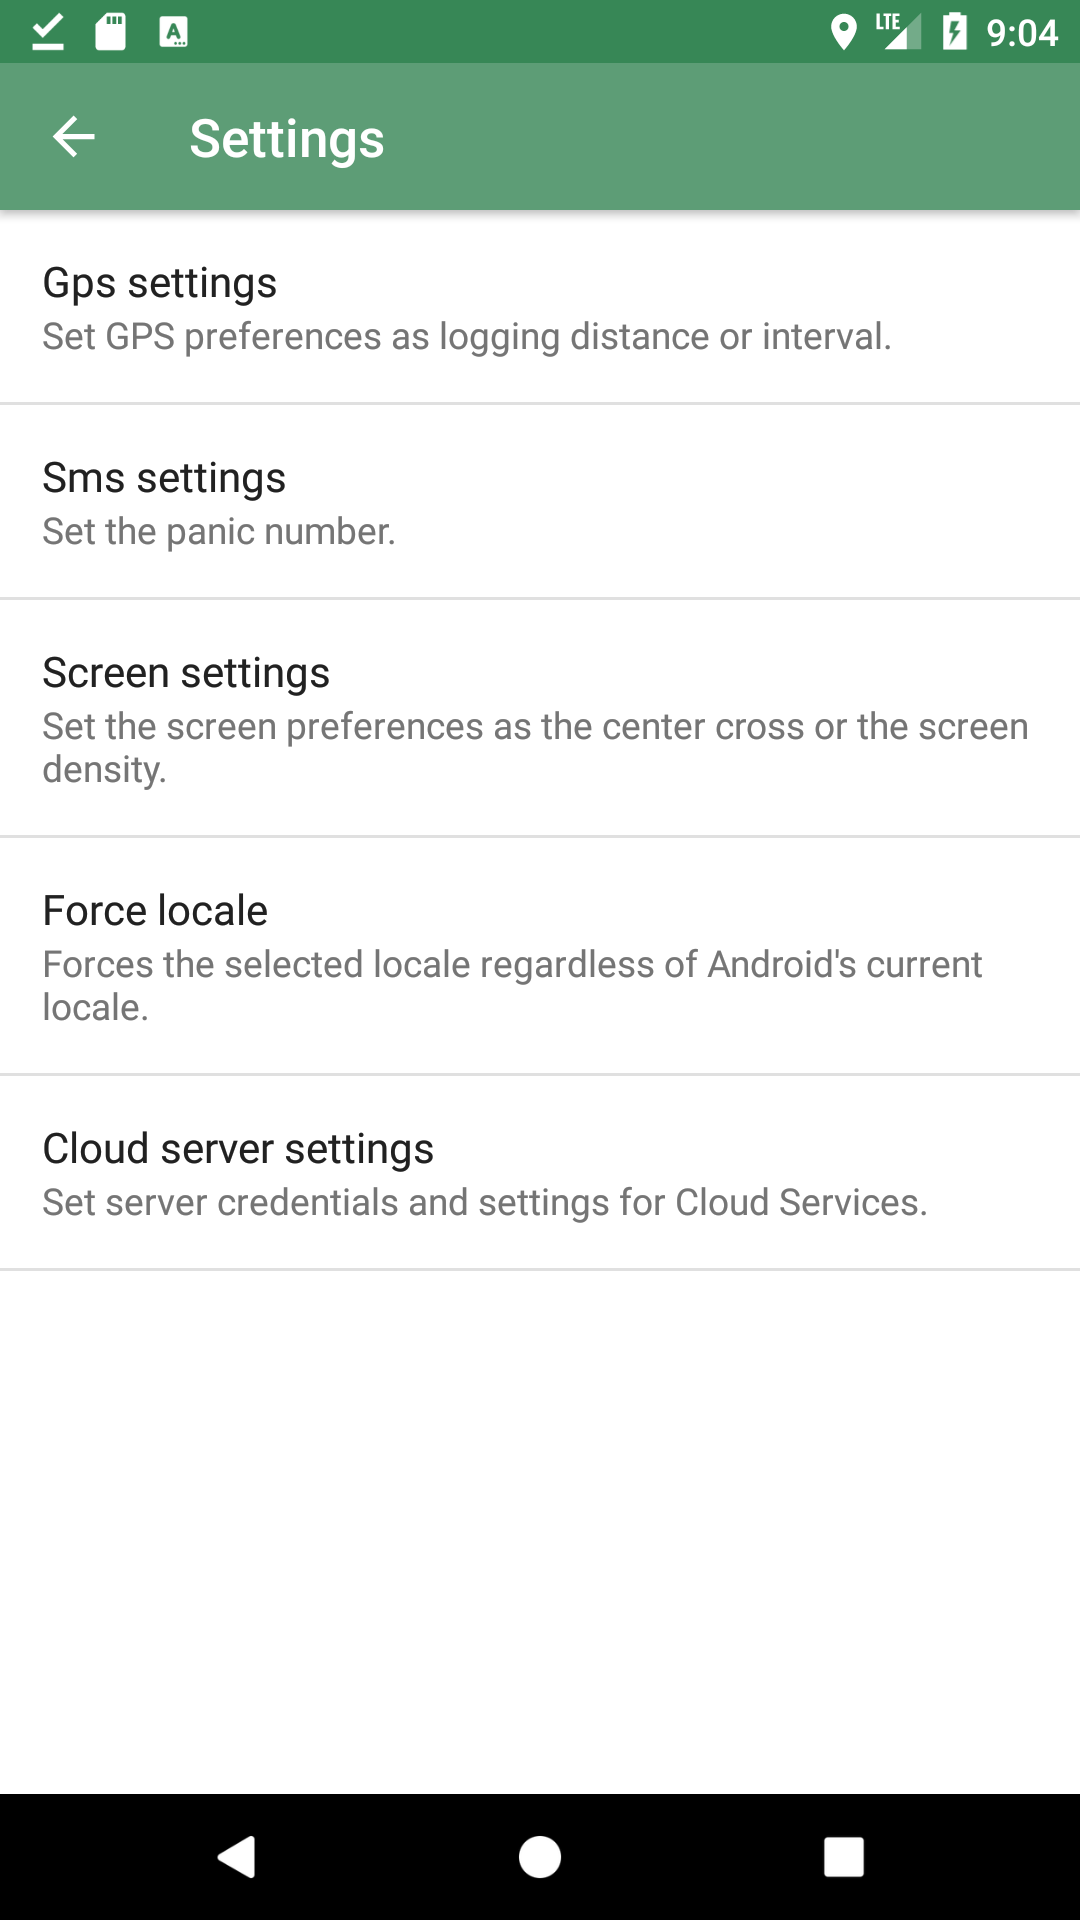
5.1. GPS Settings
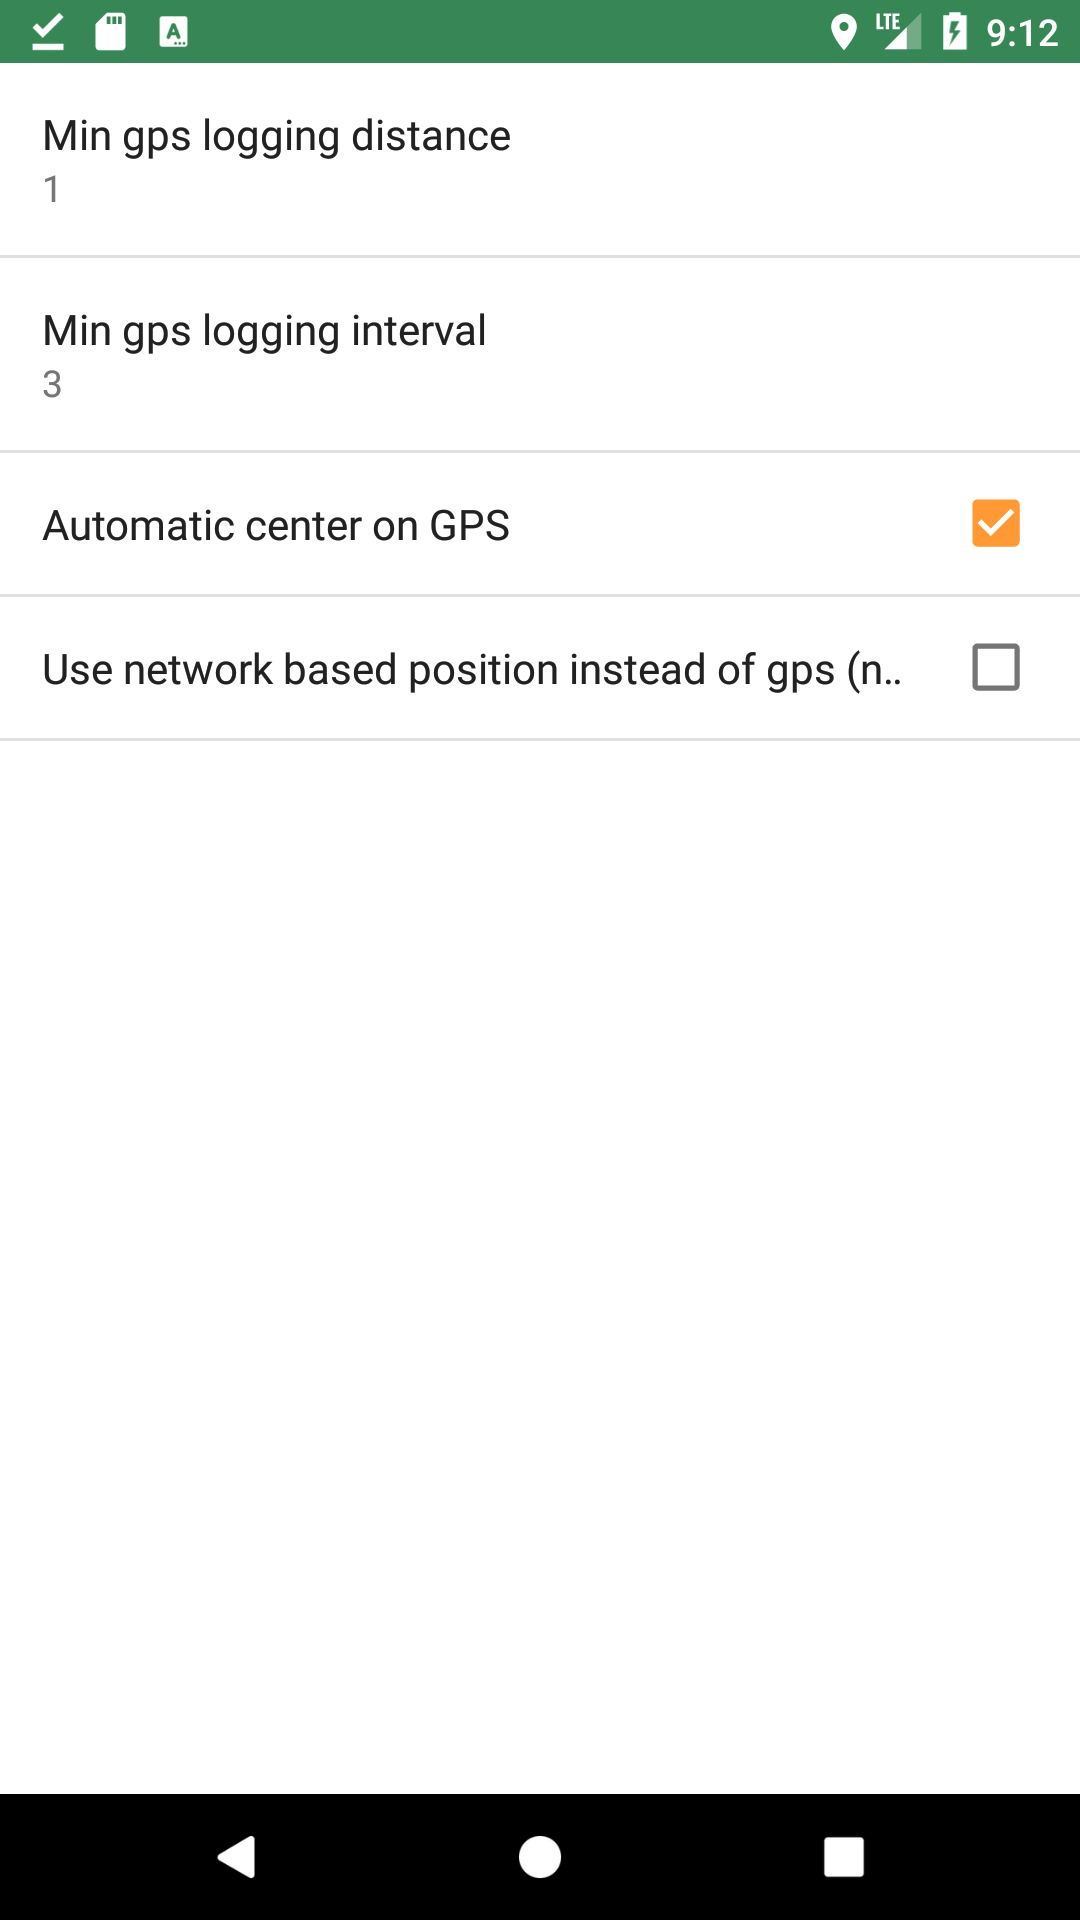
In the GPS preferences it is possible to
-
define the time interval for taking a point when in logging mode. This is the primary filter for location.
-
define the minimum distance in meters, the current GPS location must be from the previous GPS saved point before it is added to the GPS log. This is useful for example in the case in which the user stops moving during logging and the GPS continues to supply points. This is a secondary filter to prevent the addition of points with the same location to the GPS log.
-
have the Map View re-centered on the GPS position when the position reaches the screen border (useful while driving)
-
use network based position instead of GPS position. This can be useful for testing purposes. The network based position is by no means precise!
5.2. SMS Settings
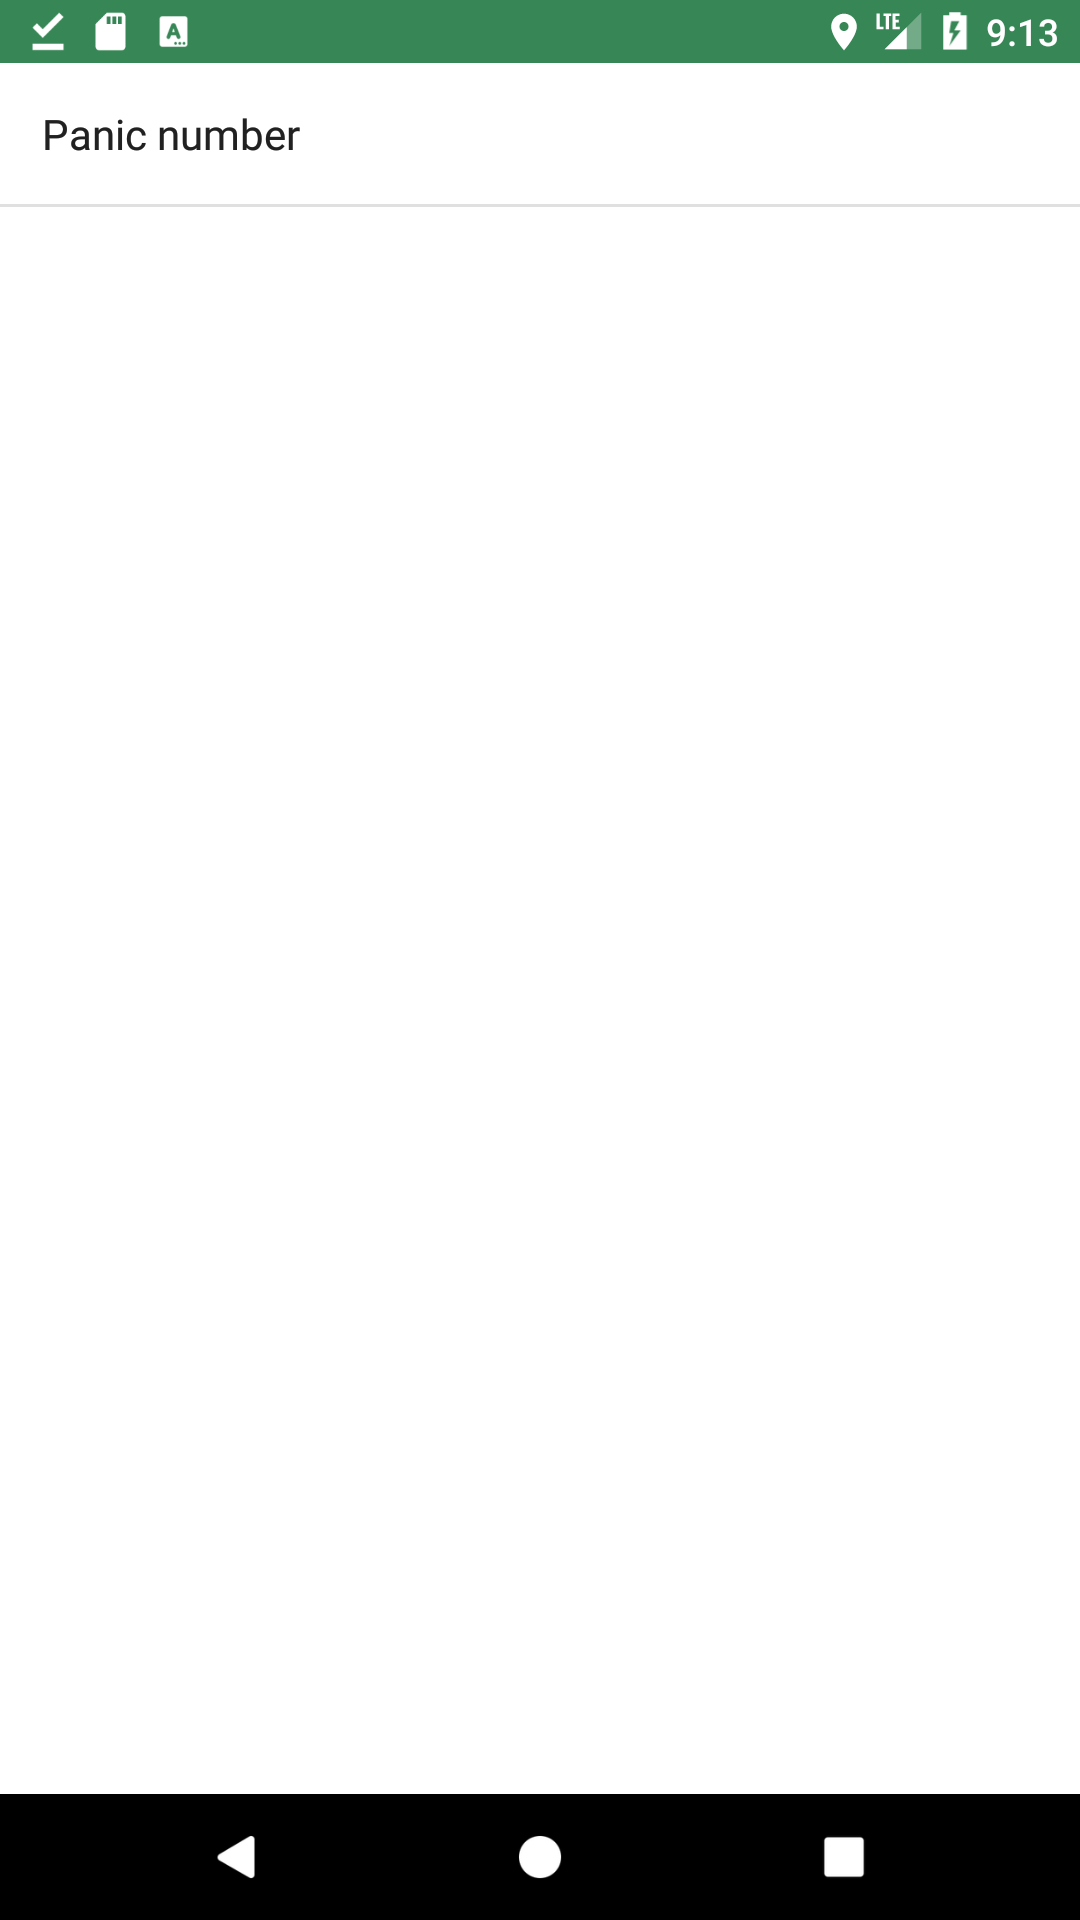
Insert the panic numbers(s), i.e. the numbers to which a status update is sent when the panic button on the Main View is pressed.
5.3. Screen Settings
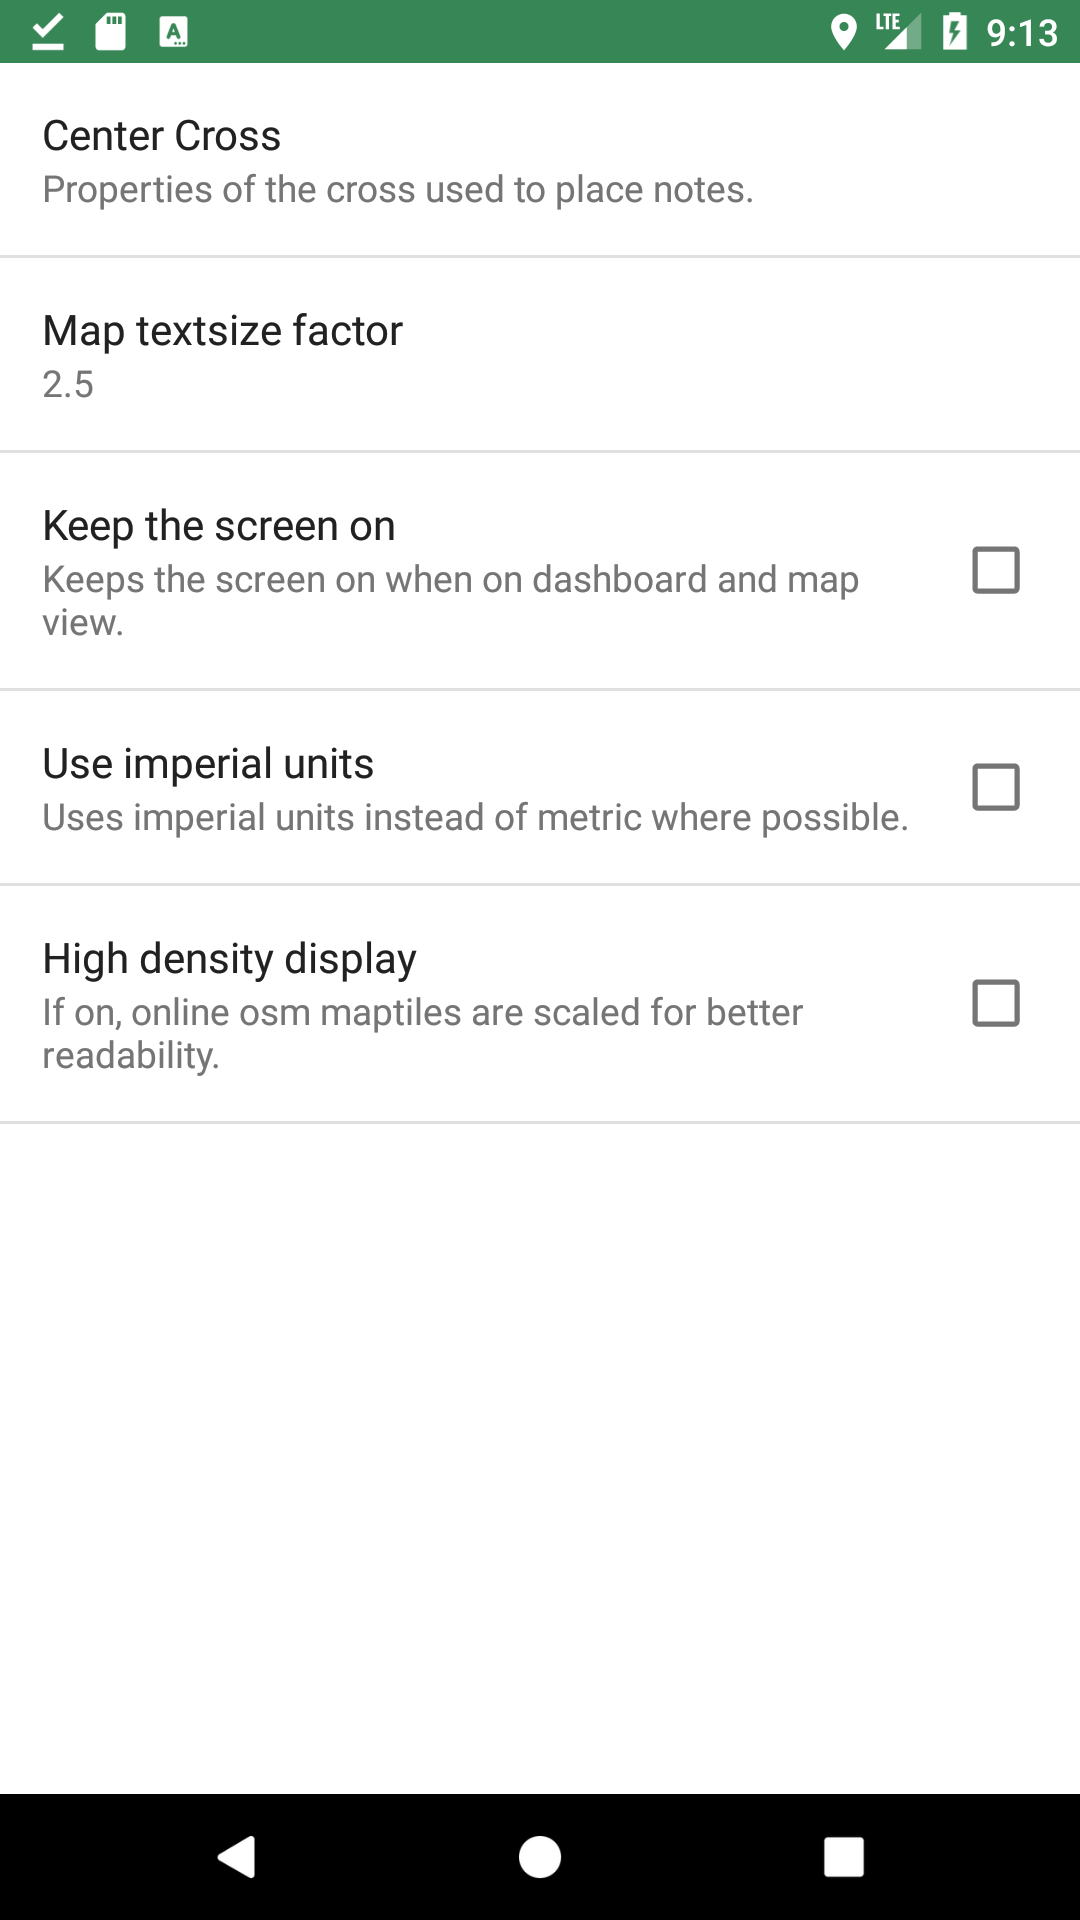
In the screen preferences it is possible to
-
change the map center cross properties (size, color, stroke width)
-
change the Mapsforge map text size factor (default is 2.5x. To make text bigger, increase the value)
-
enable the always screen on mode
-
toggle the use of metric/imperial units
-
enable settings to optimize rendering for high density displays
5.4. Force Locale
The locale of Geopaparazzi can be changed regardless of the locale used for Android.
This setting opens a menu in which a locale can be chosen between the available ones:
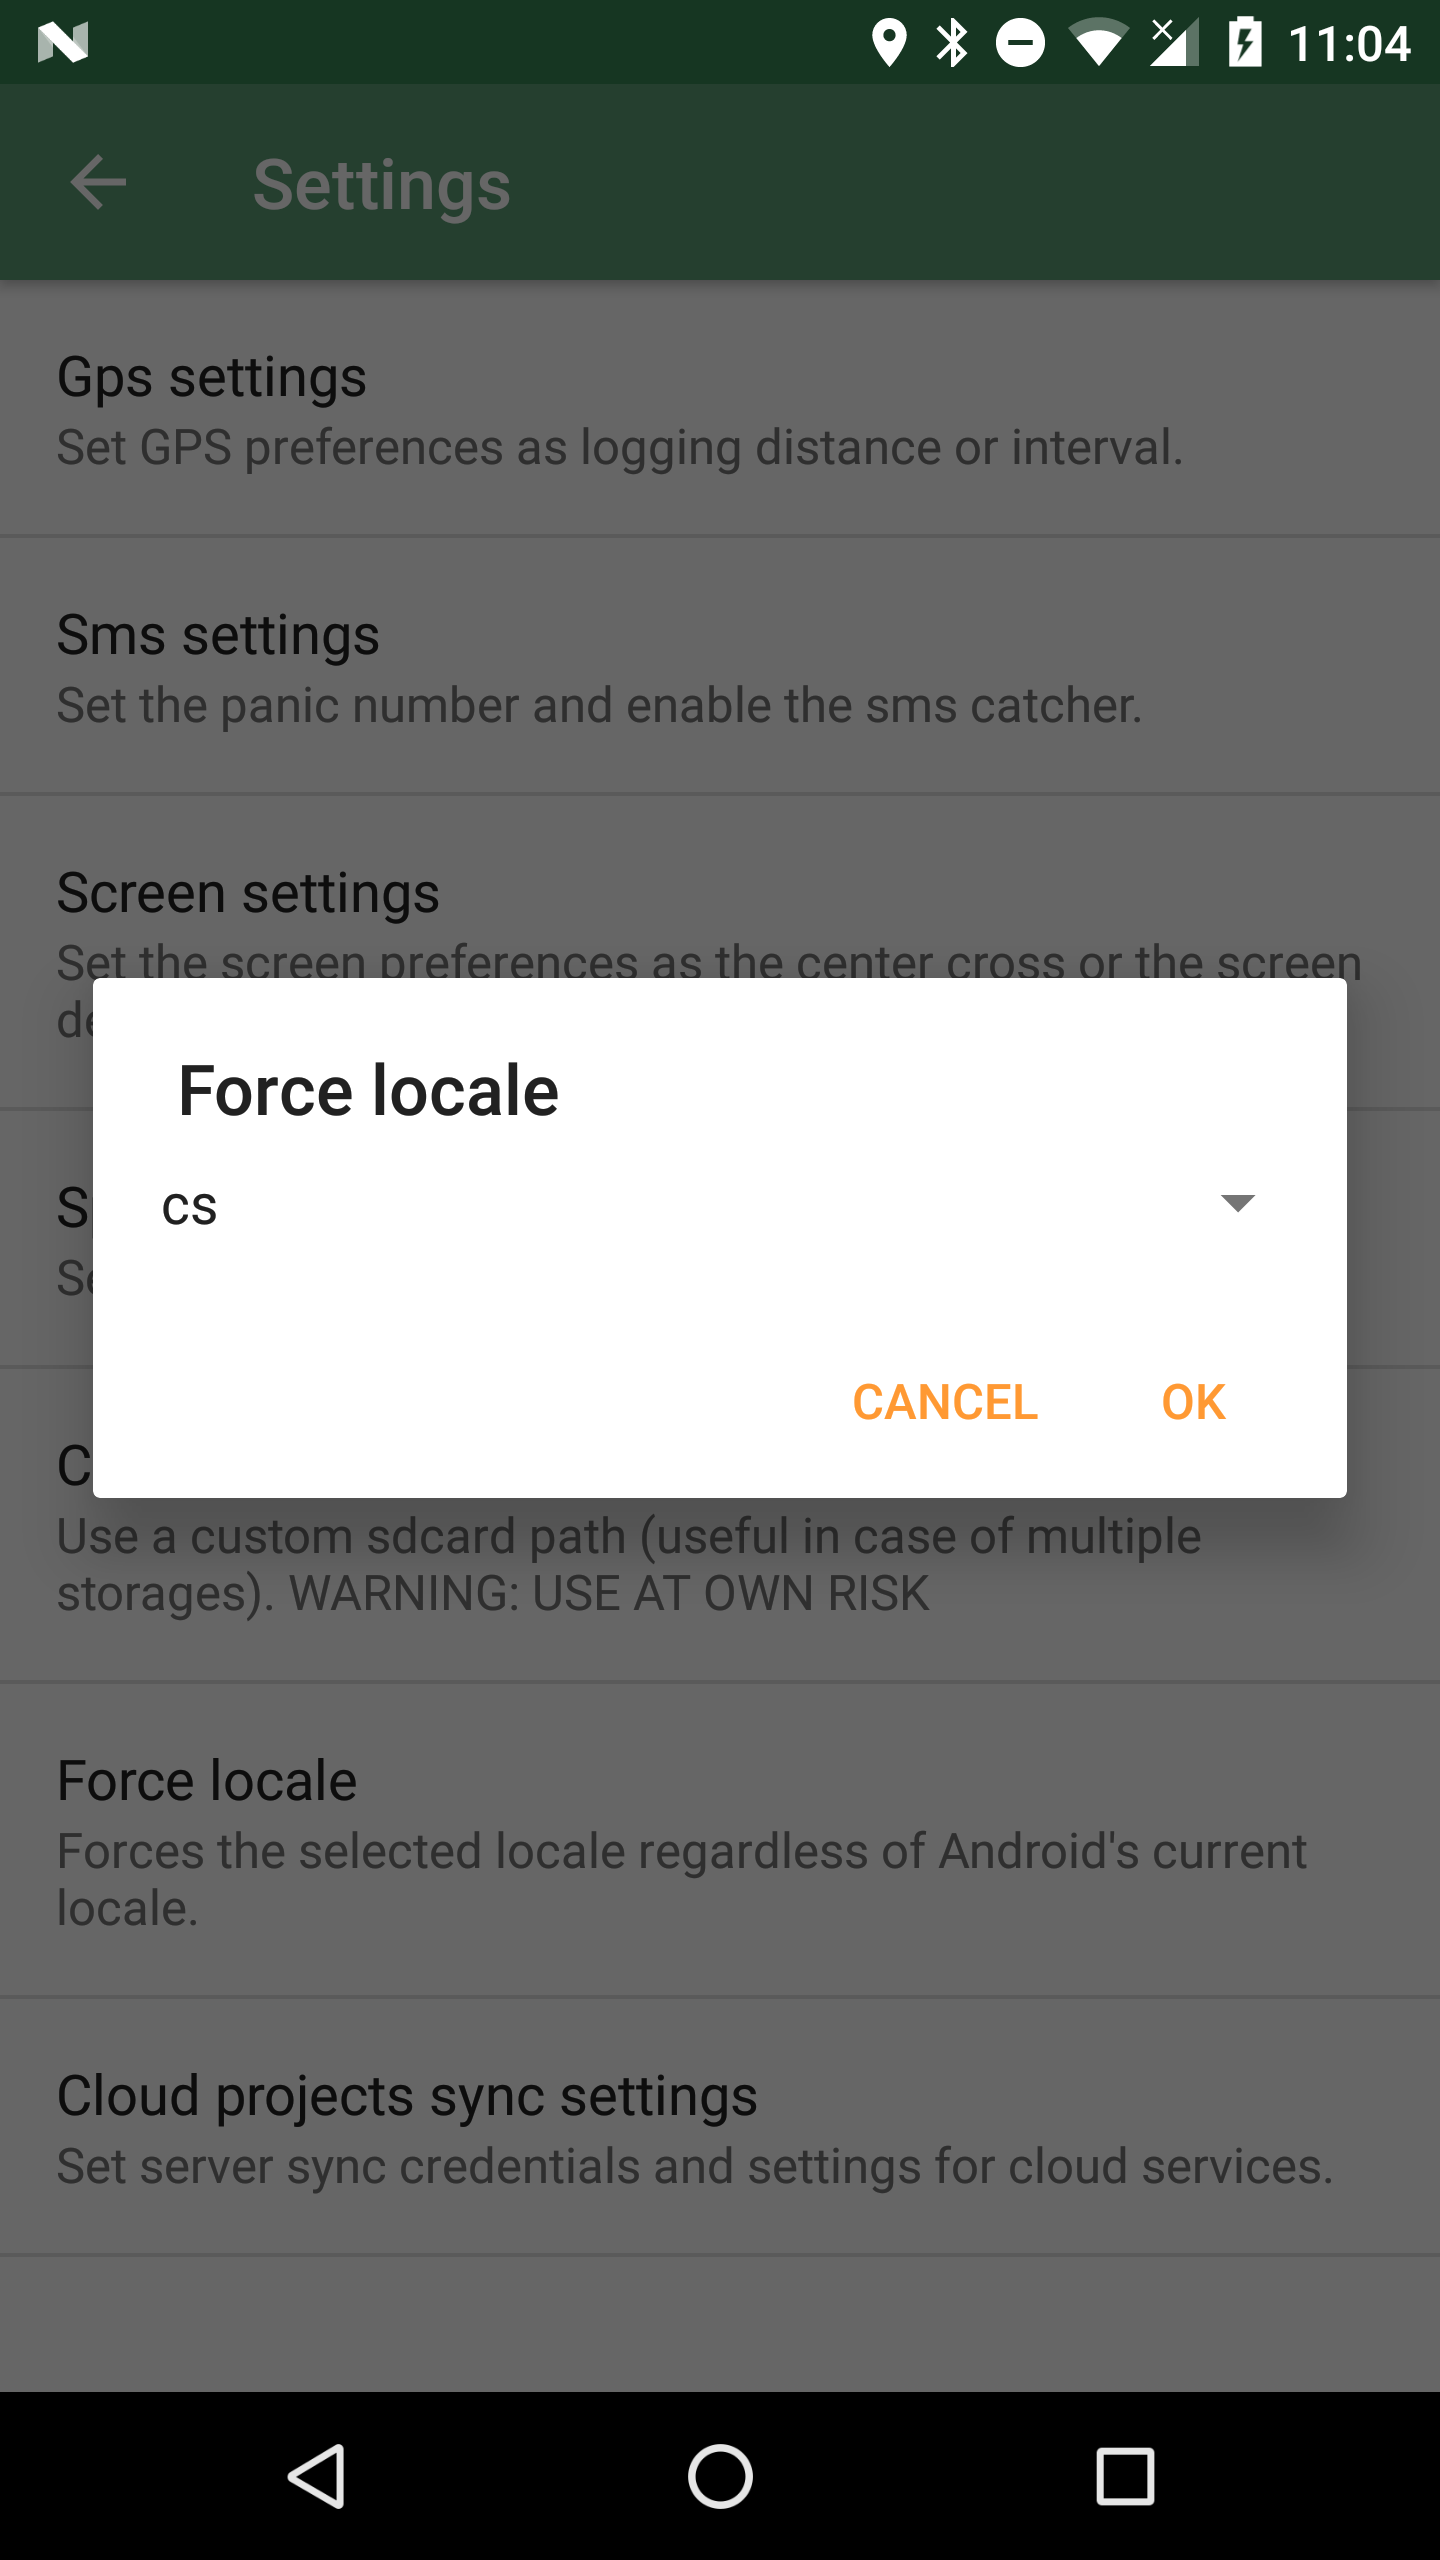
After that, each newly loaded view will be in the new locale.
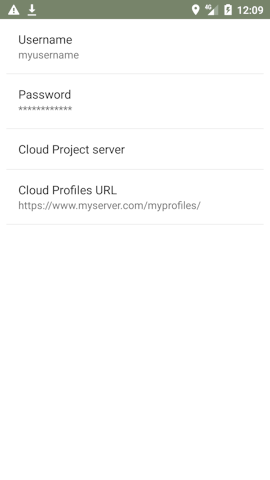
5.5. Cloud server Settings
These settings allows you to set a :
-
Geopaparazzi Cloud Project server URL
-
Cloud Profile server URL
-
optionally add a username and password for the servers.
A Geopaparazzi Cloud Project server allows you to download and upload Geopaparazzi projects. A Geopaparazzi Cloud Profile server allows you to download Profiles along with the files they reference such as basemaps, Spatialite overlays, project, forms , and other files.
Known Geopaparazzi Cloud Project servers are:
-
gvSIG Desktop with the hydrologis4gvsig plugins installed
-
gvSIG Online
Known Geopaparazzi Cloud Profile servers are:
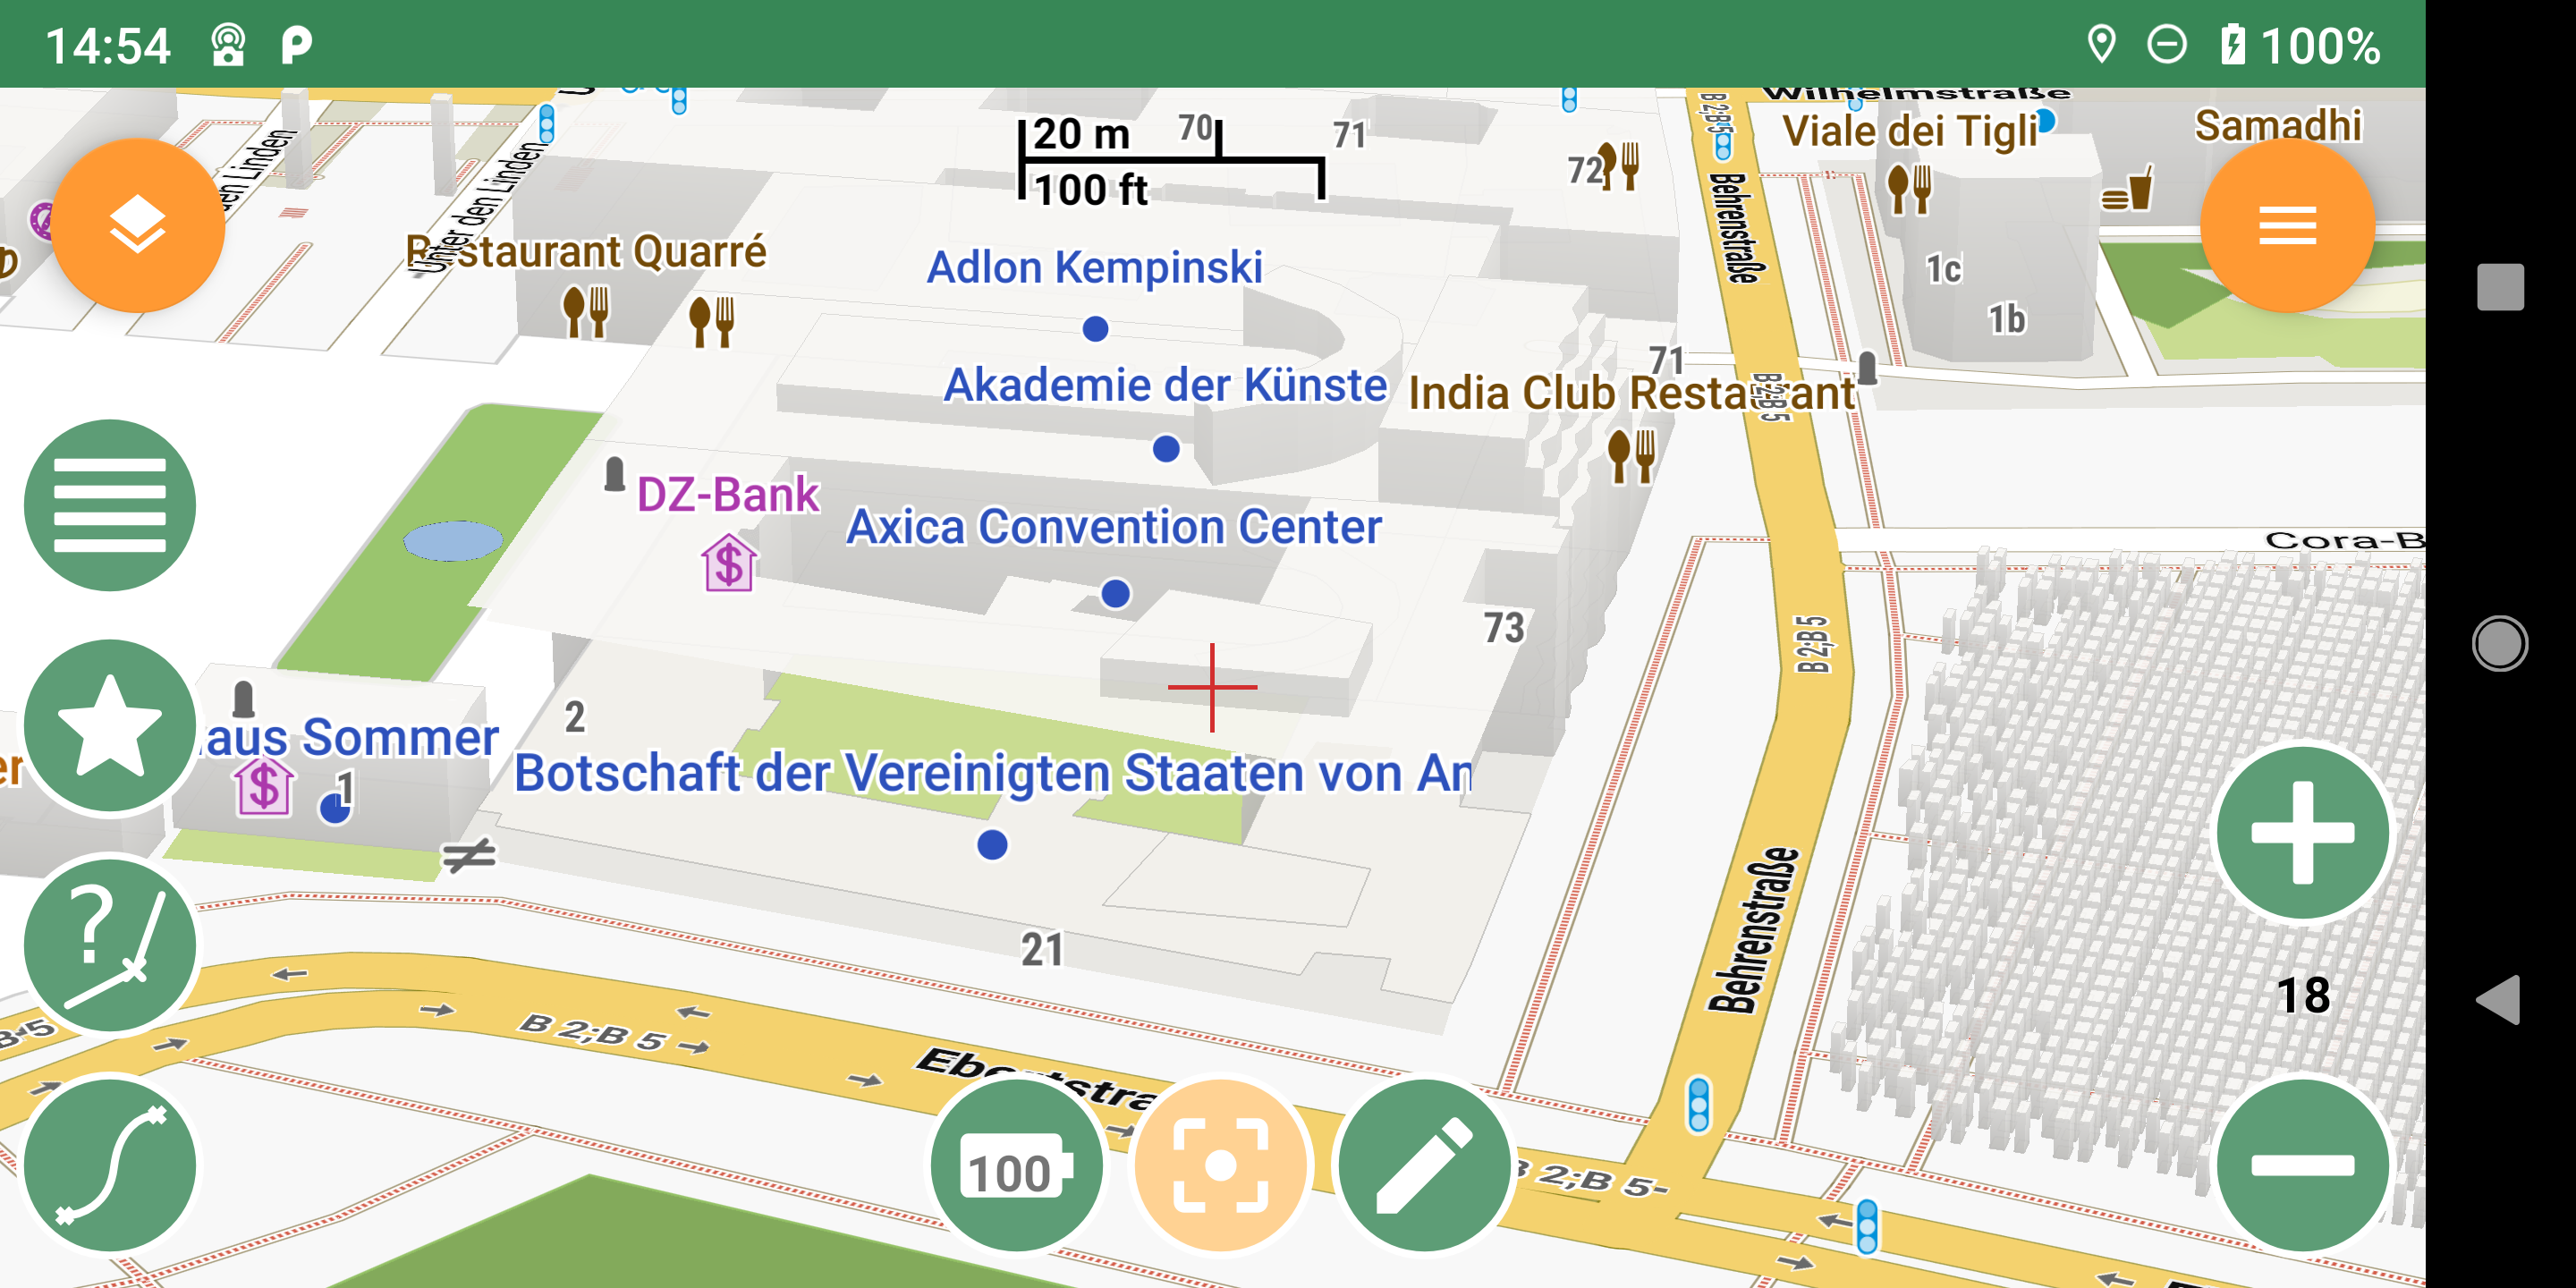
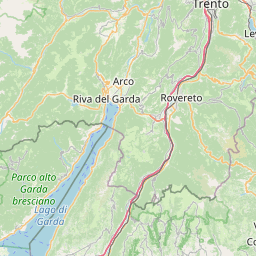
6. The Map View
The map view is the central view of the application. It can be used to view the current GPS position overlaid on maps and vector datasets.
The supported datasets section lists and describes all supported map types. Just to cite a few, you can view:
-
OpenStreetMap raster tile maps both when on-line (downloading new tiles) and off-line (visualizing those that were cached during online mode)
-
local and remote TMS tiles
-
mapsforge vector files
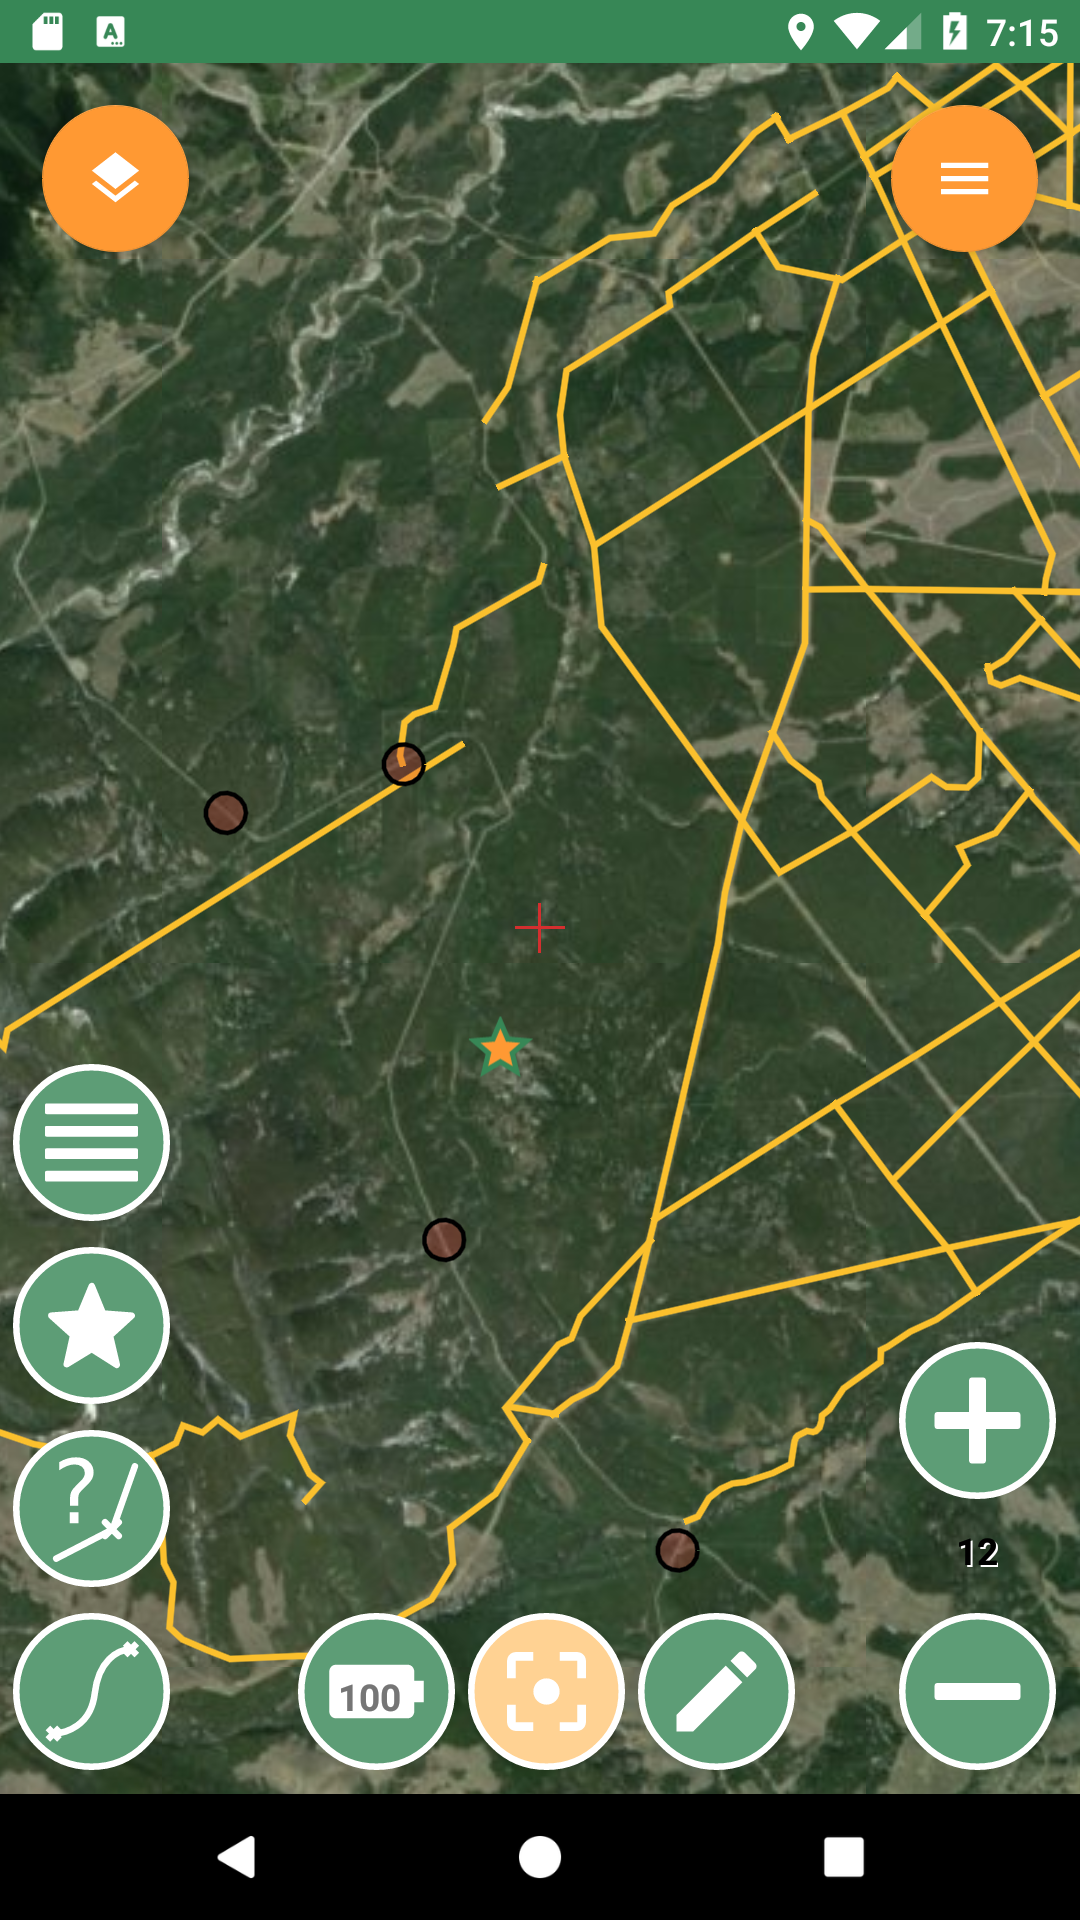
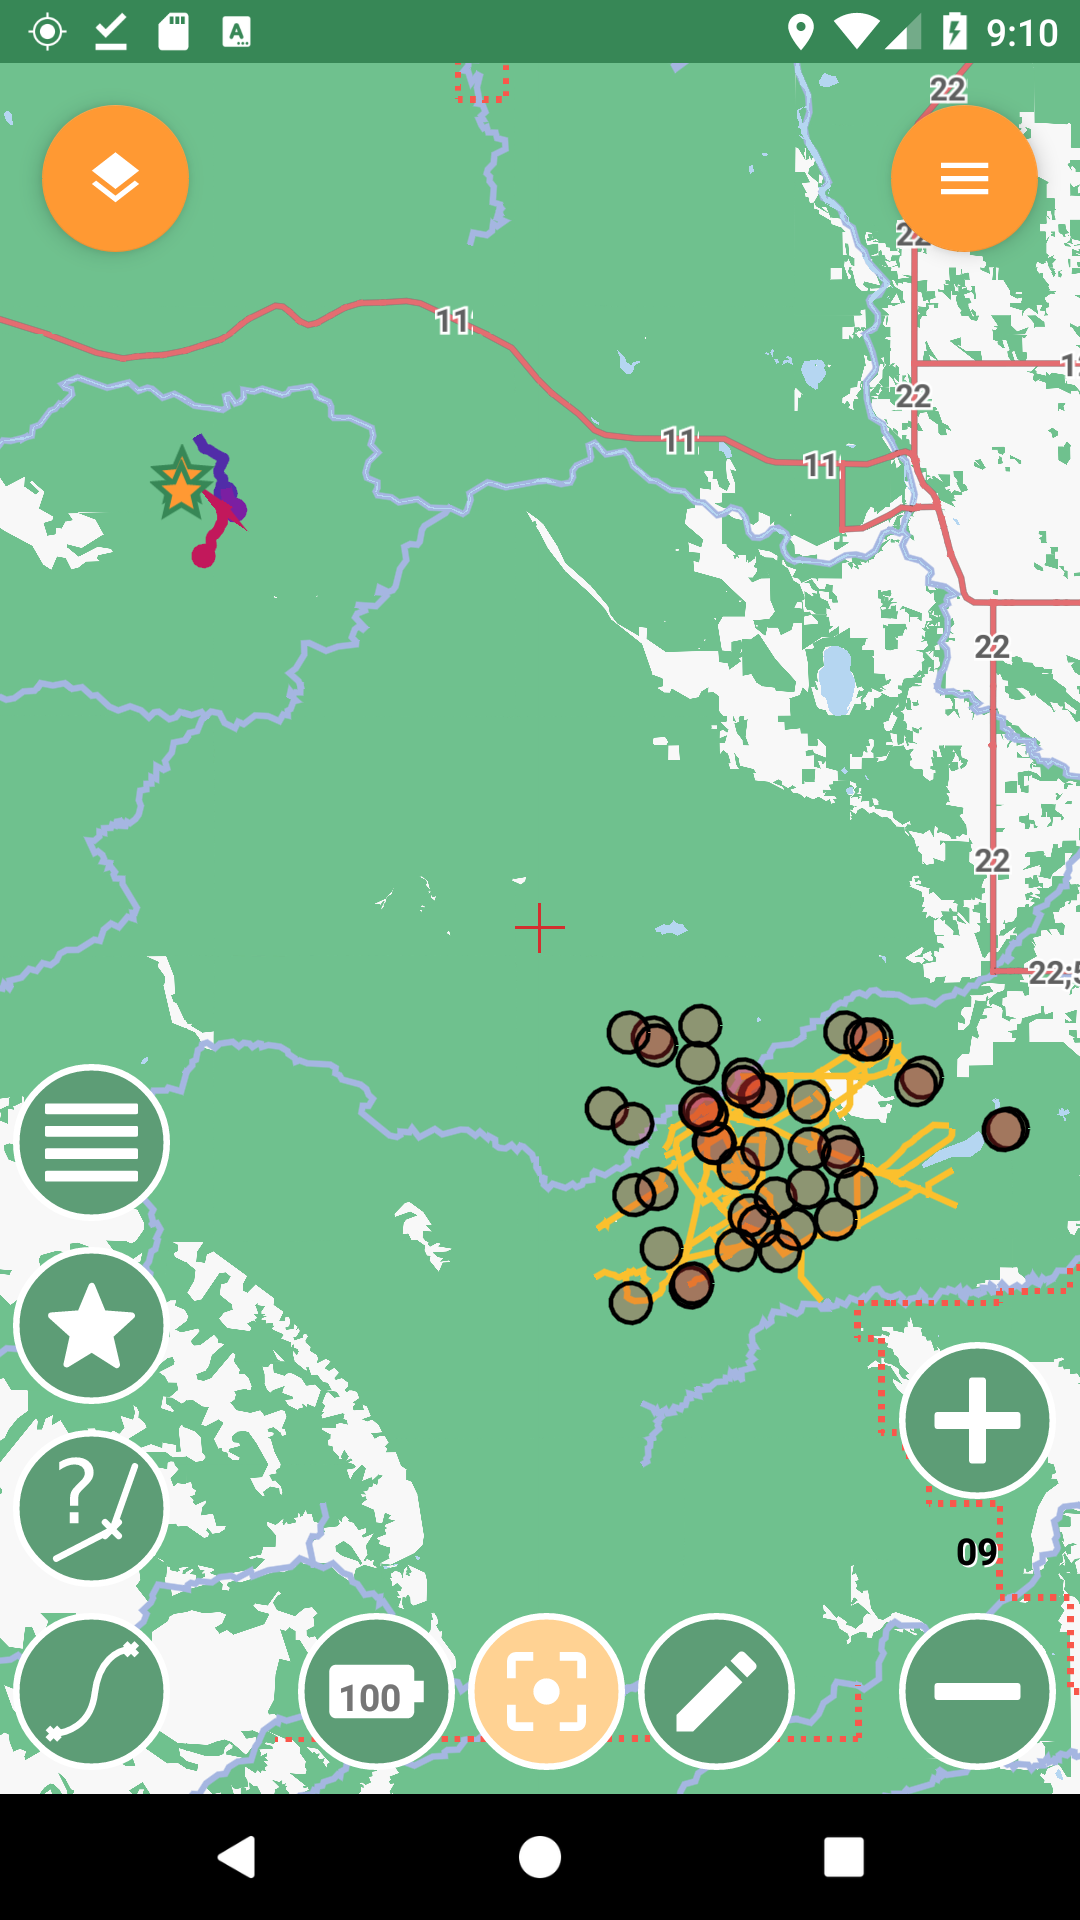
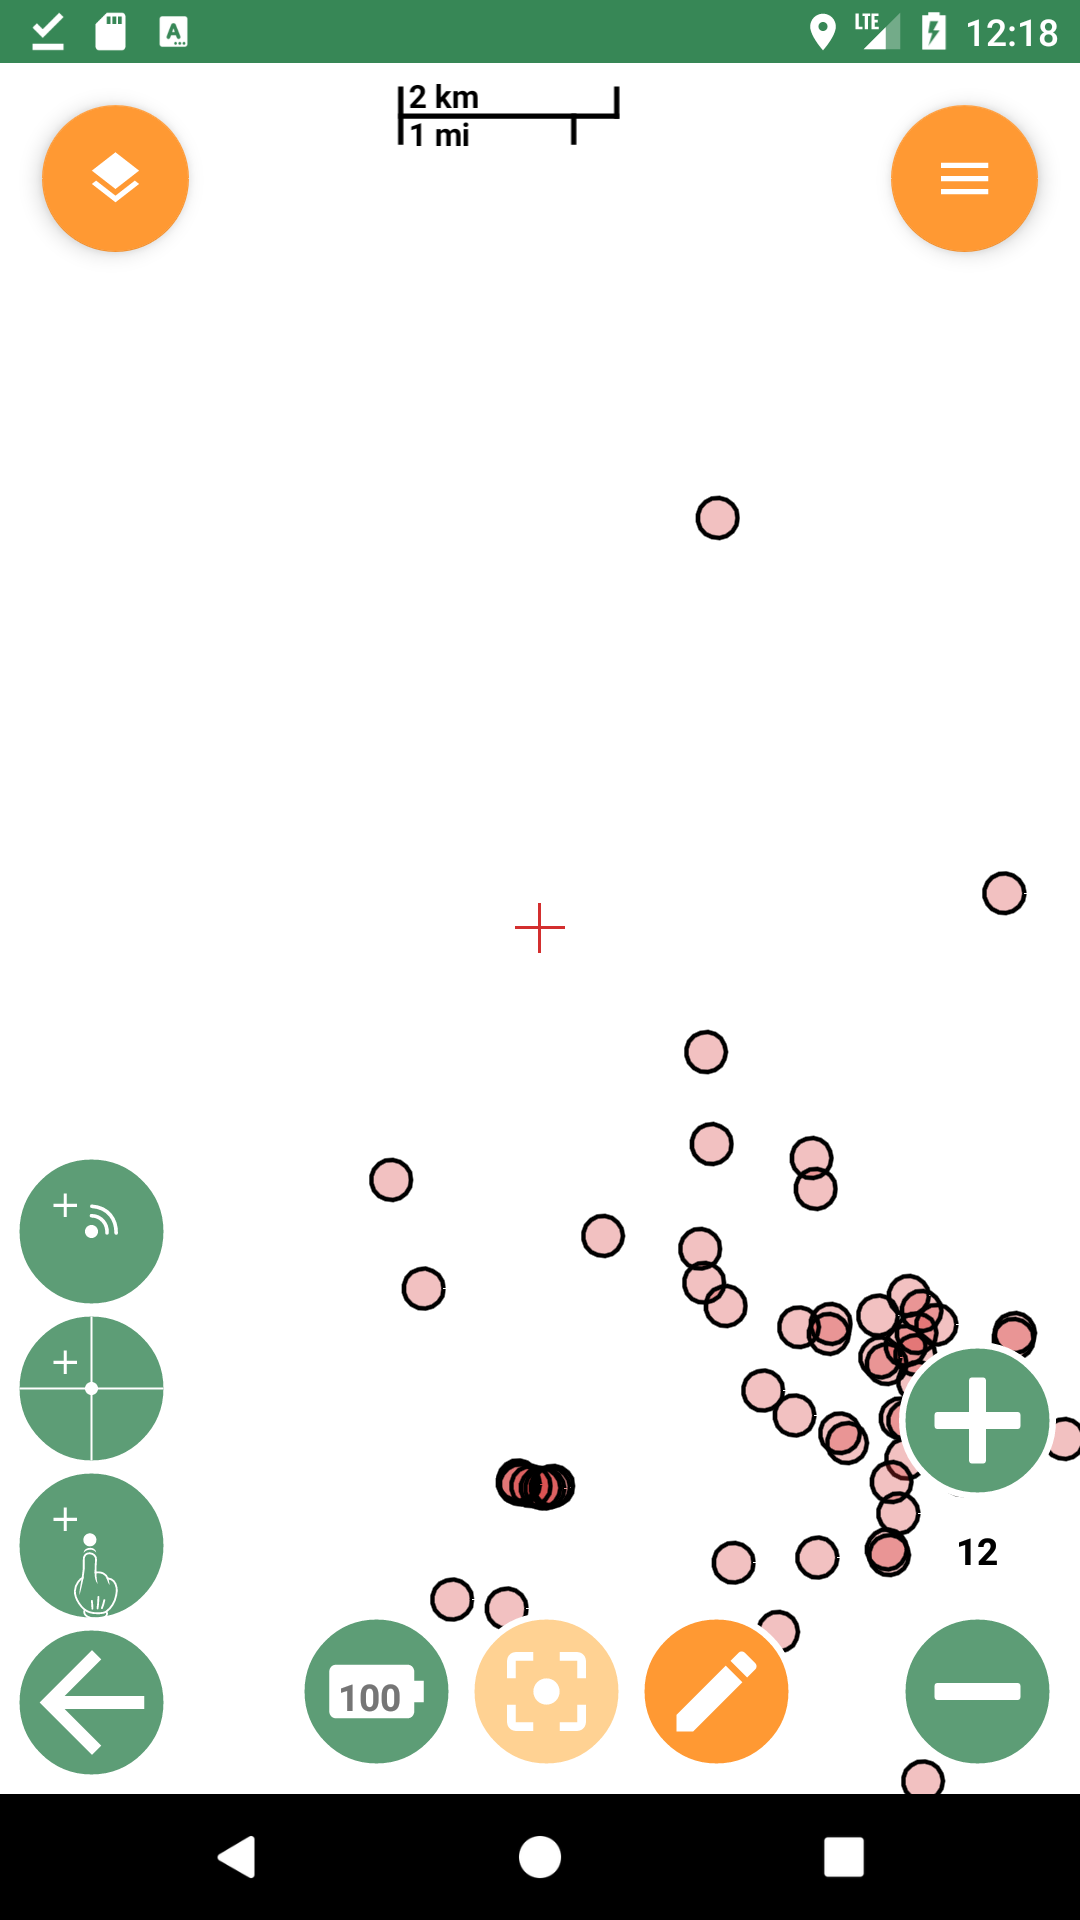
6.1. Map View tools
The Map View has a set of tools that can be used to interact with the map.
When first launched, the tools are already visible on the map. To have a cleaner Map View, you can long press on the upper right menu button to toggle the visibility of the tools.
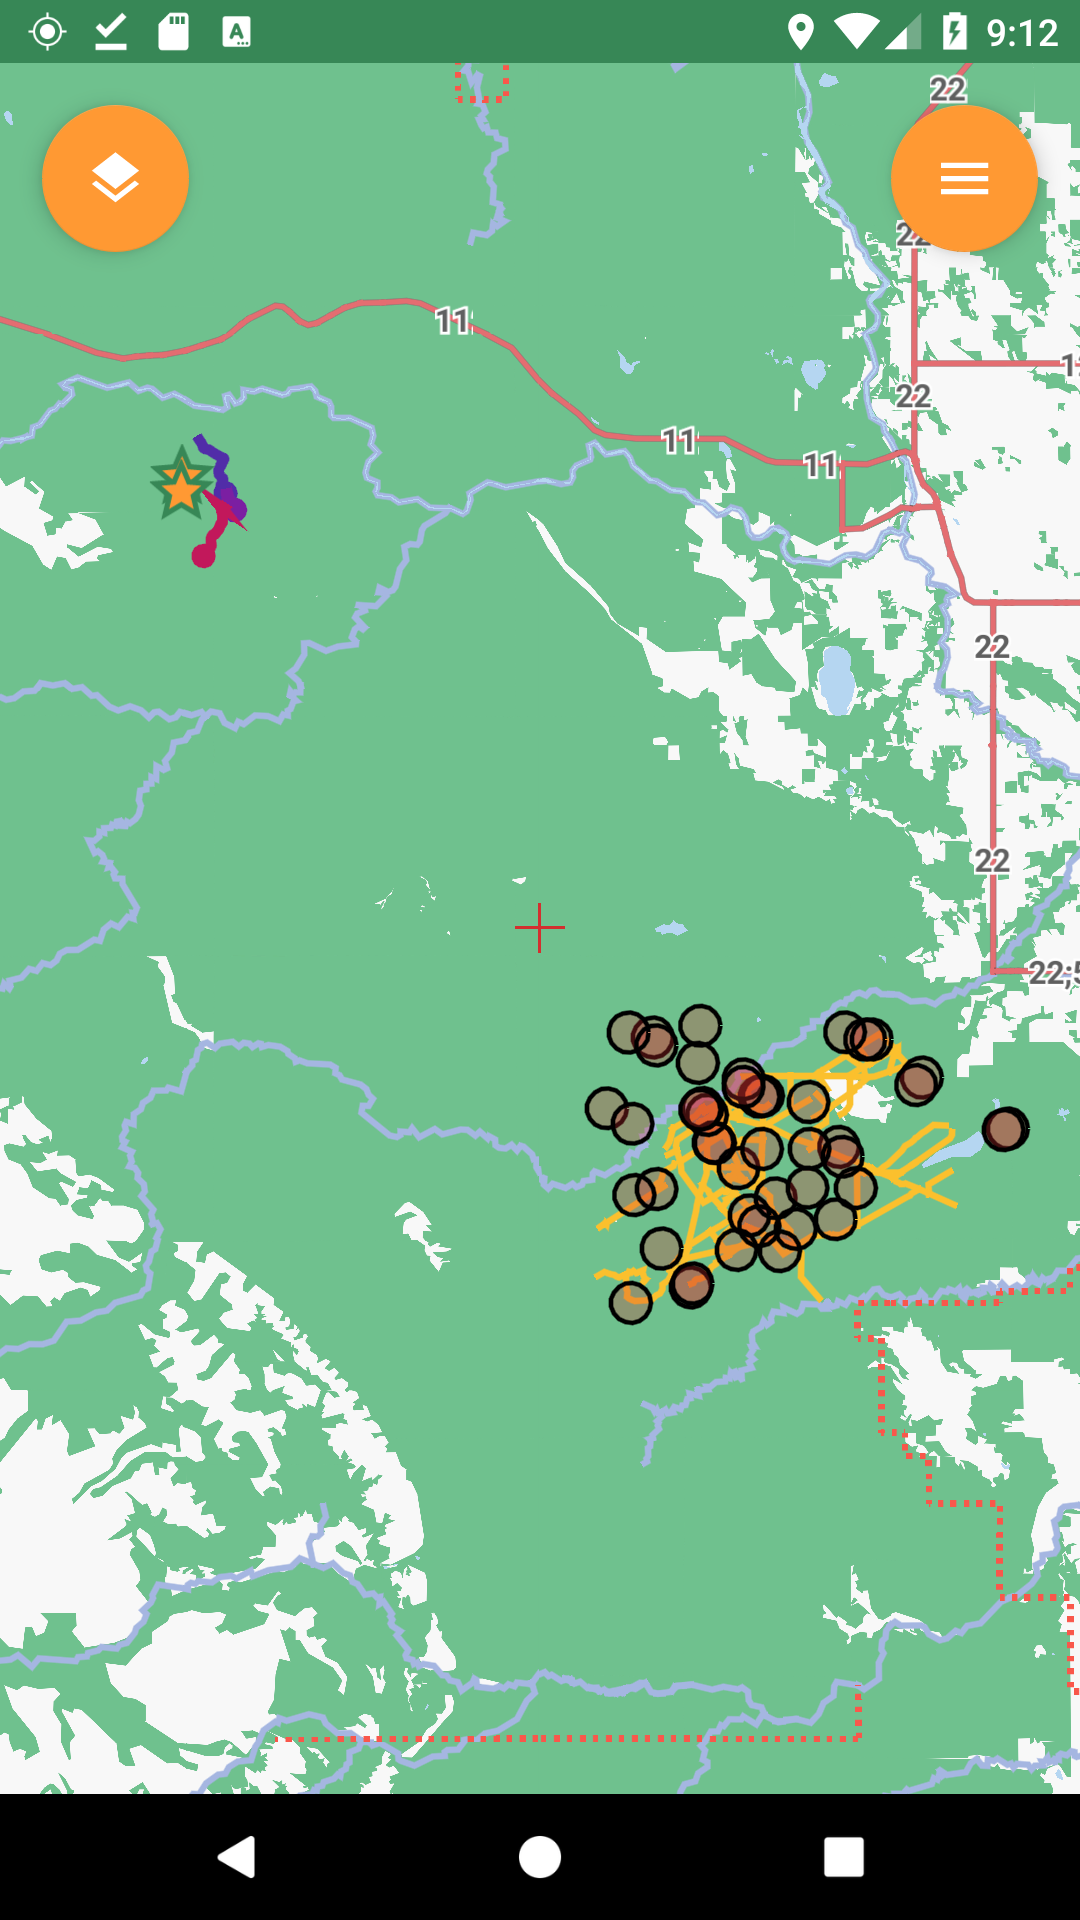
Available tools are:
-
Left screen side
-
Layers List Dialog (orange button in the upper left)
-
Add Note (the same that is accessed from the dashboard), and view the Notes List using a long press on the icon
-
Add Bookmark and view the Bookmarks List using a long press on the icon
-
GPS Log Analyzer, and view the GPS Data list using a long press on the icon
-
Measure Tool
-
-
Right screen side
-
Map Menu button (orange button in the upper right)
-
the zoom in and out buttons
-
-
Lower center
-
battery status indicator
-
GPS Position button, and GPS Options using a long press on the icon
-
View Feature Info/Edit Layer button
-
6.2. Map navigation
The navigation of the map is probably the most basic and important part.
-
pan: panning of the map, i.e. moving the map around is simply done by dragging the map with a finger. While panning, the current longitude and latitude of the map center are displayed.
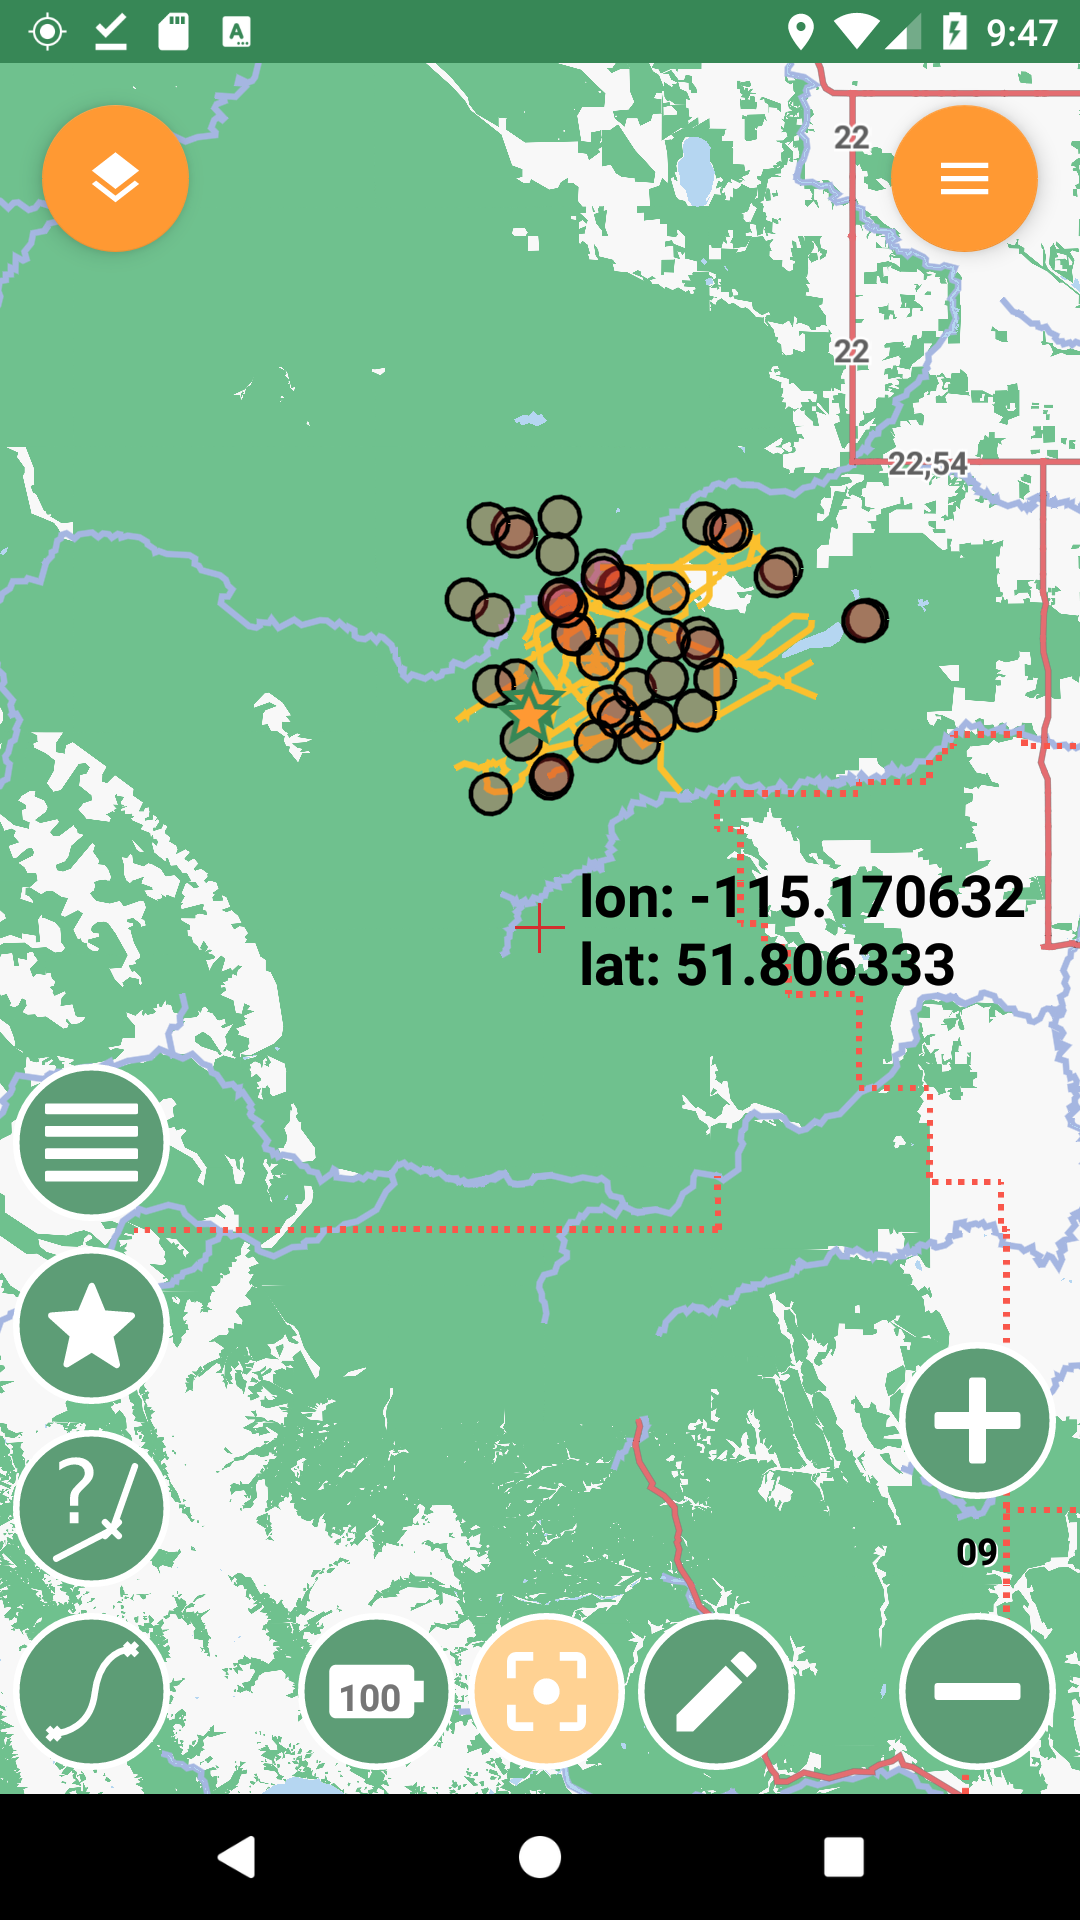
-
zoom: zoom in and out can be done in different ways. There are the zoom in/out buttons at the lower right part of the map. It is also possible to zoom in by double-tapping on the map. Zoom in and out can also be achived through pinch-zoom gestures.
| If you have trouble reading small text on some basemaps, you can "magnify" the map display by doing a long press on the "zoom in" button. You can magnify multiple times if needed. Don’t forget to demagnify (long press on the "zoom out" button) before you do other Map View operations such as measure or feature ID. |
-
center on GPS: through the lower center button it is possible to center the map on the GPS position. The button also shows the status of the GPS the same way as the icon on the main view’s action bar.
6.3. Add Notes
The Add Notes button opens the same notes view as the button on the dashboard. For further information about taking notes, visit the notes section.
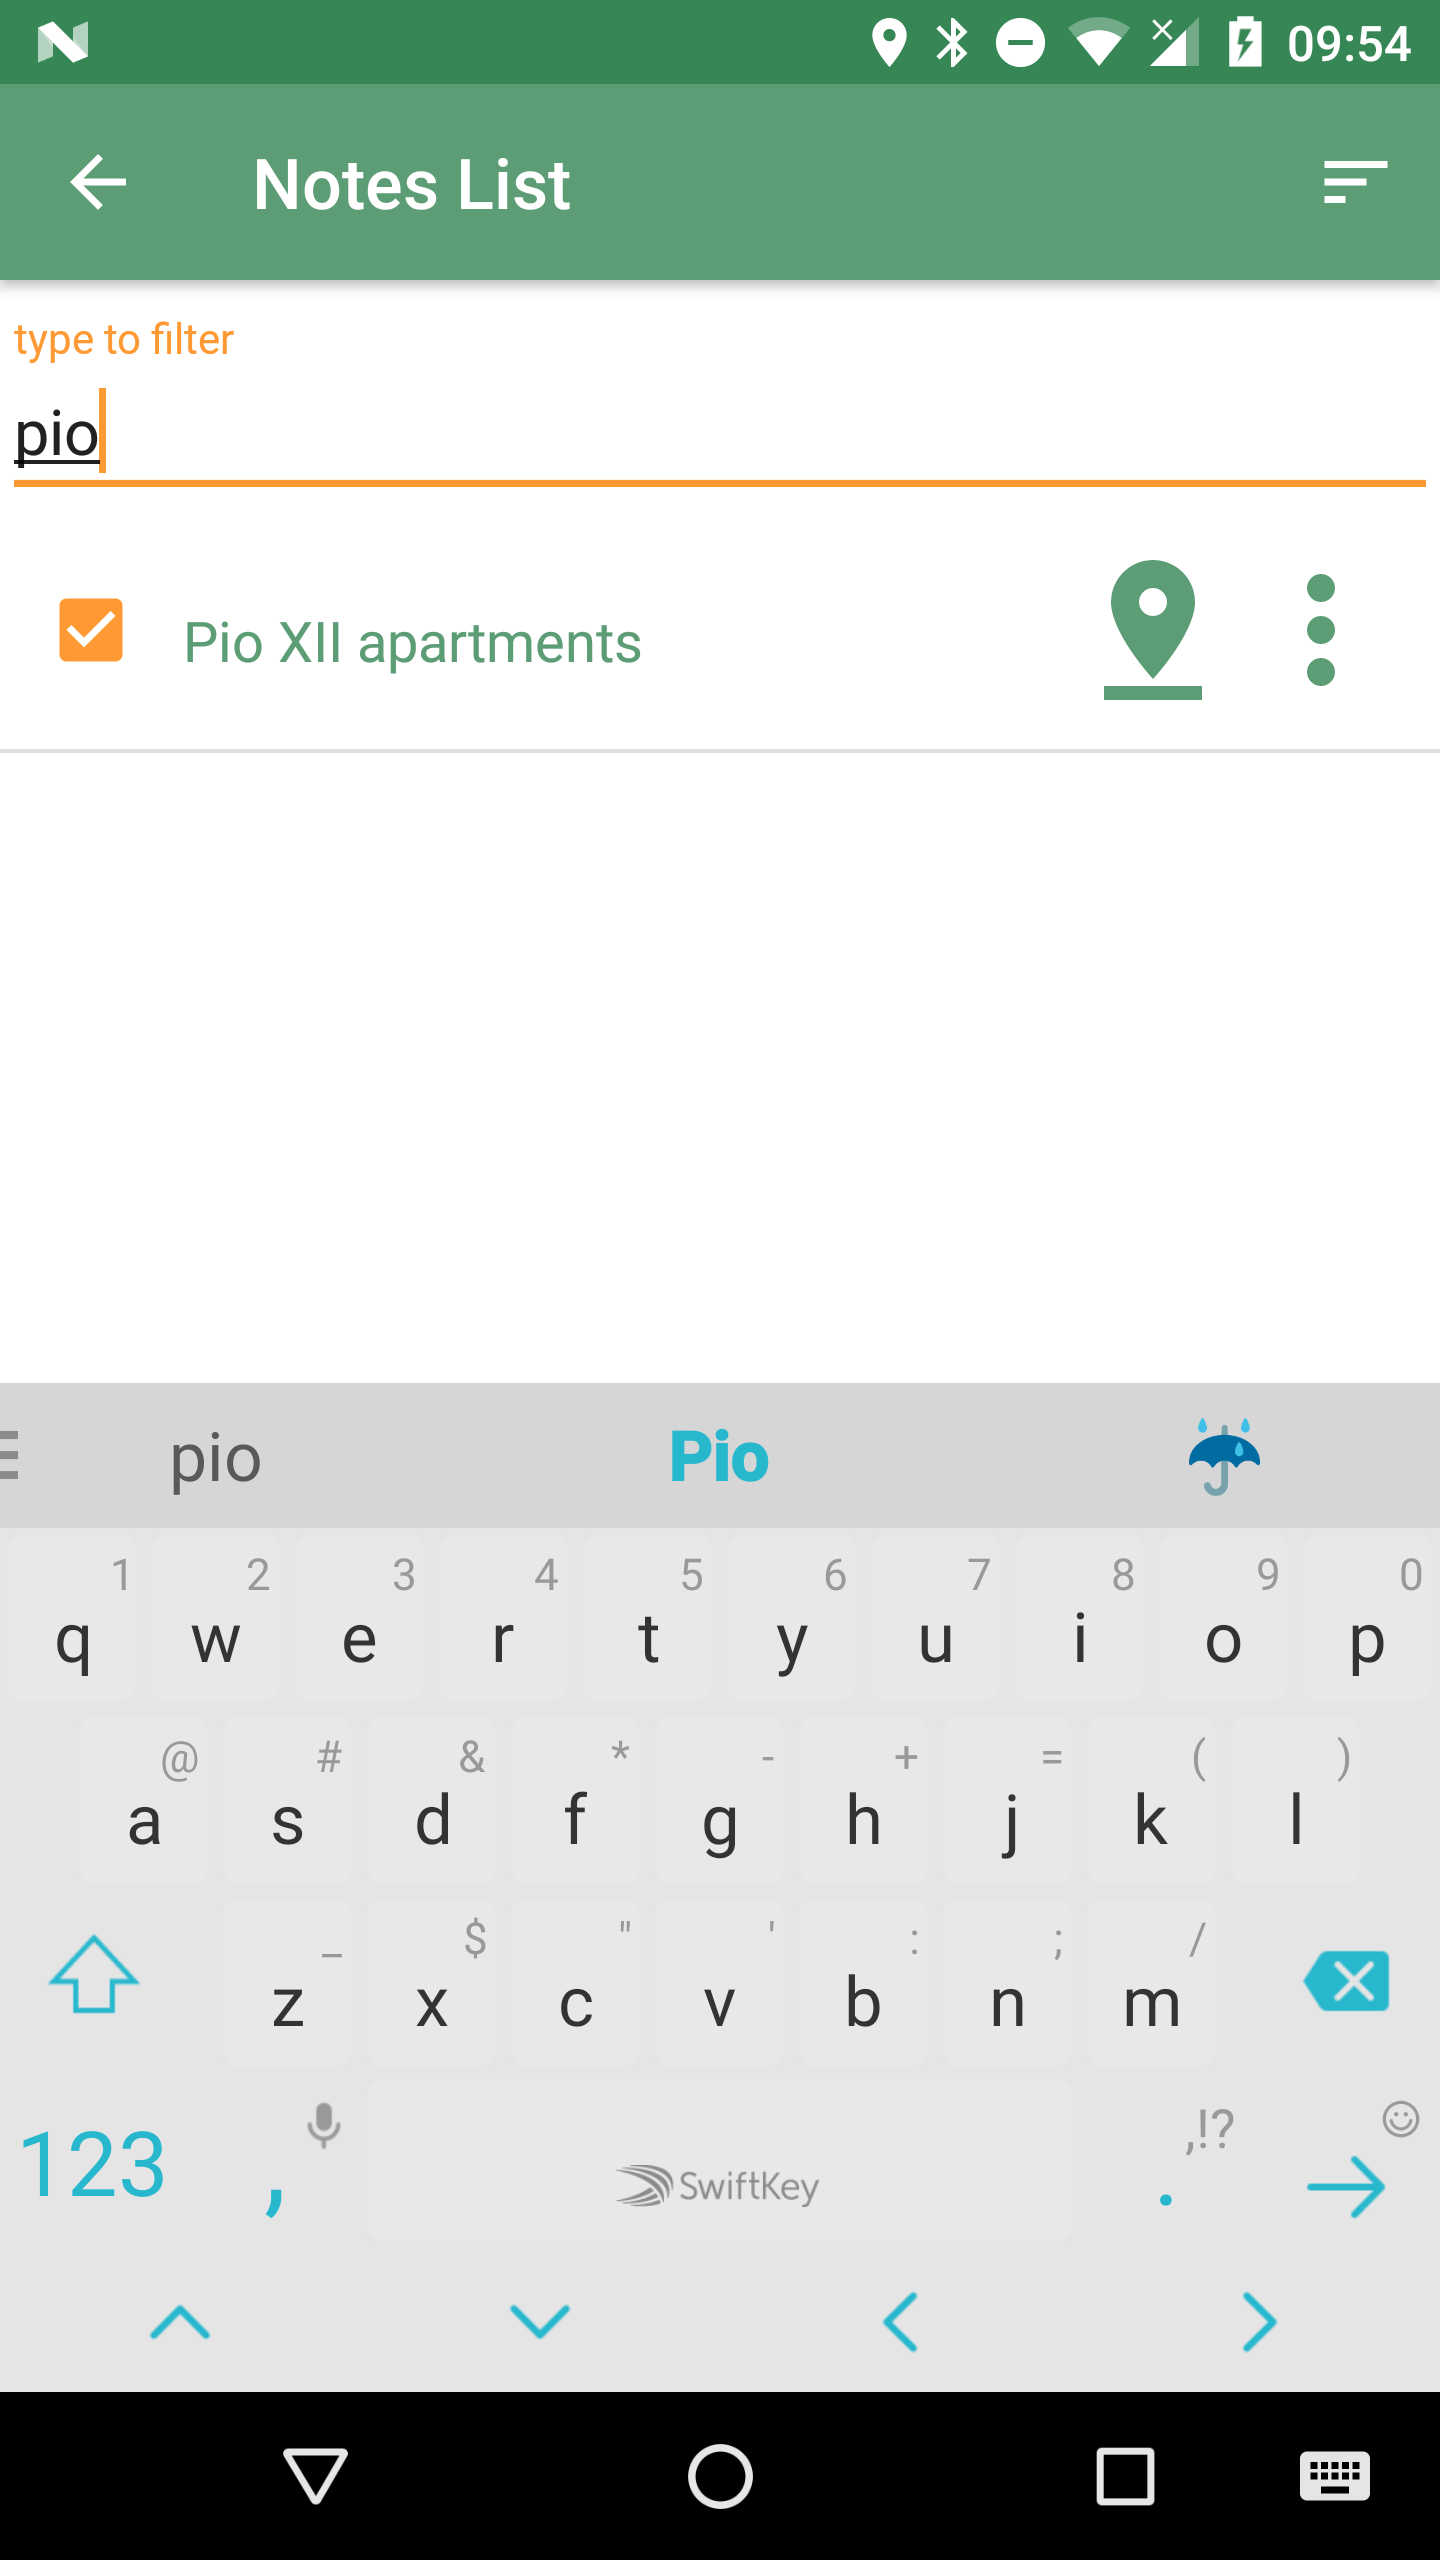
6.4. The Notes List
A long press on the Notes icon will show the Notes List. The notes list shows all the available notes, both text and image notes.

The icon on the right side of the actionbar allows the user to sort the notes by different modes:
-
None: insertion order
-
By Name and inverse: sorts the notes by their name
-
By Map center distance and inverse: sorts the notes by the distance from the current map center position
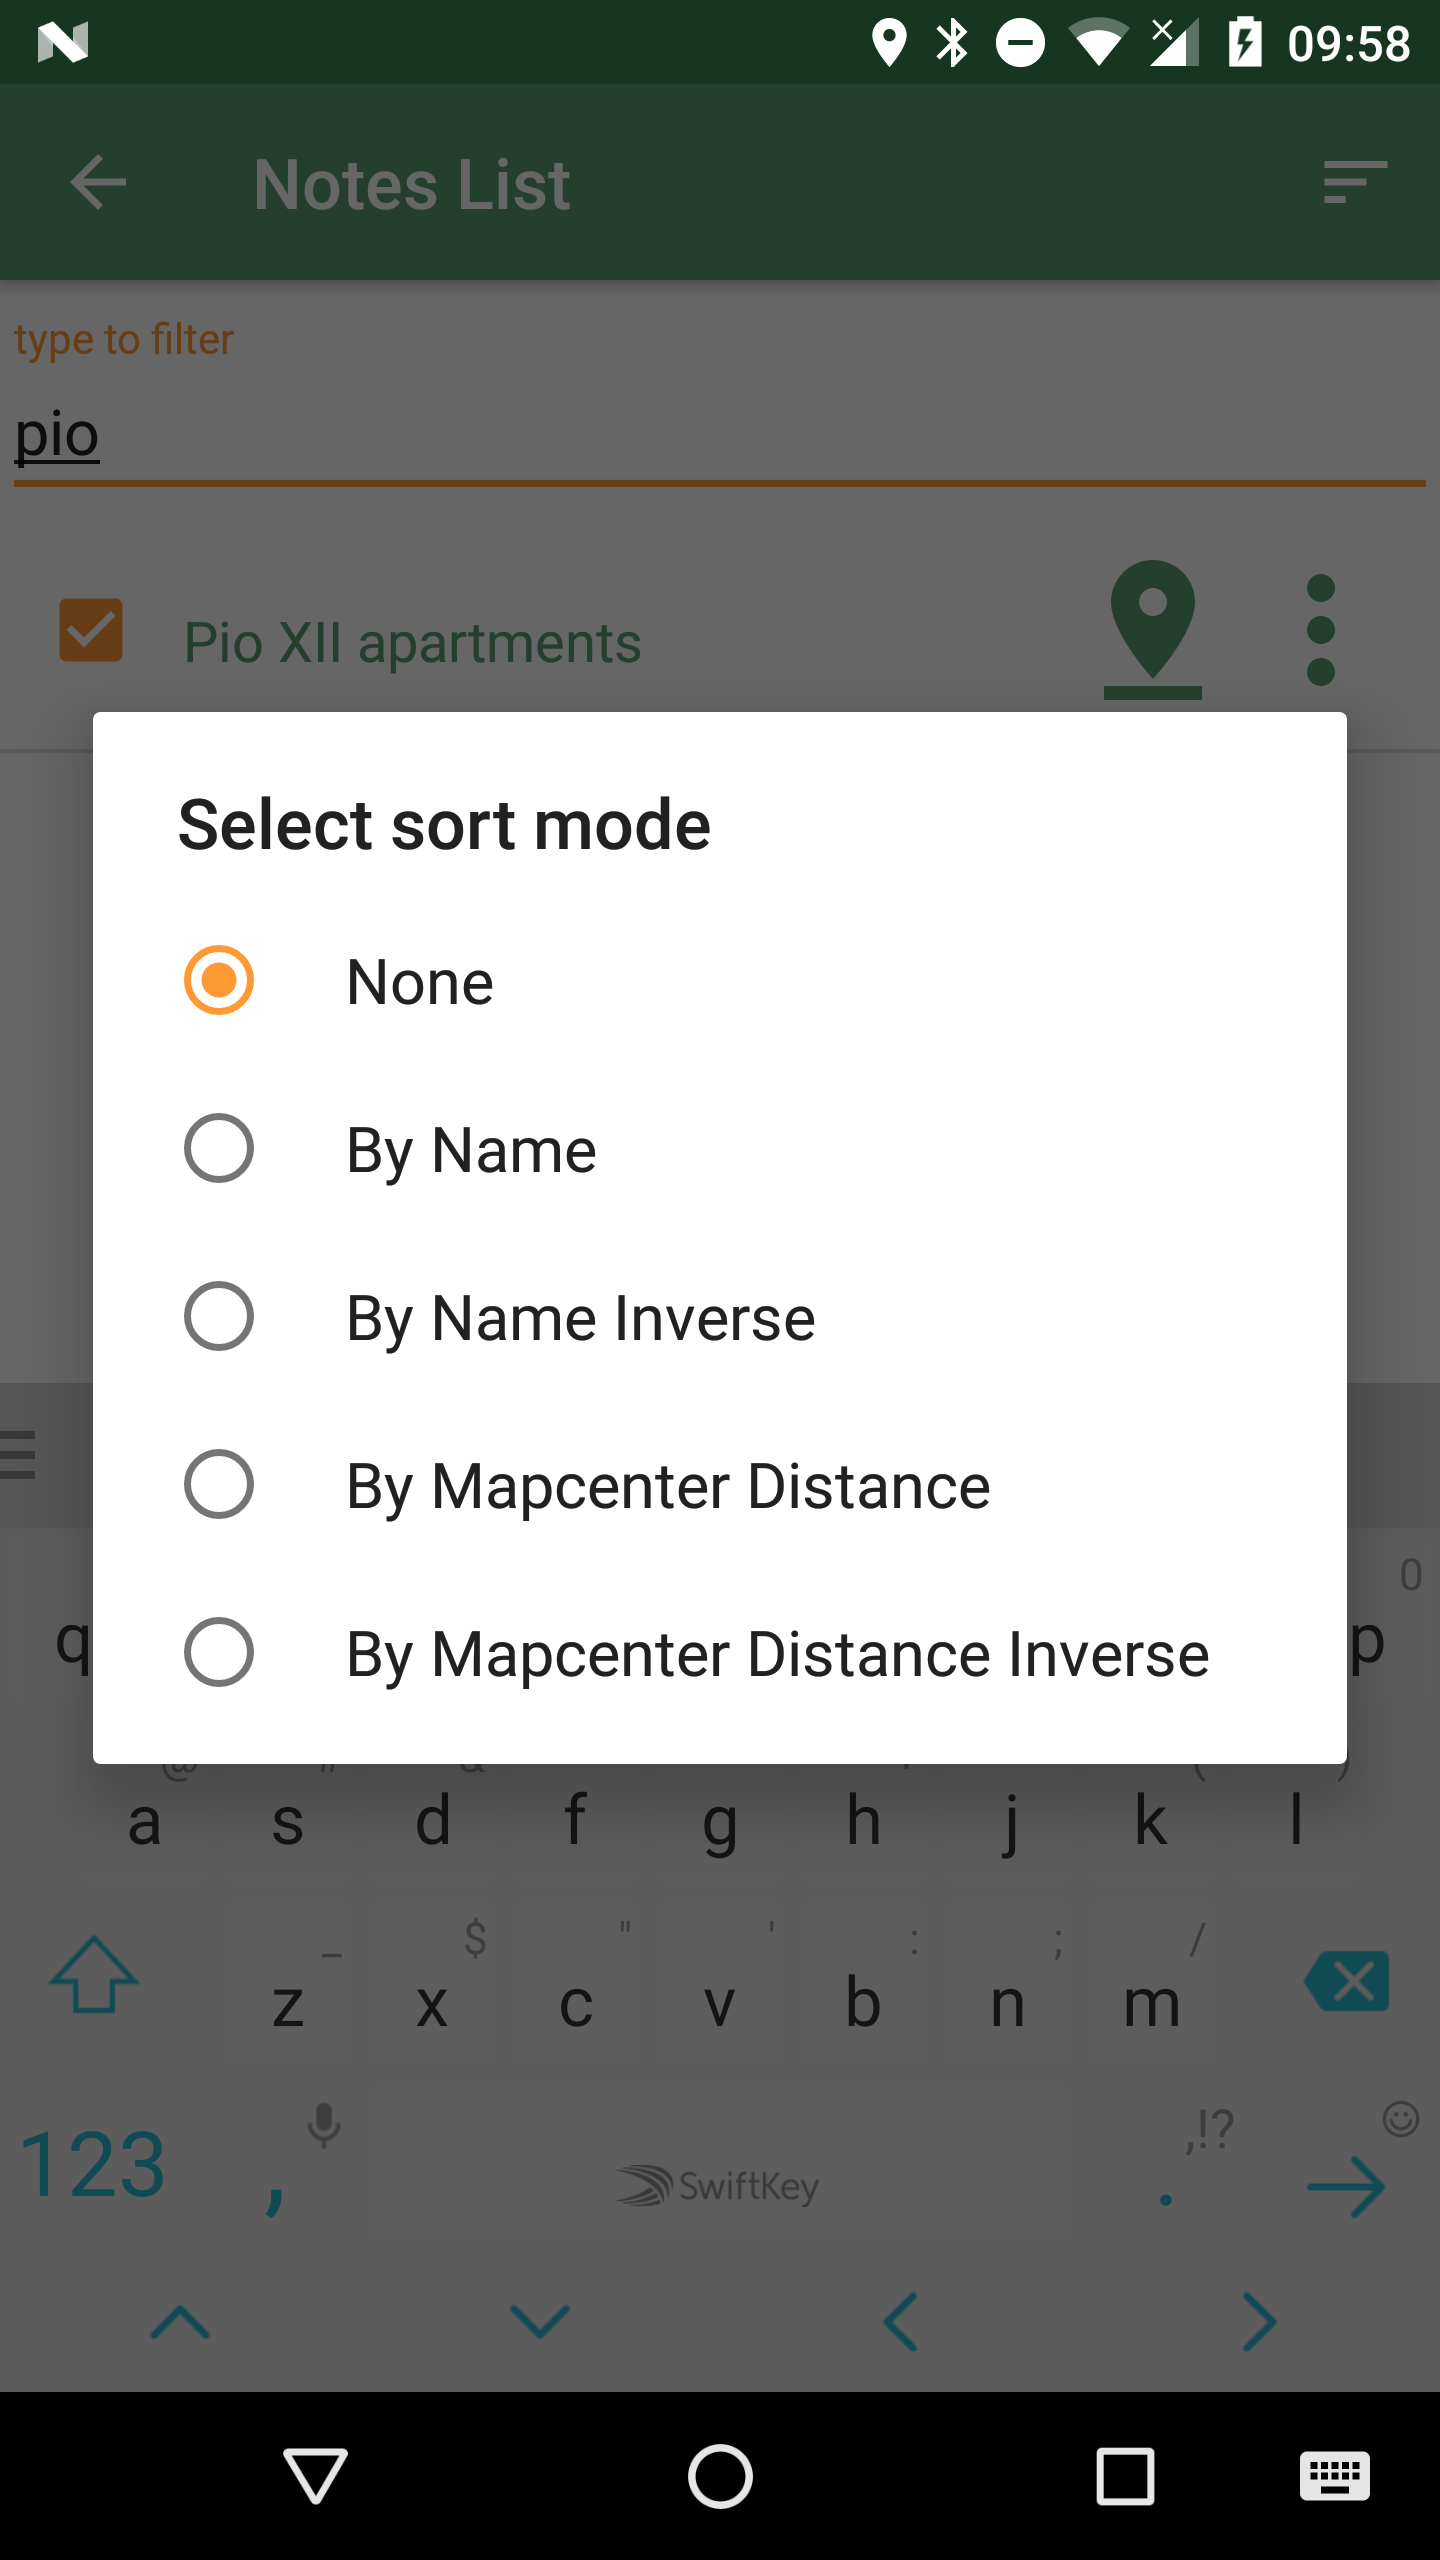
In the upper part of the view there is a textbox that helps to filter particular notes based on name.
At the right side of the list two icons are available. The left one positions the map on the selected note’s position while the right one opens a menu:
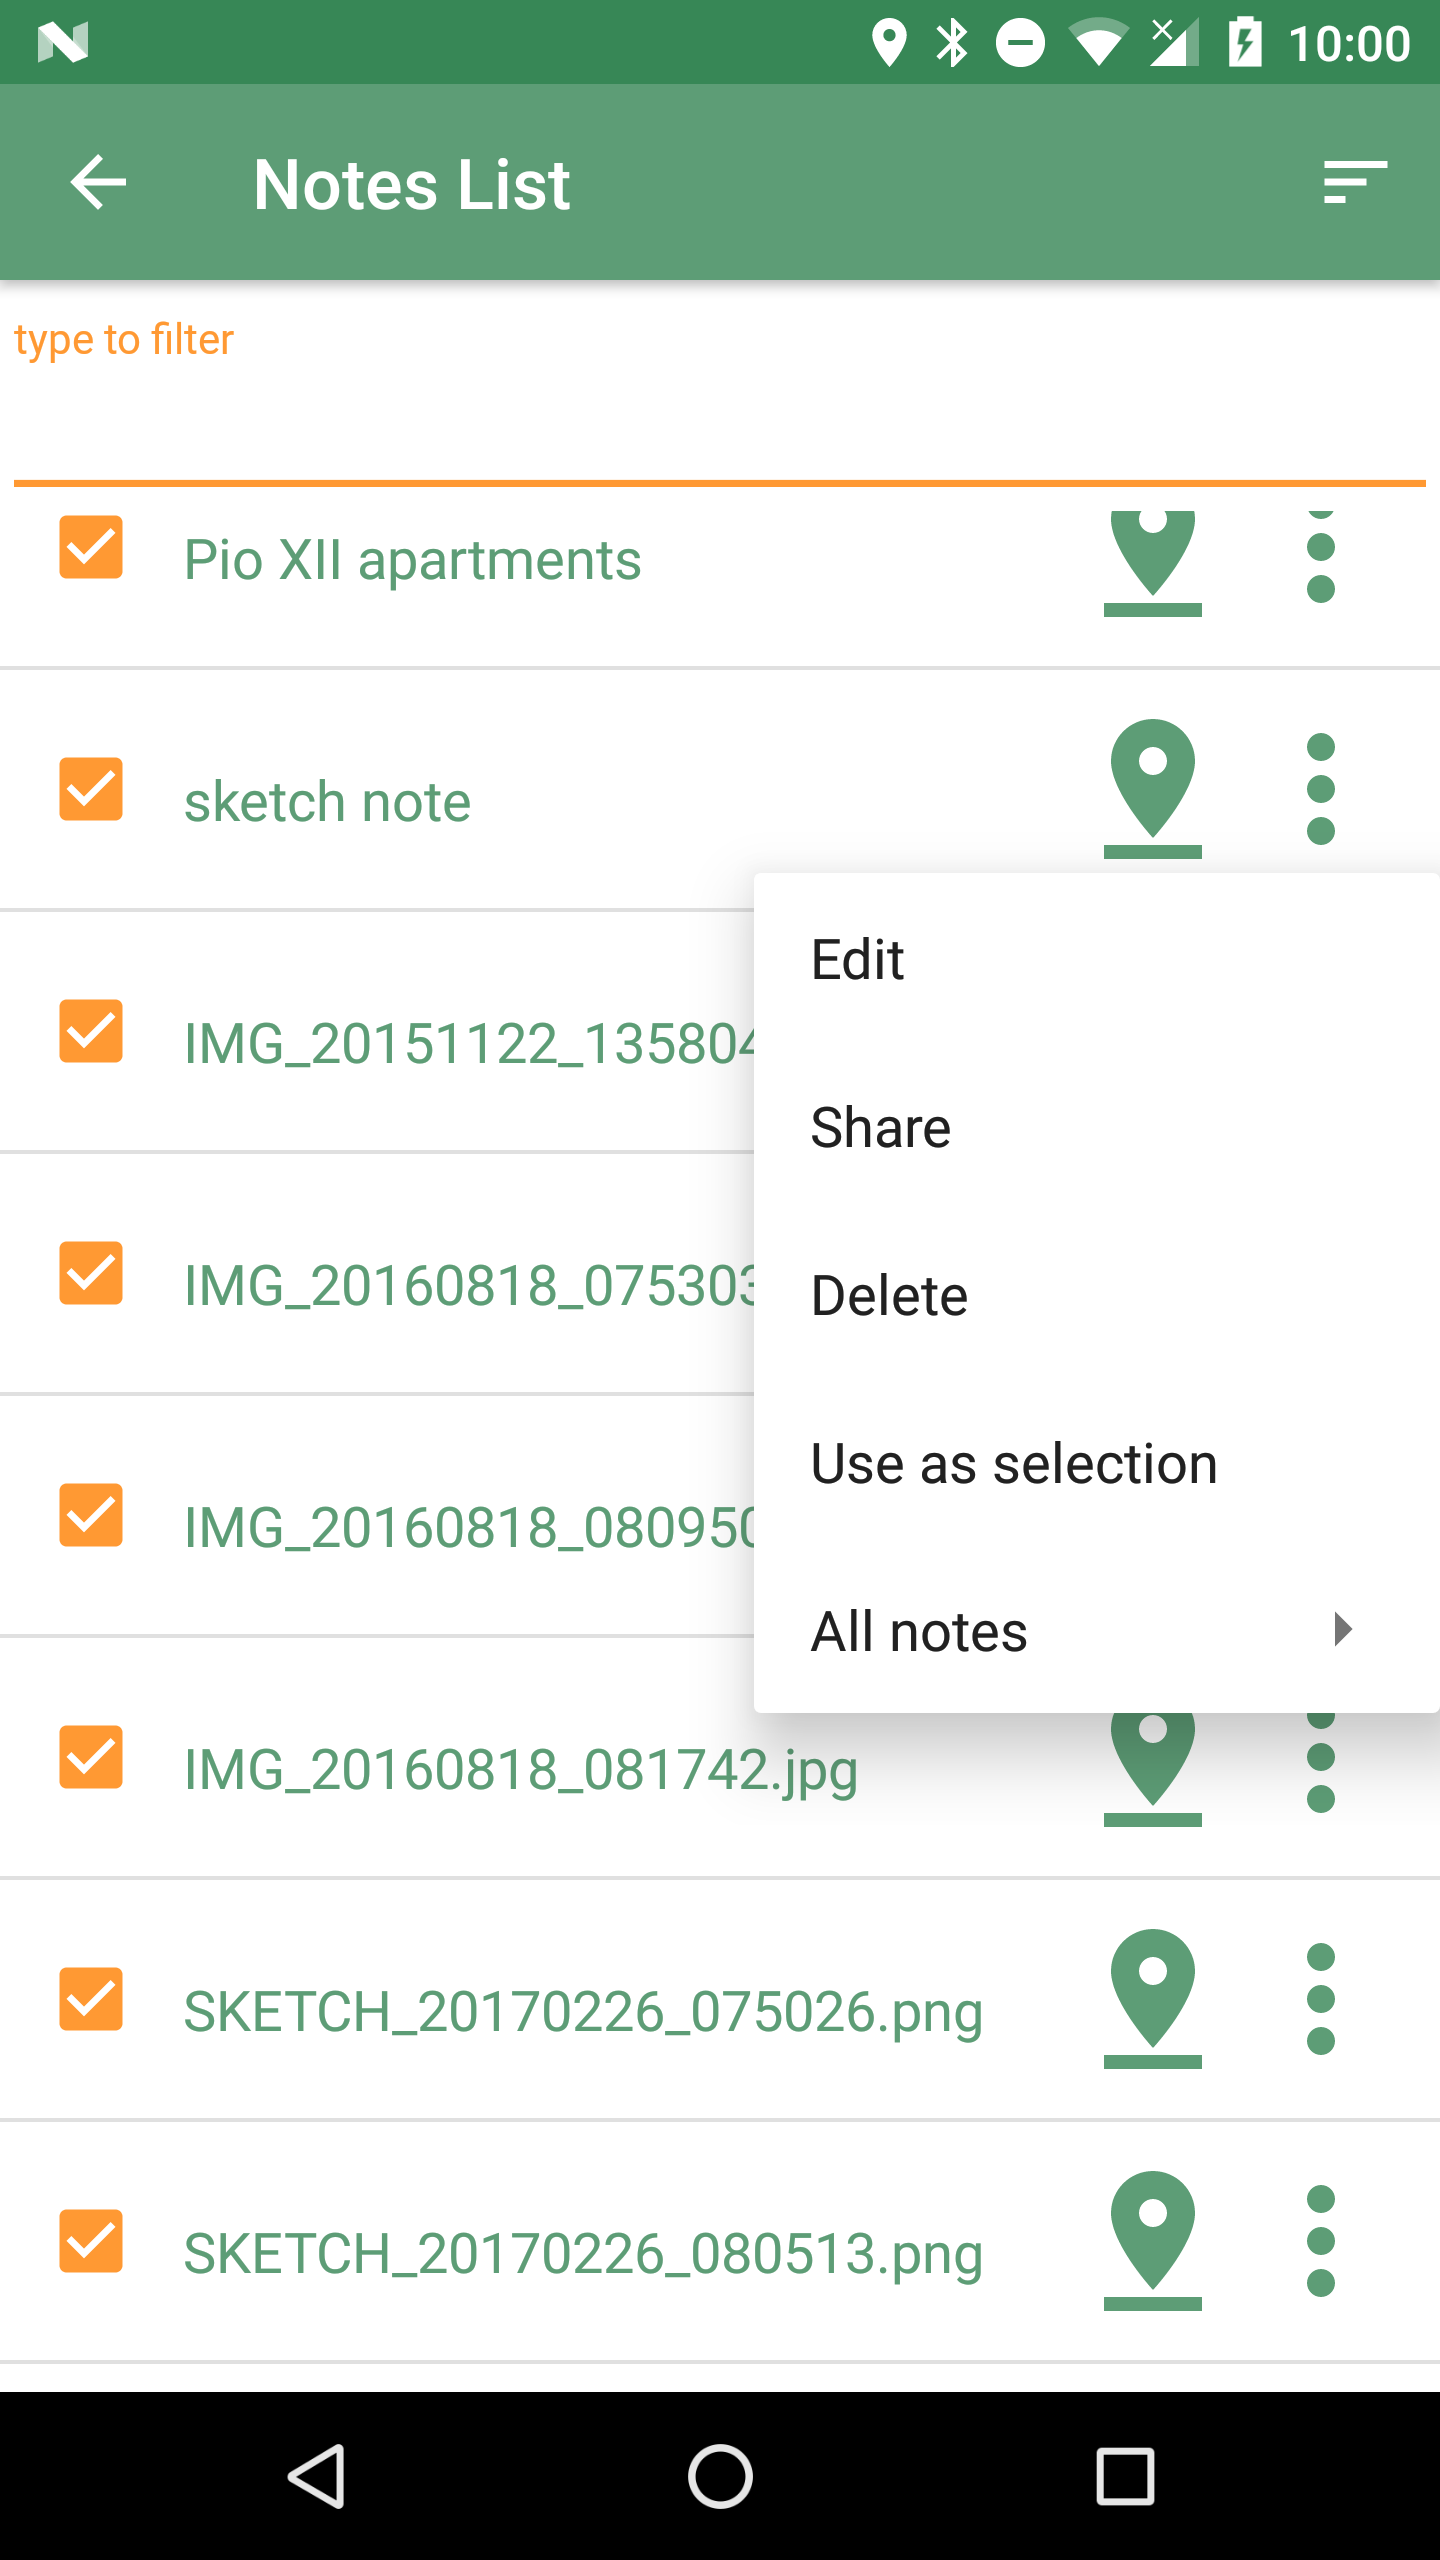
From the note menu the user is able to:
-
edit notes
-
share the note through social networks
-
delete the note
-
use the current note as a filter. All notes with the same name will be visible.
-
access the submenu related to all notes
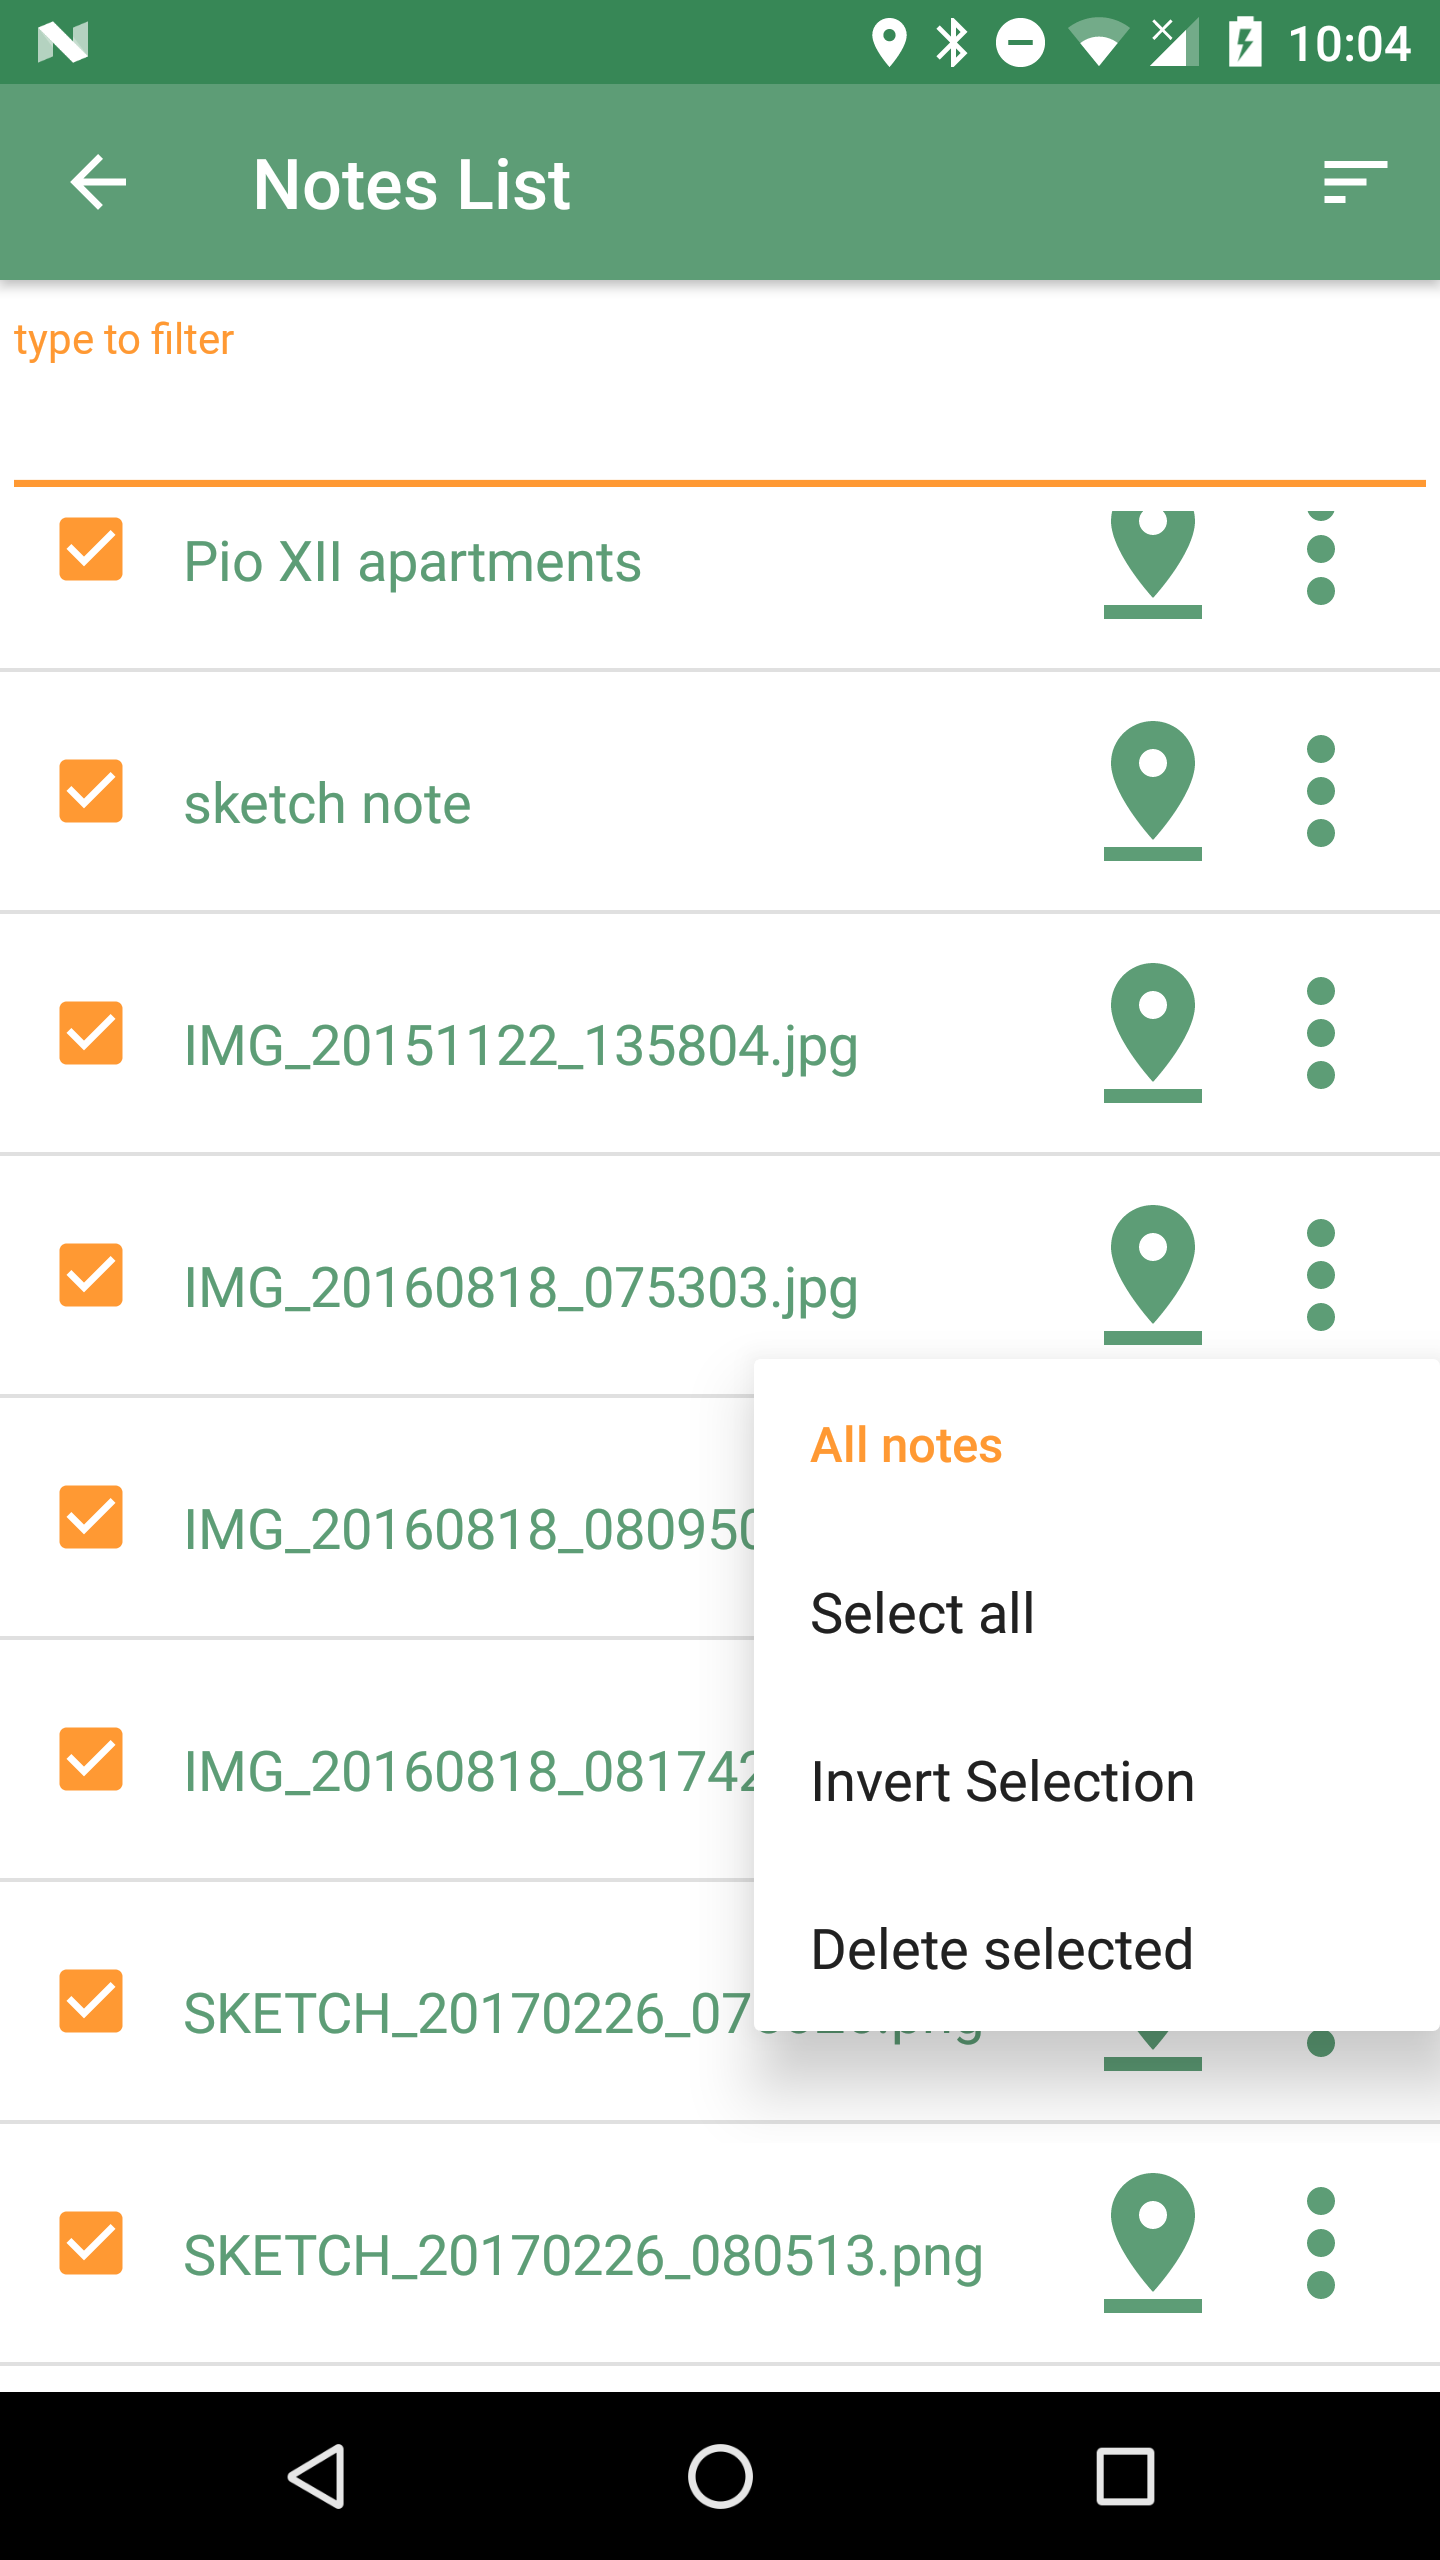
From the all-notes submenu the user can:
-
select all notes
-
invert the current selection
-
delete the selected notes
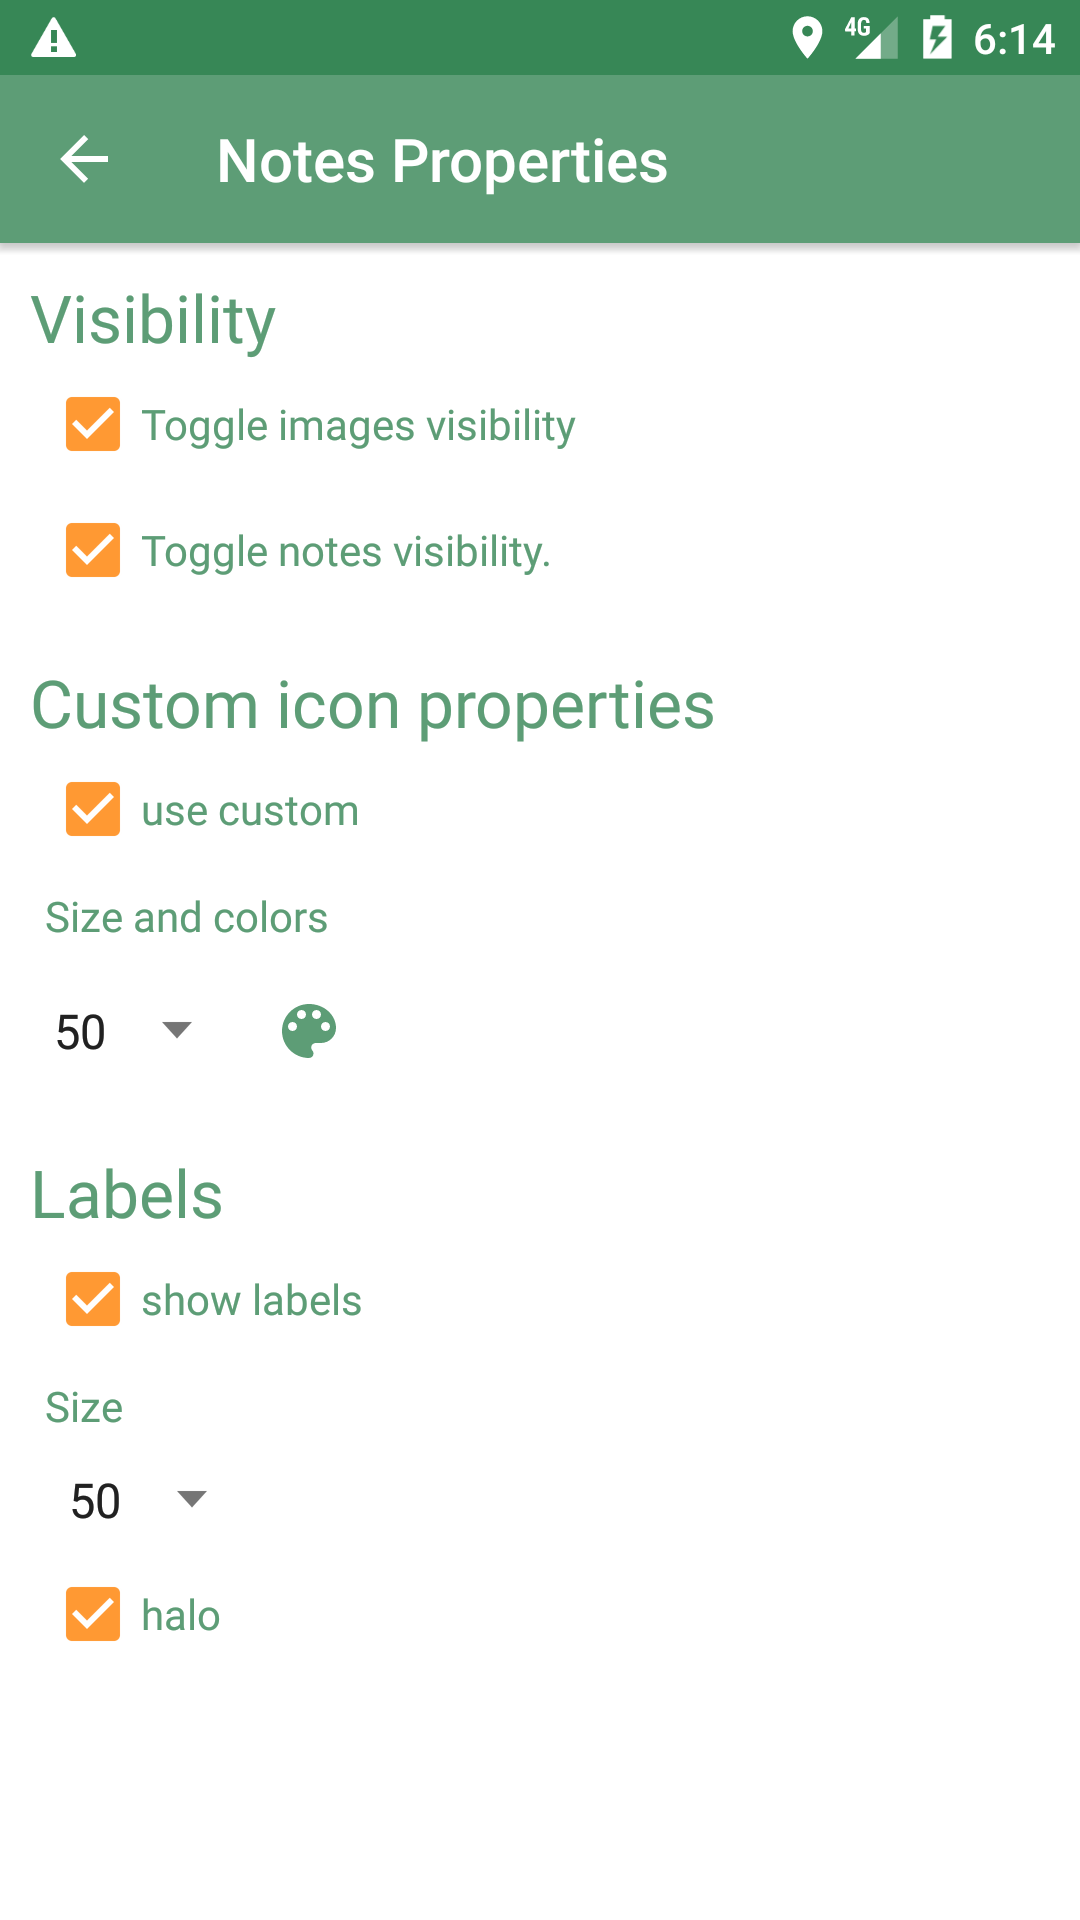
The pallet icon on the Notes List view allows you to change the graphic properties of the notes.
6.5. Add Bookmark
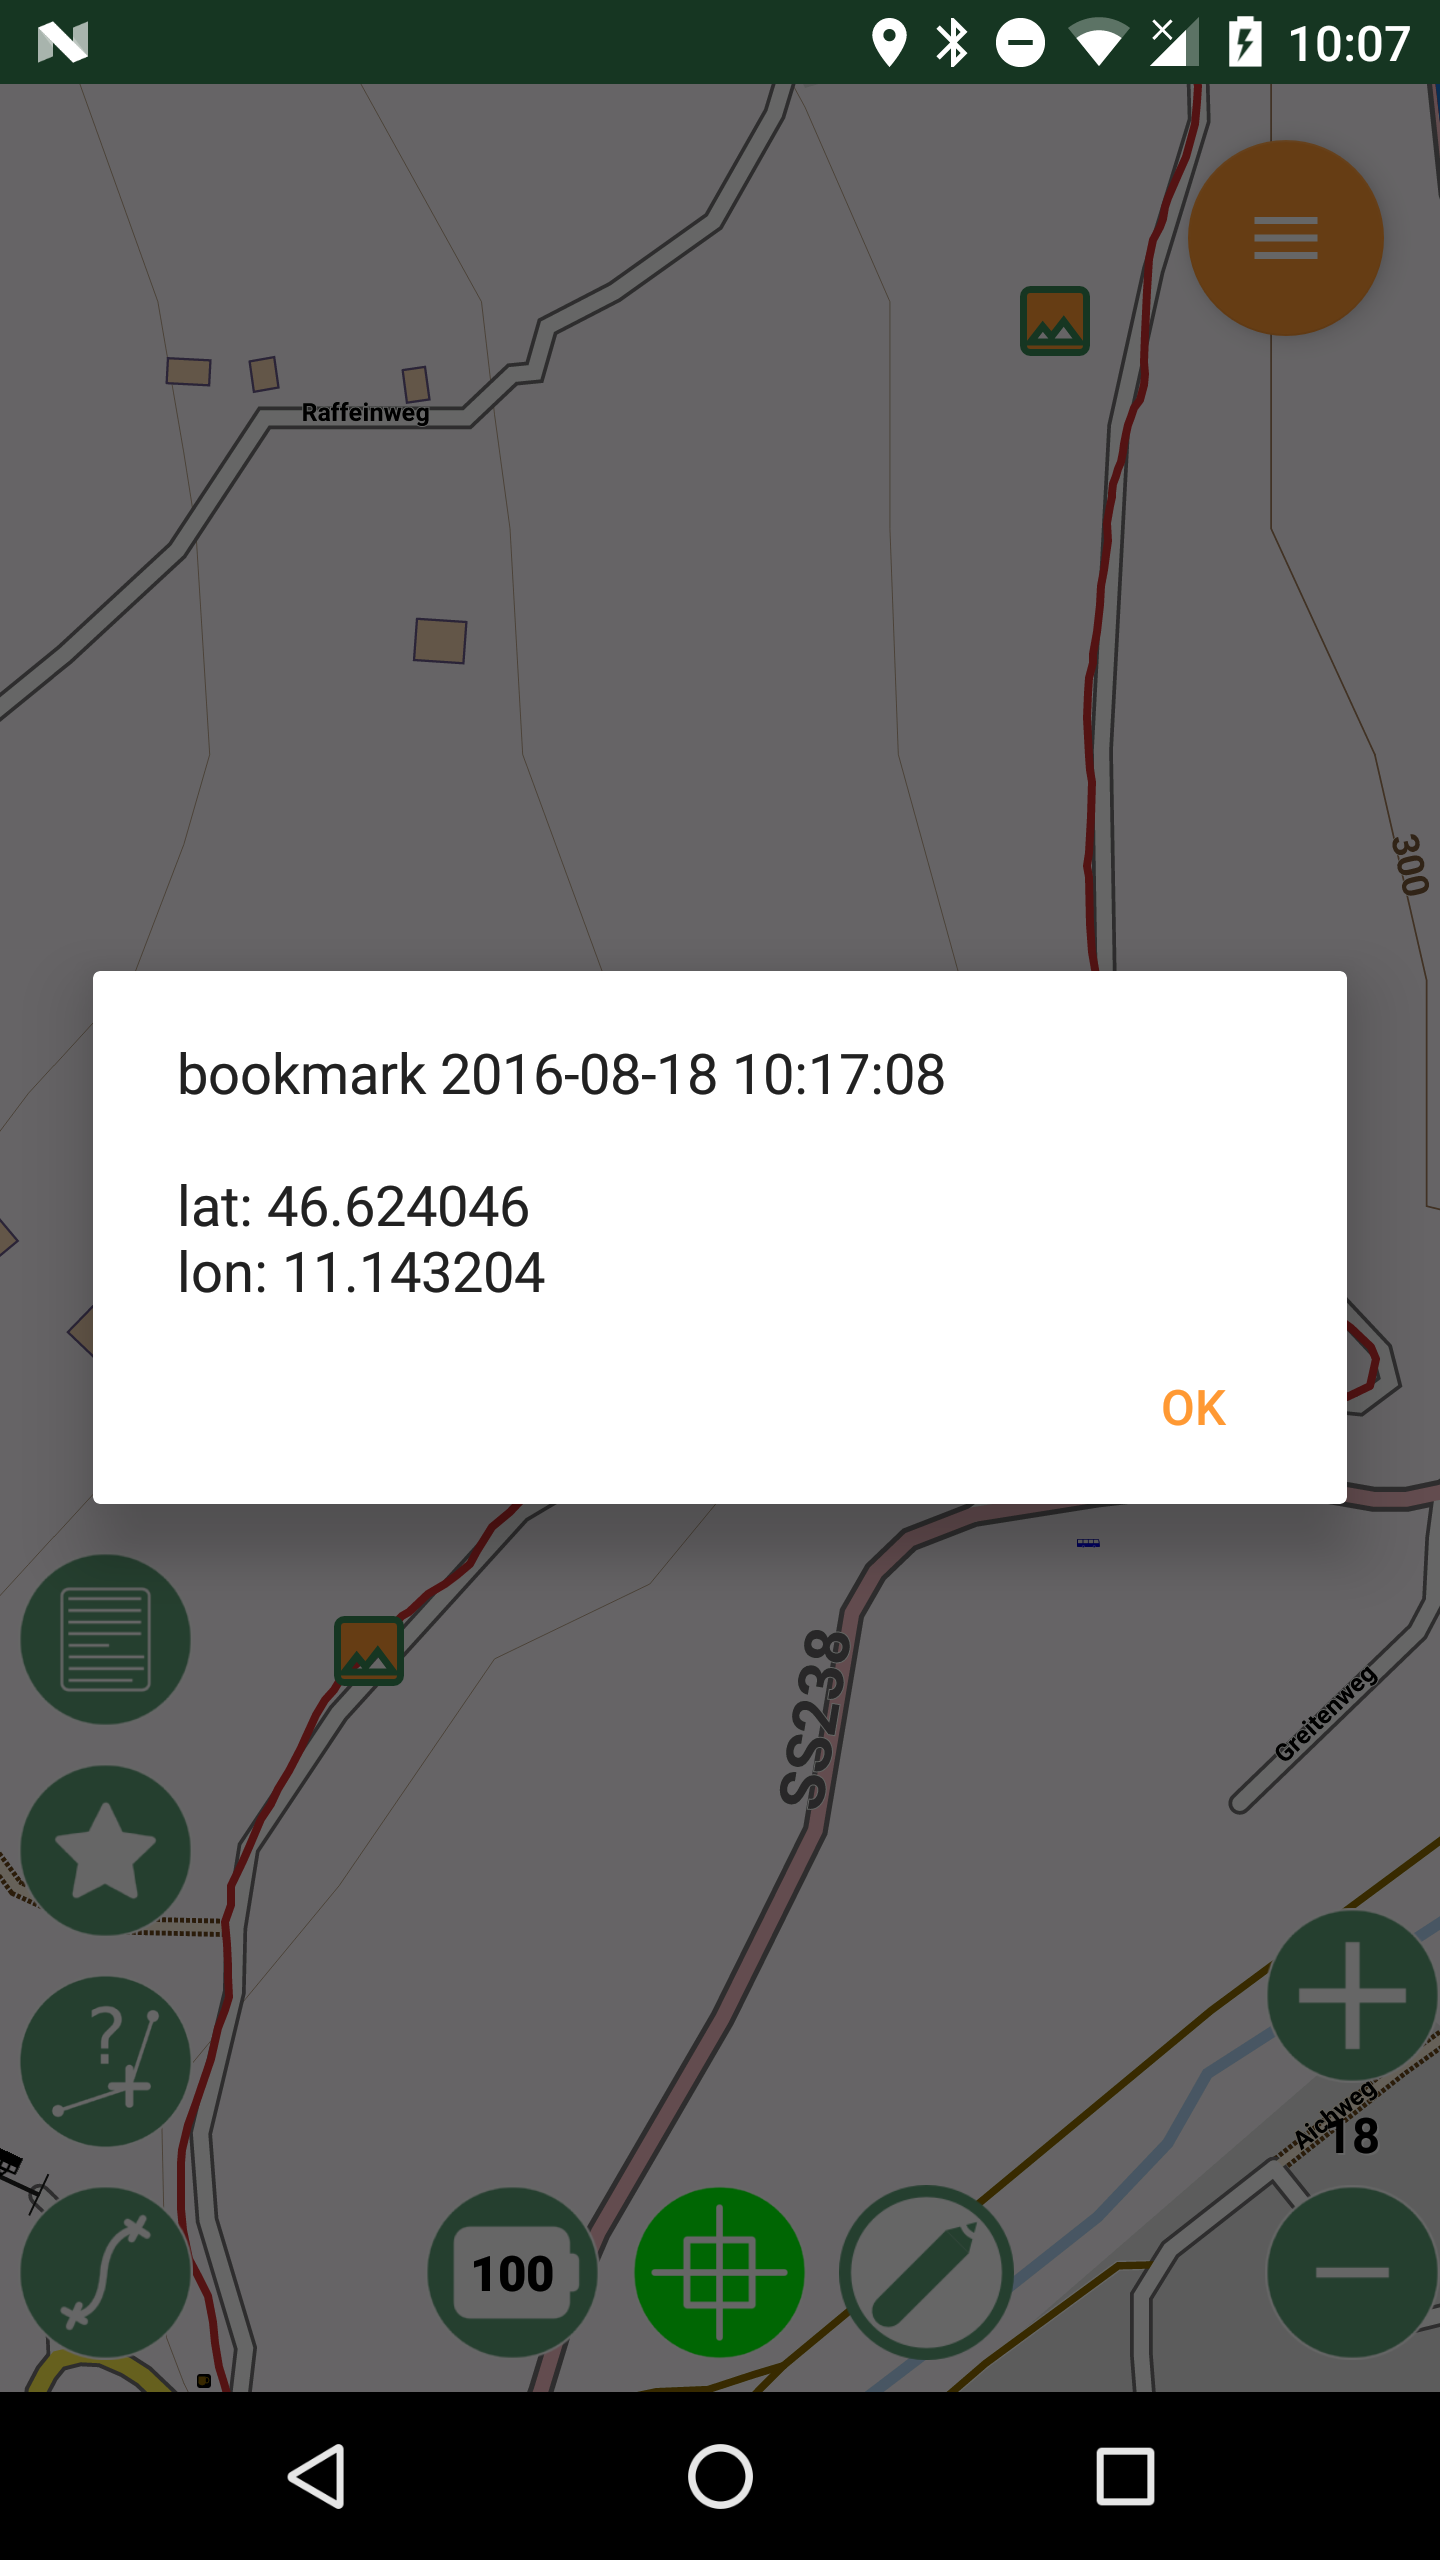
Bookmarks are in a layer on their own. They contain saved extent settings of the current map view. When a bookmark is added, the user is prompted to insert a name for the bookmark or leave the generated name based on the current time and date.
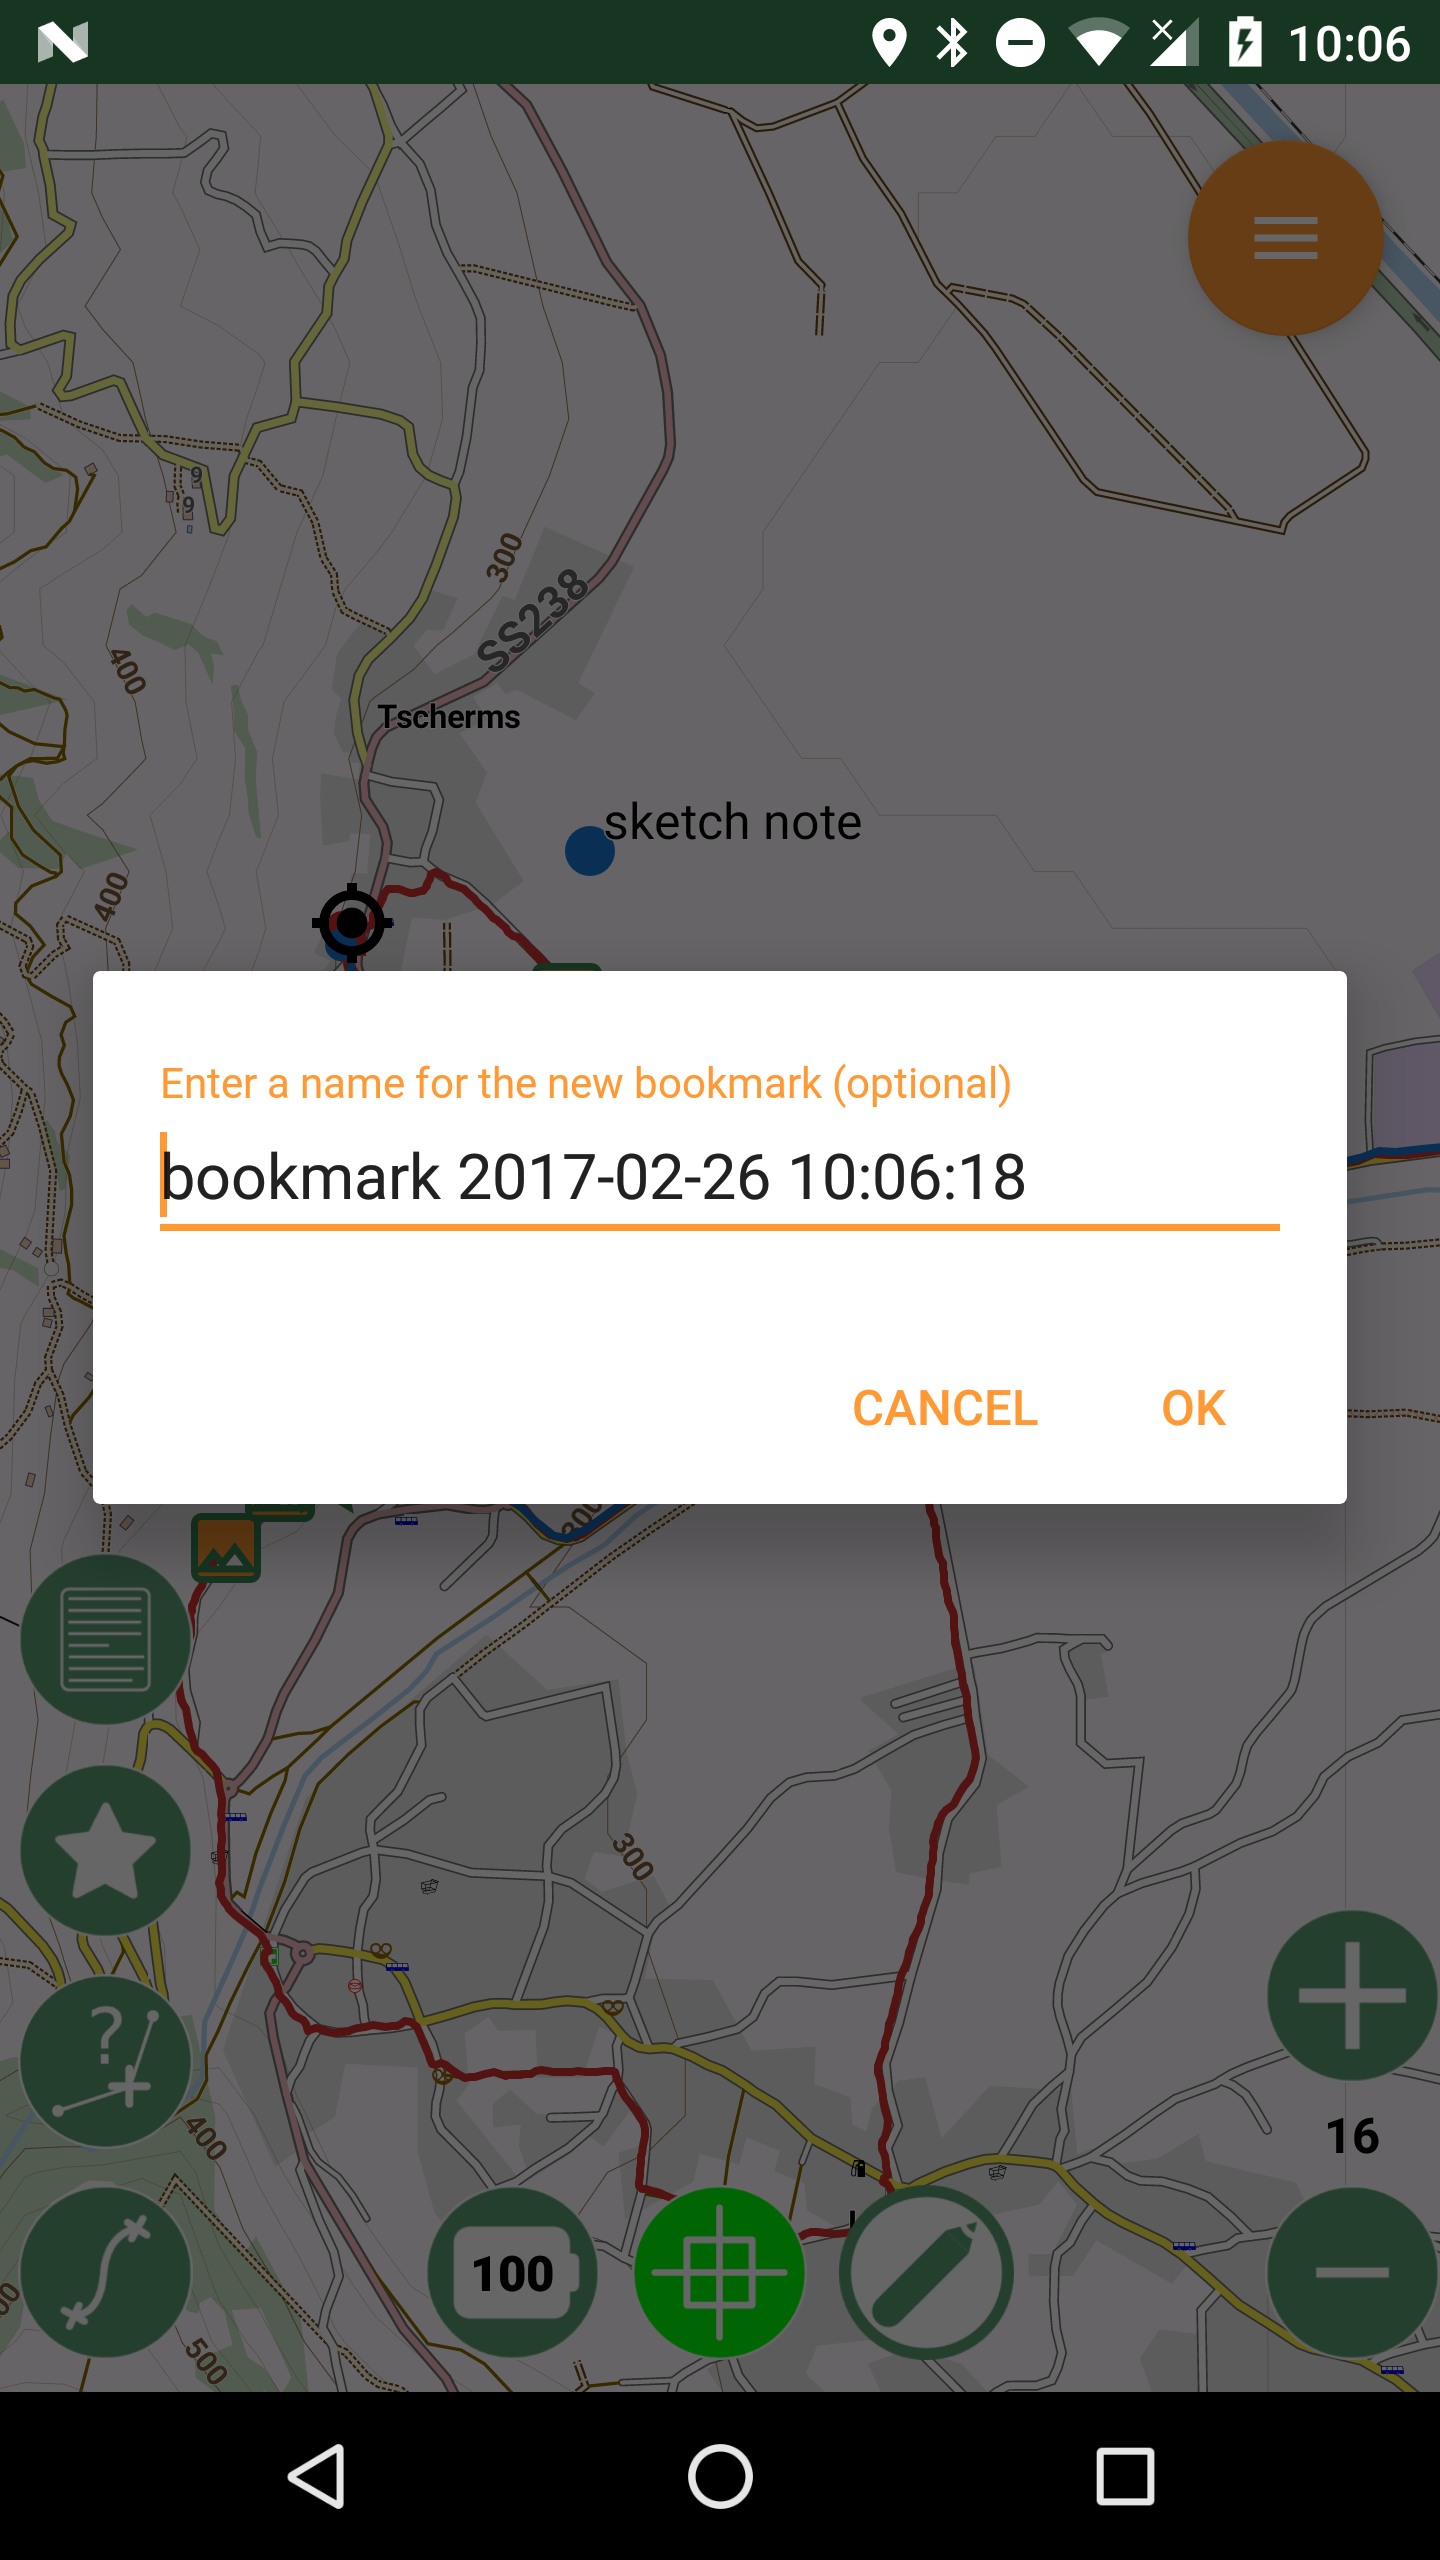
When a bookmark is added, a small star is added on the map in the center of the screen.
Since the map bounds and zoom are saved, you can return to the view that the bookmark represents in any moment.
It is possible to tap on the bookmark to read its label.
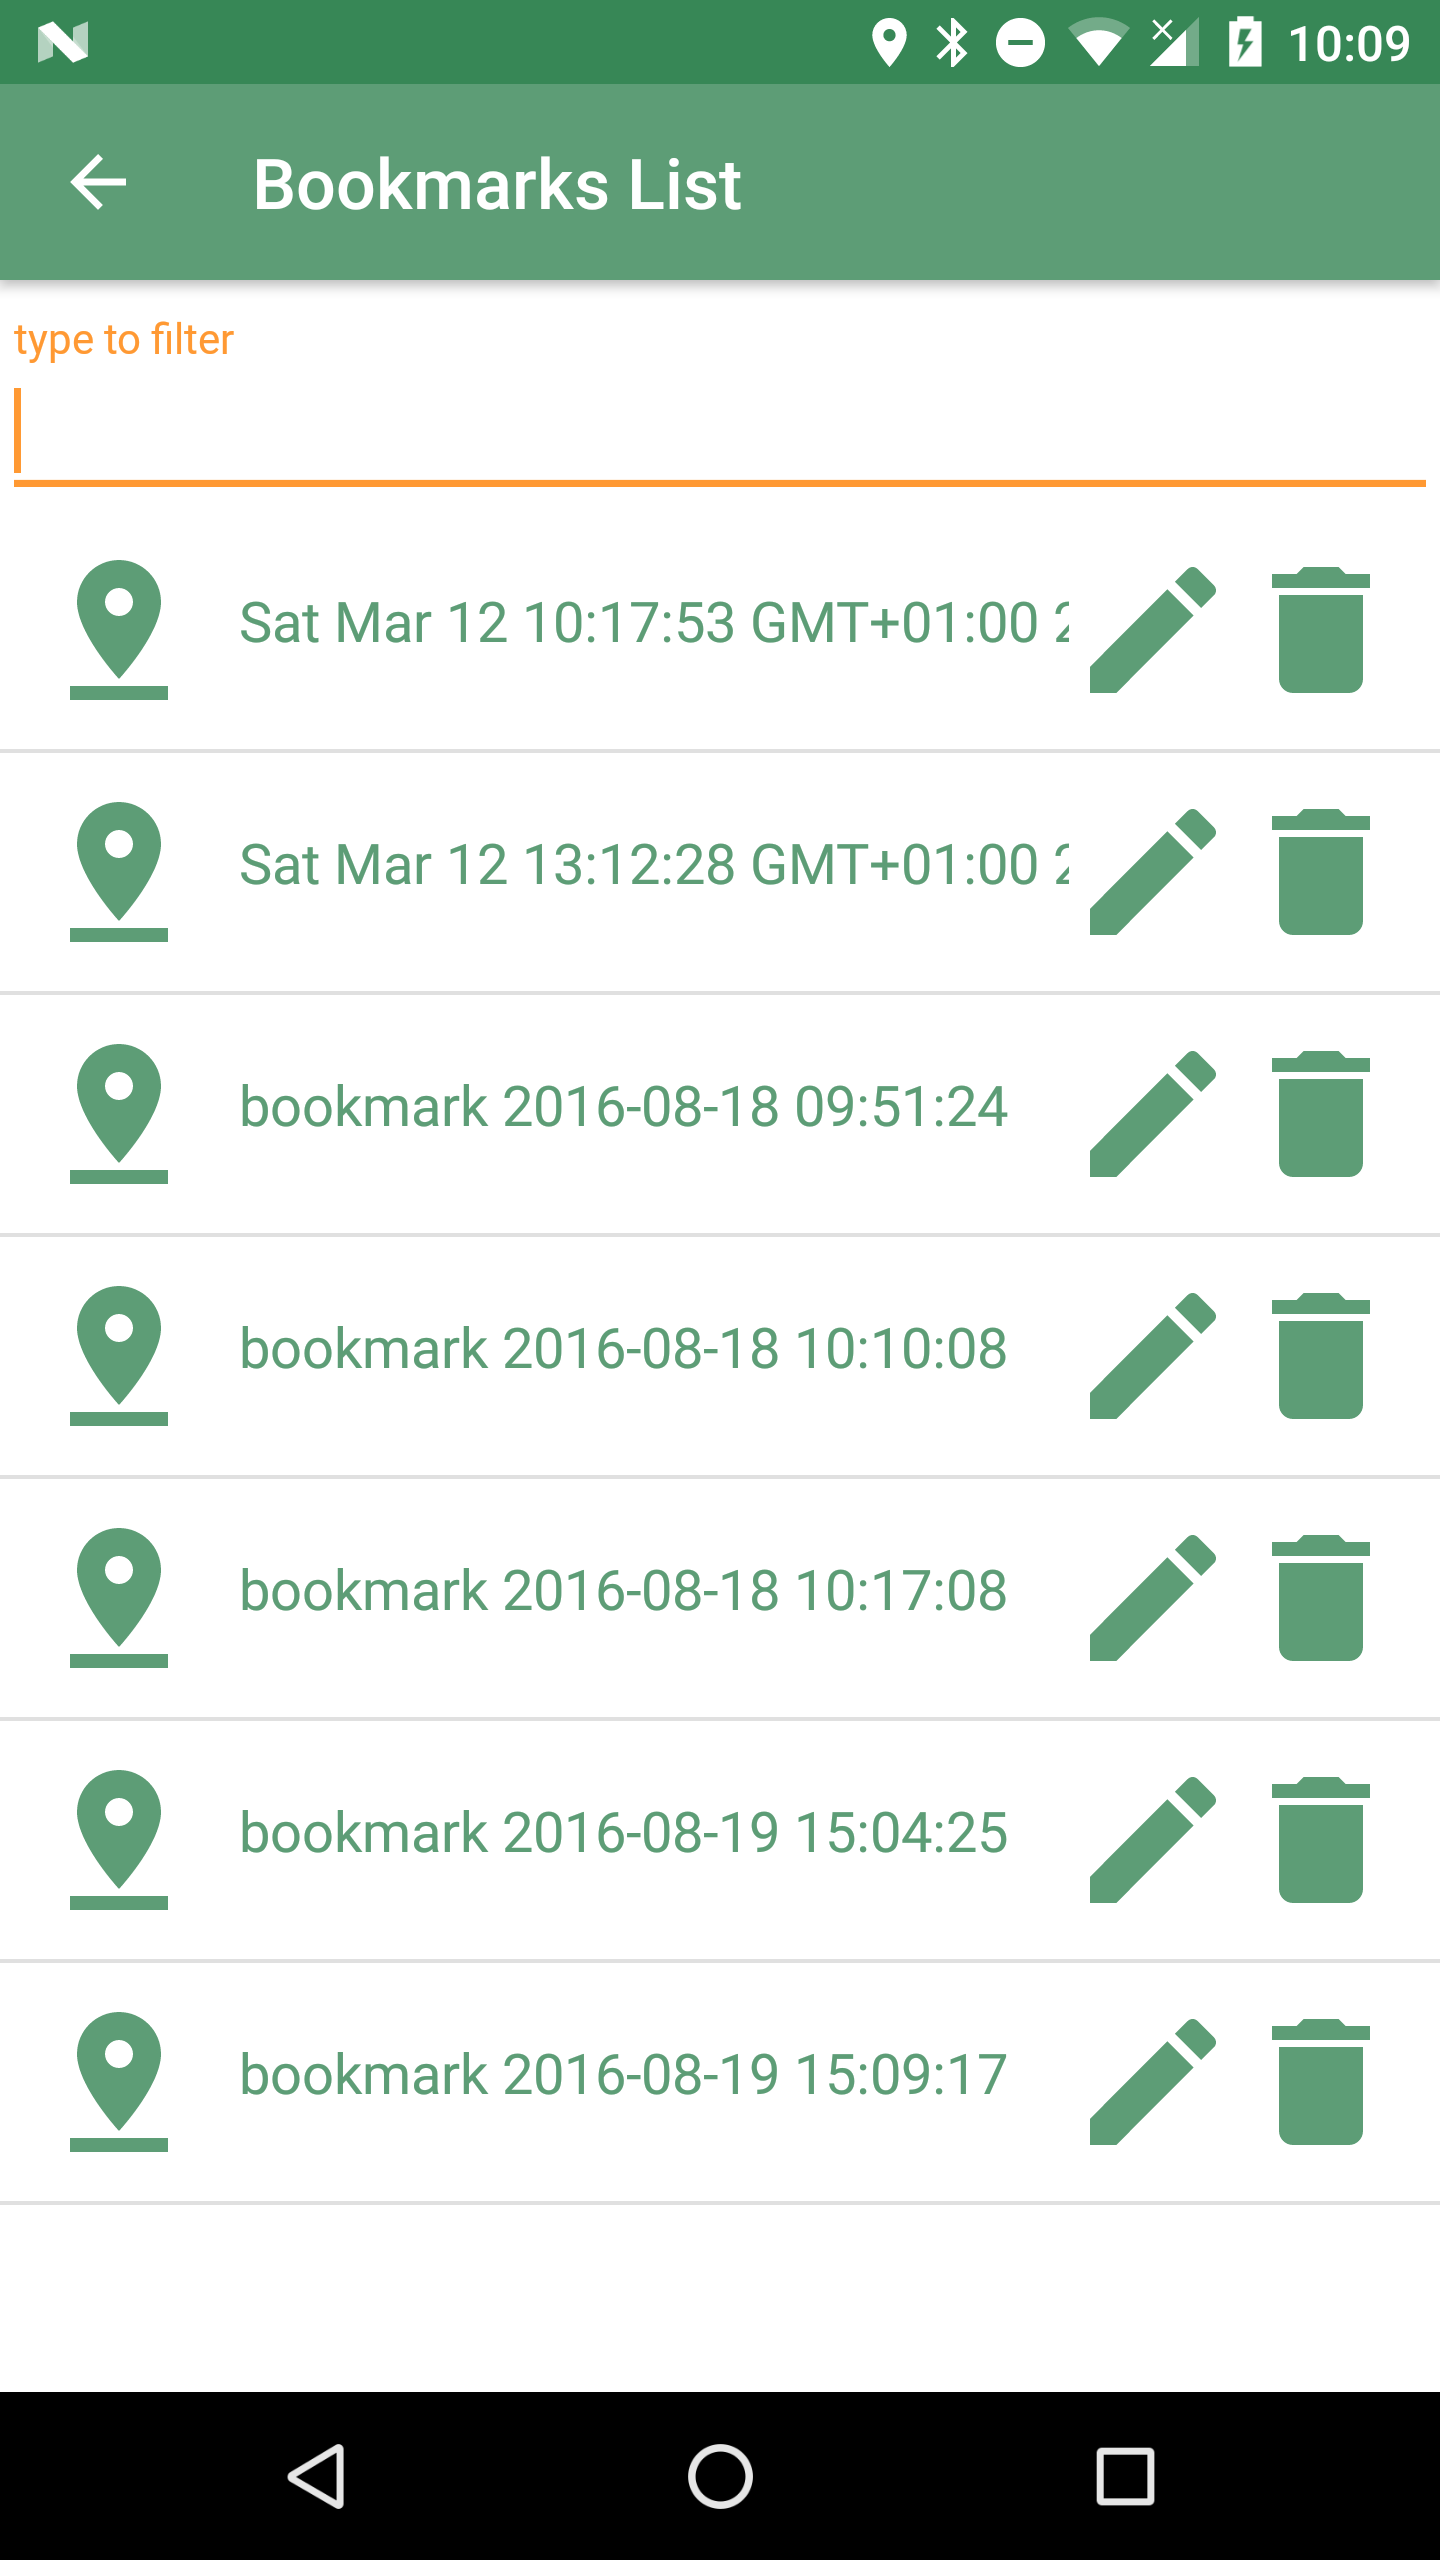
6.6. The Bookmarks List
The bookmarks list shows all the saved bookmarks in the project.
In the upper part there is a textbox that helps to filter particular bookmarks based on name.
Other operations on individual bookmarks are access by pressing bookmark’s icons:
-
go to the bookmark location (left icon)
-
edit the bookmark
-
delete the bookmark
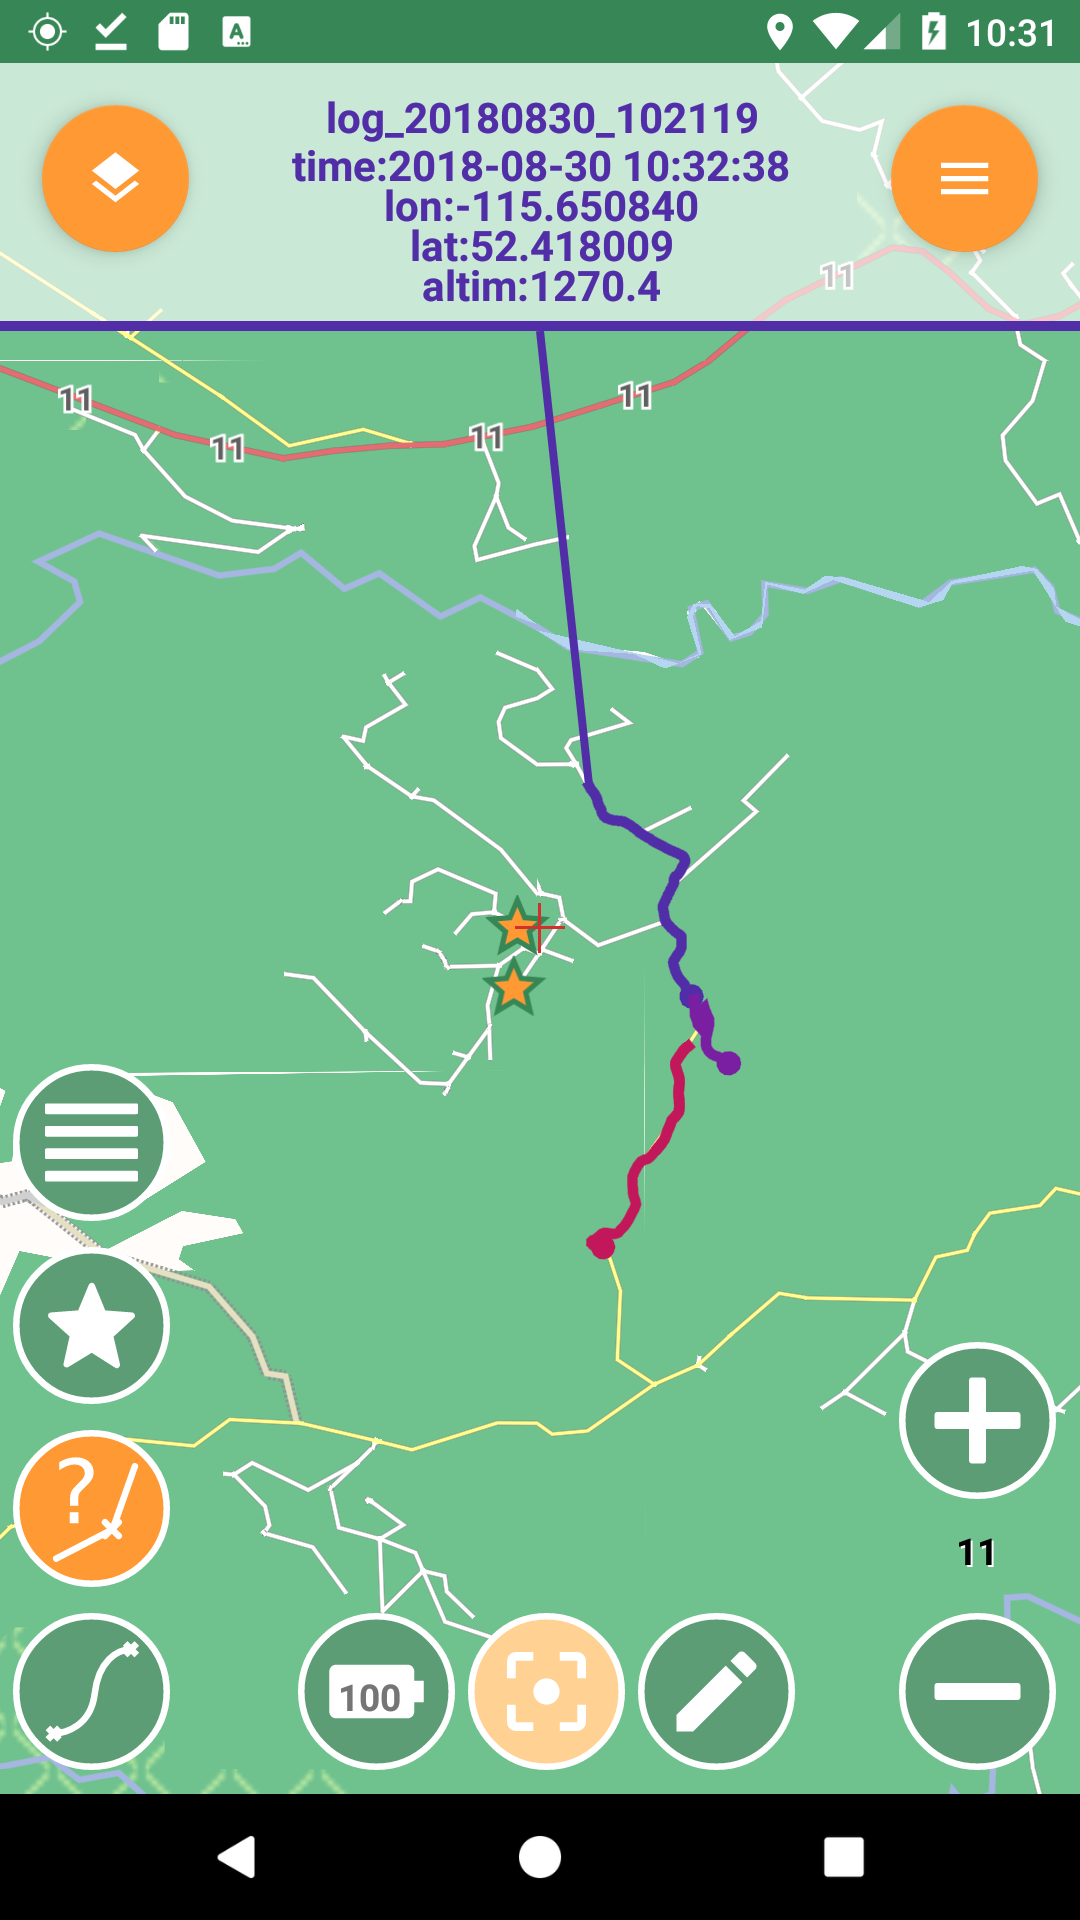
6.7. GPS log analysis tool
The log analysis tool allows to analyze the various positions of a GPS log.
Once enabled, you can simply touch (and hold) the screen near a GPS log and information about the nearest log point will be shown. Also the color of the text will be the one of the currently queried log:
6.8. GPS Data List
The GPS Data list is accessed by using a long press on the GPS Log button. The list shows the data surveyed, both points and tracks.
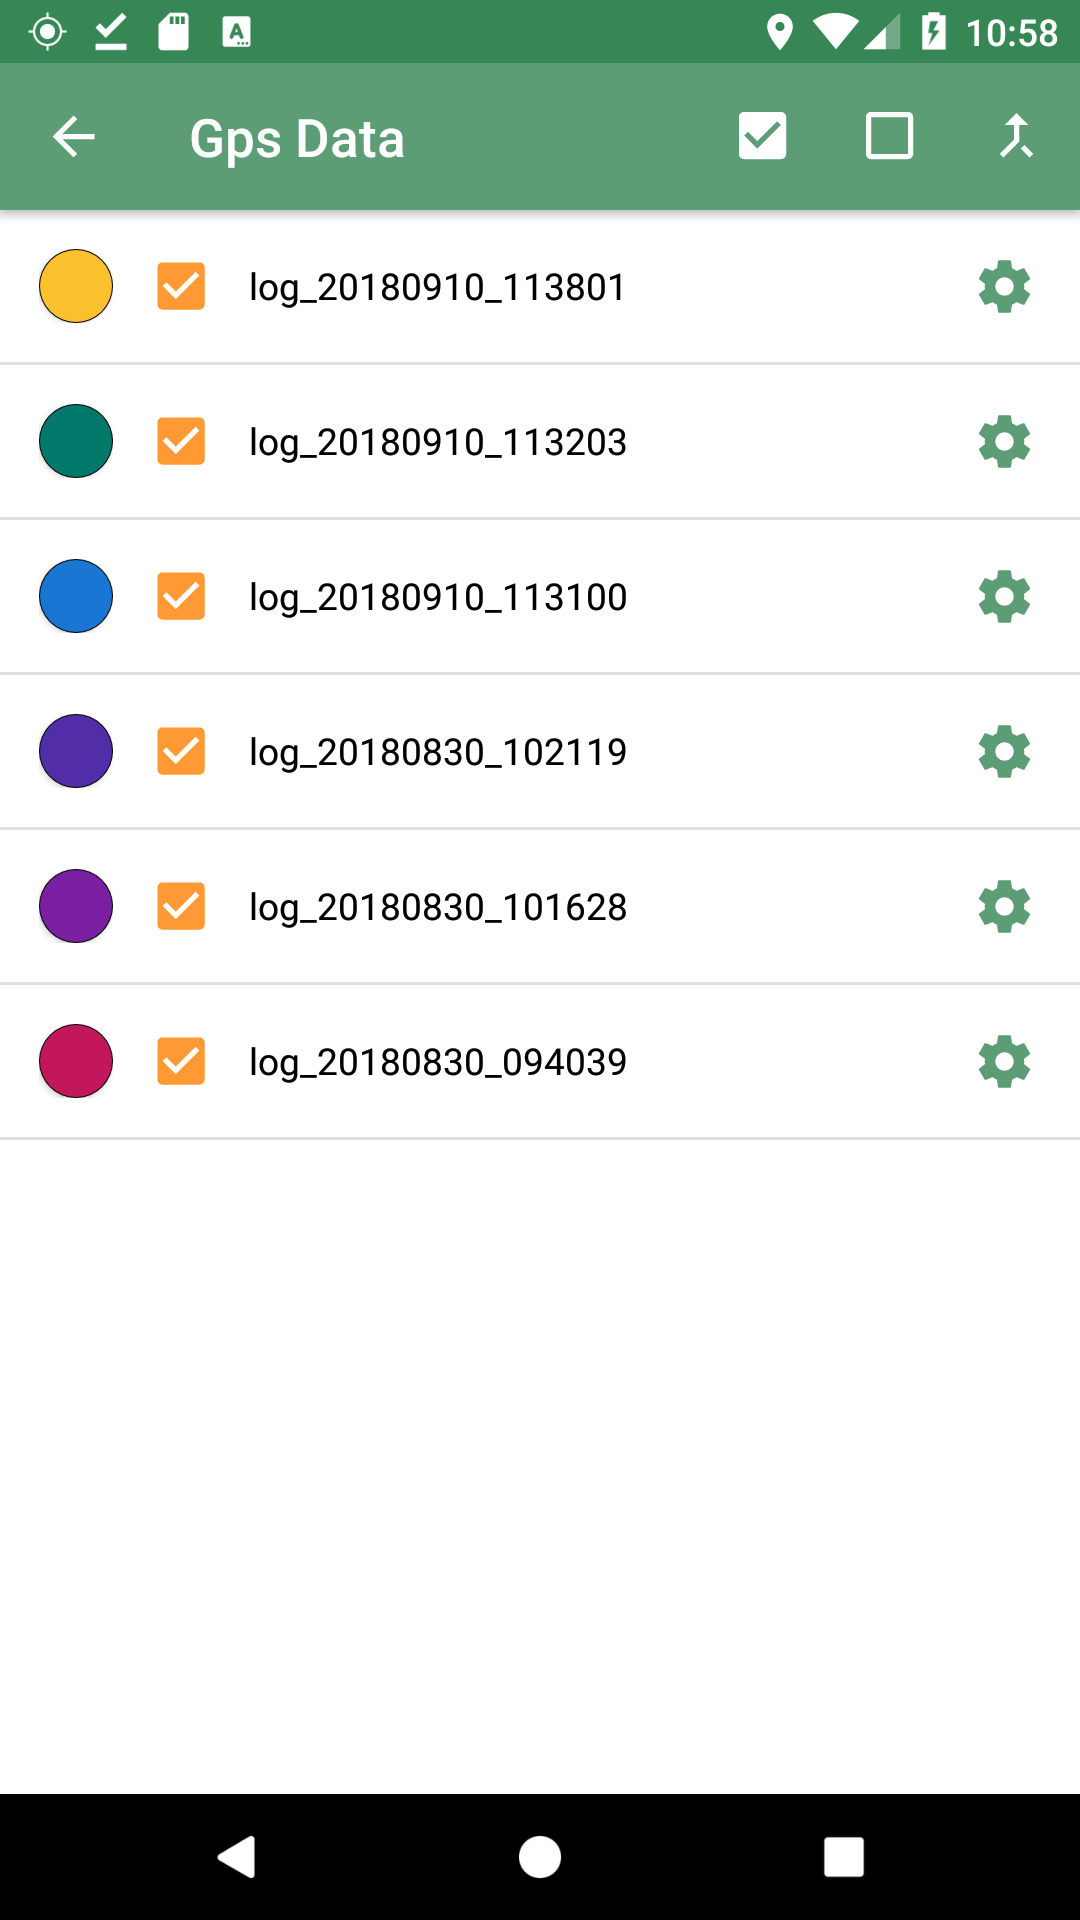
In the action bar there are possibilities to select all, unselect all and merge selected logs.
The list of GPS logs gives the possibility to customize the display of the logs. It is possible to change the visibility of the log using the checkbox. The icon on the right side of each entry opens the GPS log properties panel:
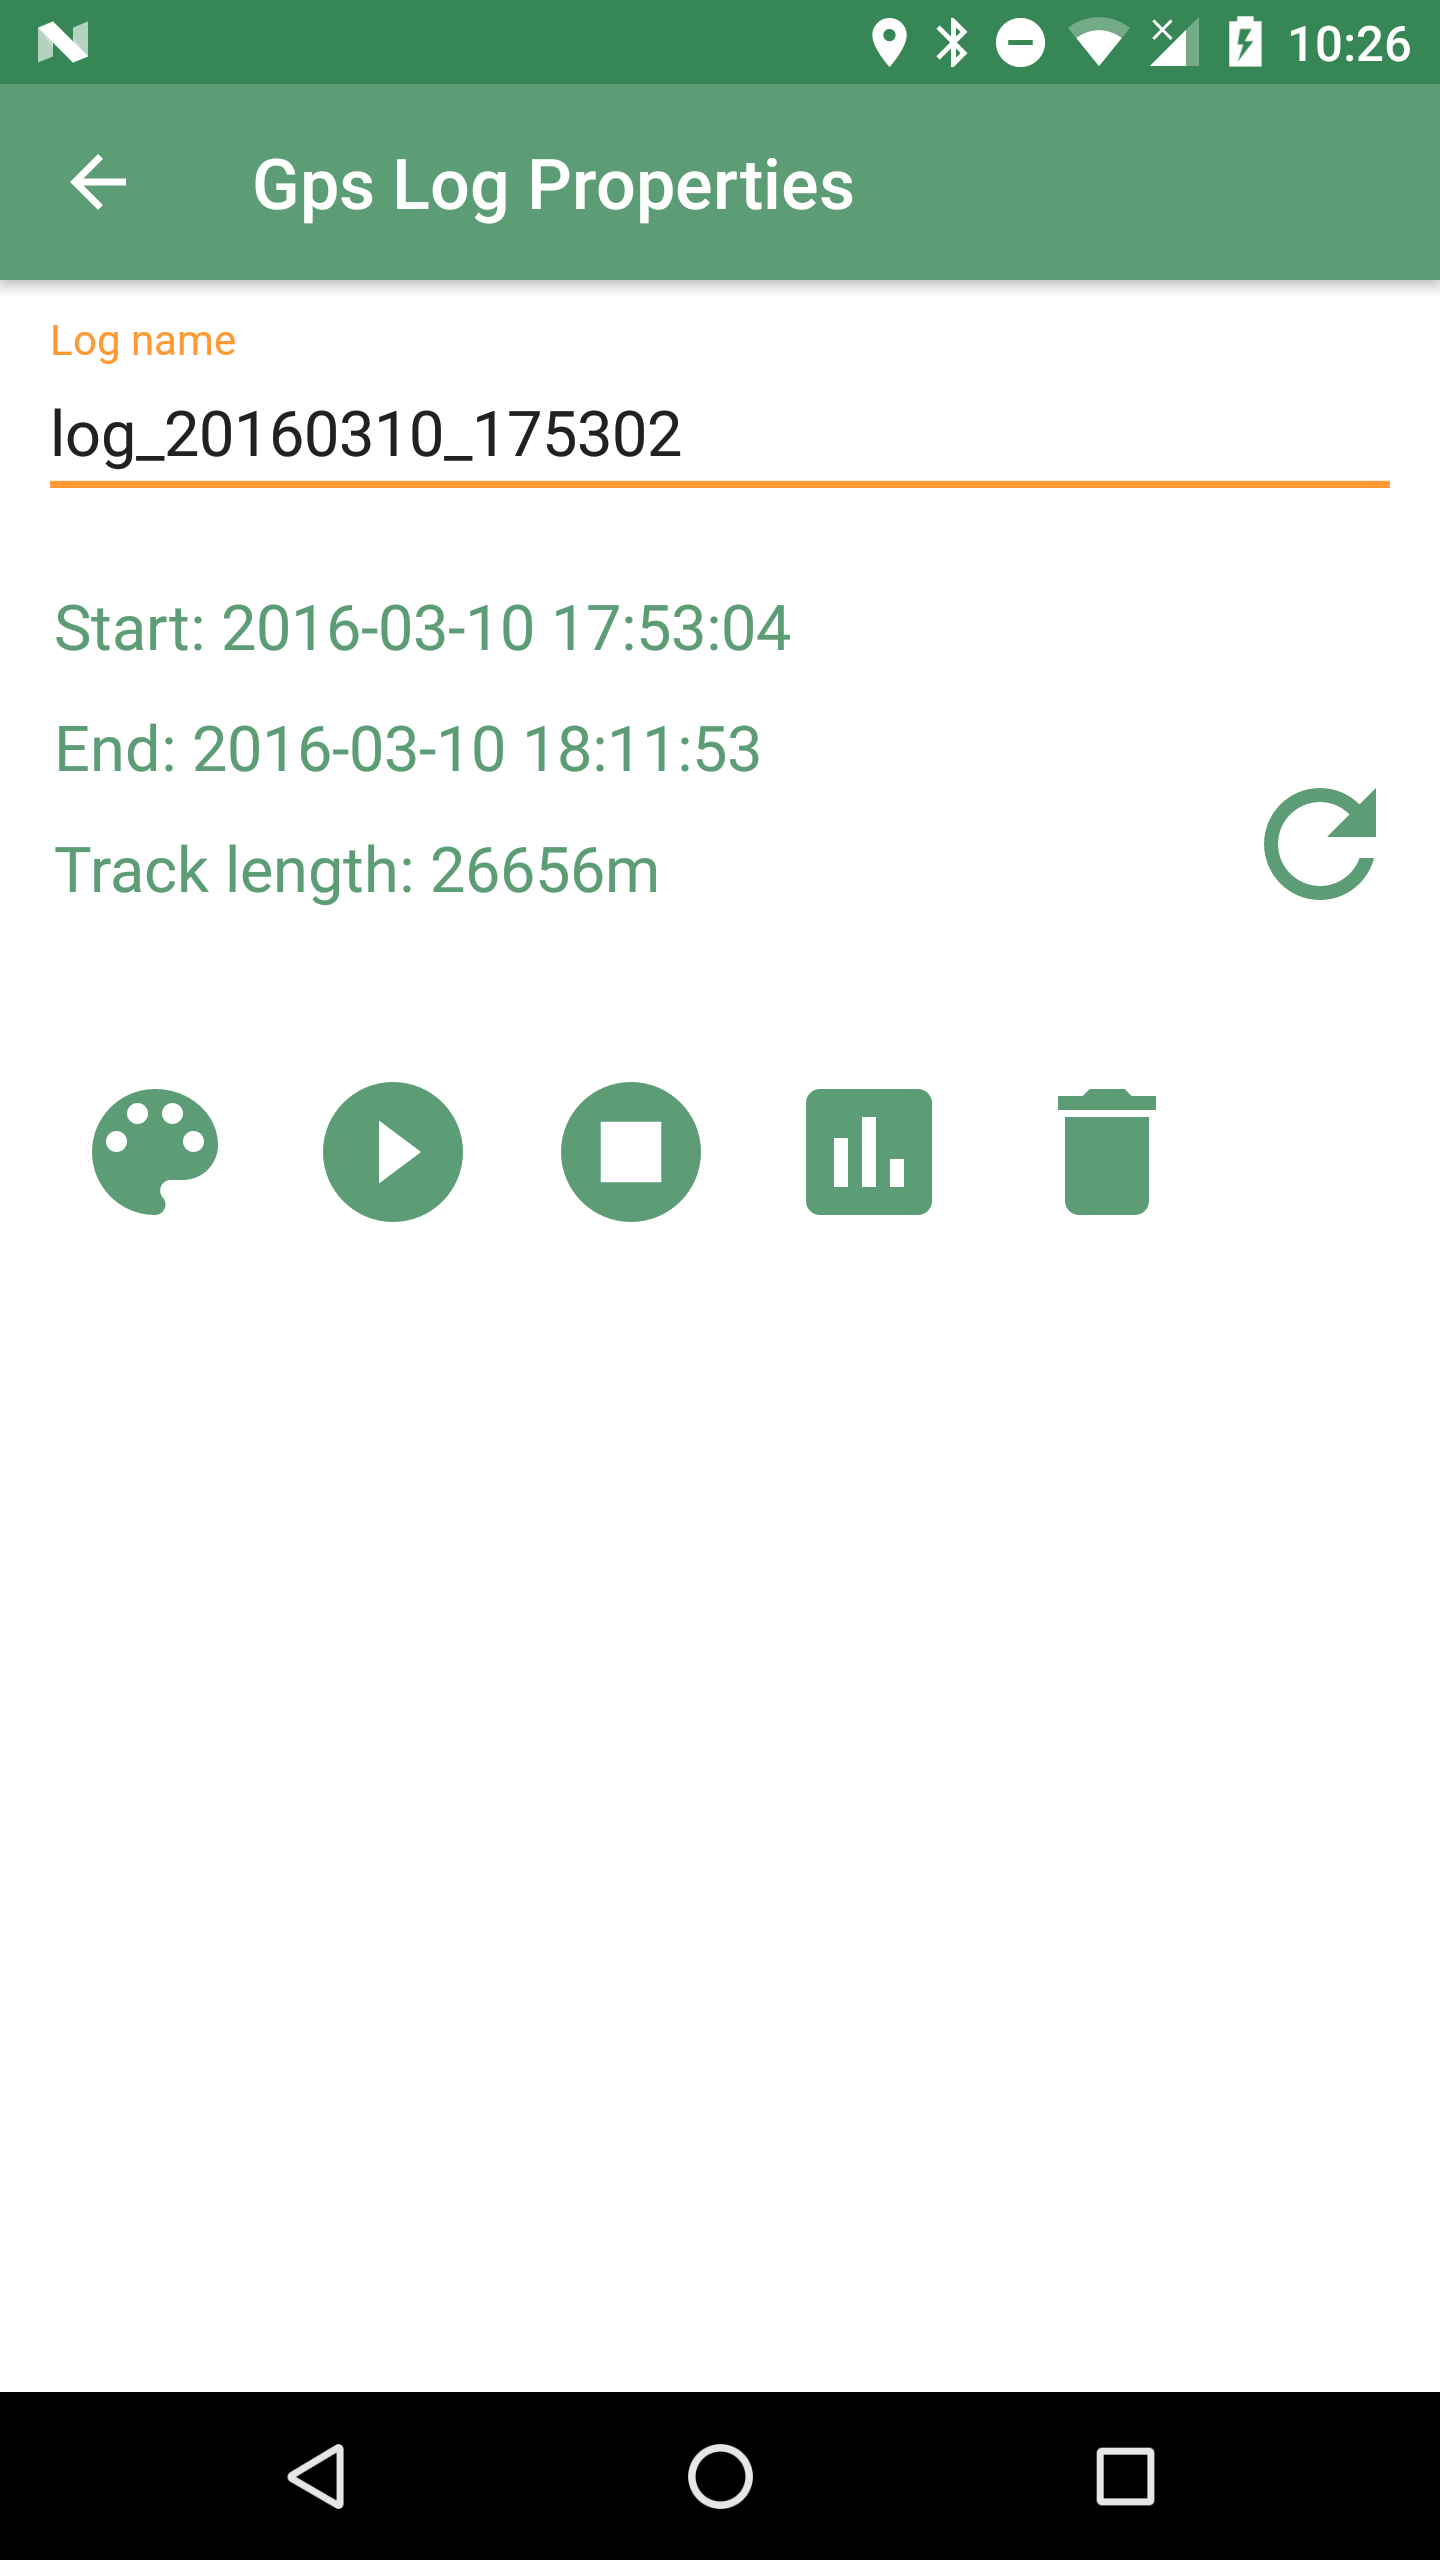
From the properties panel it is possible to:
-
change the name of the GPS log
-
check the start and end date and time
-
update and read the log track length
-
enter the log track style panel to change stroke and fill
-
zoom to the first or last point of the log track in the map view
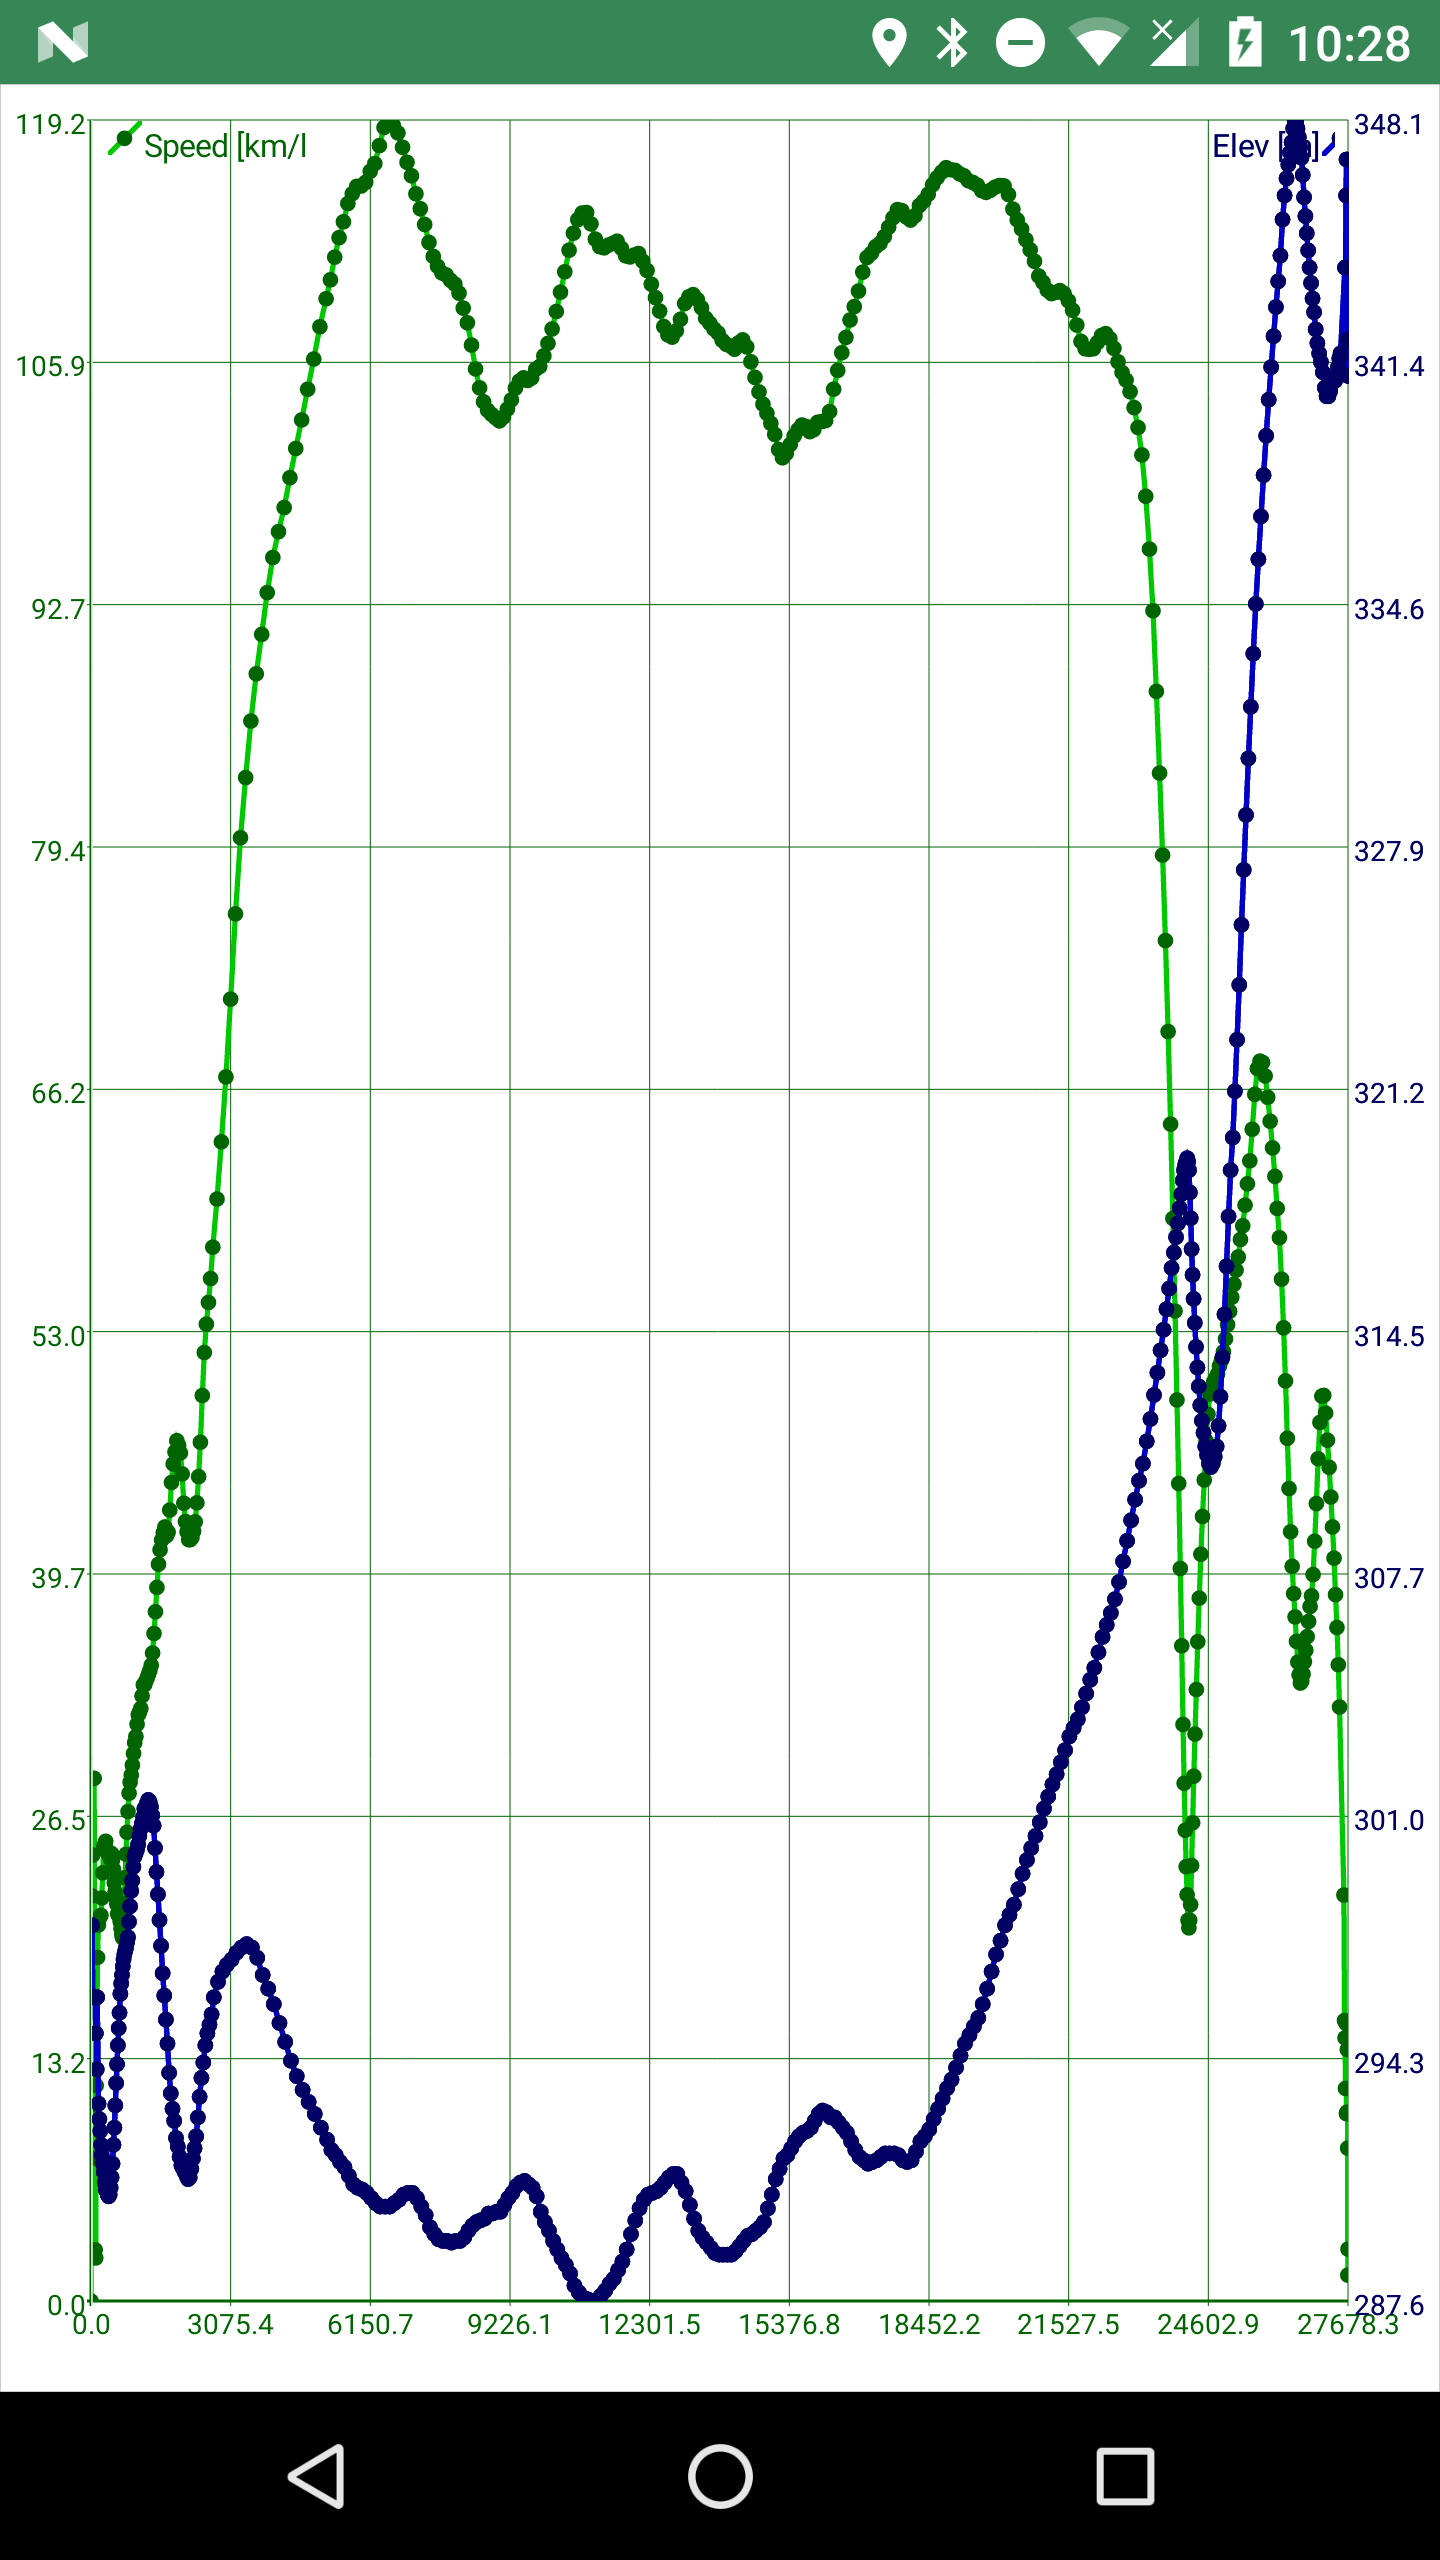
-
chart the log track. The chart has two axes, speed [km/h] on the left and elevation [m.s.l.] on the right.
-
remove the track
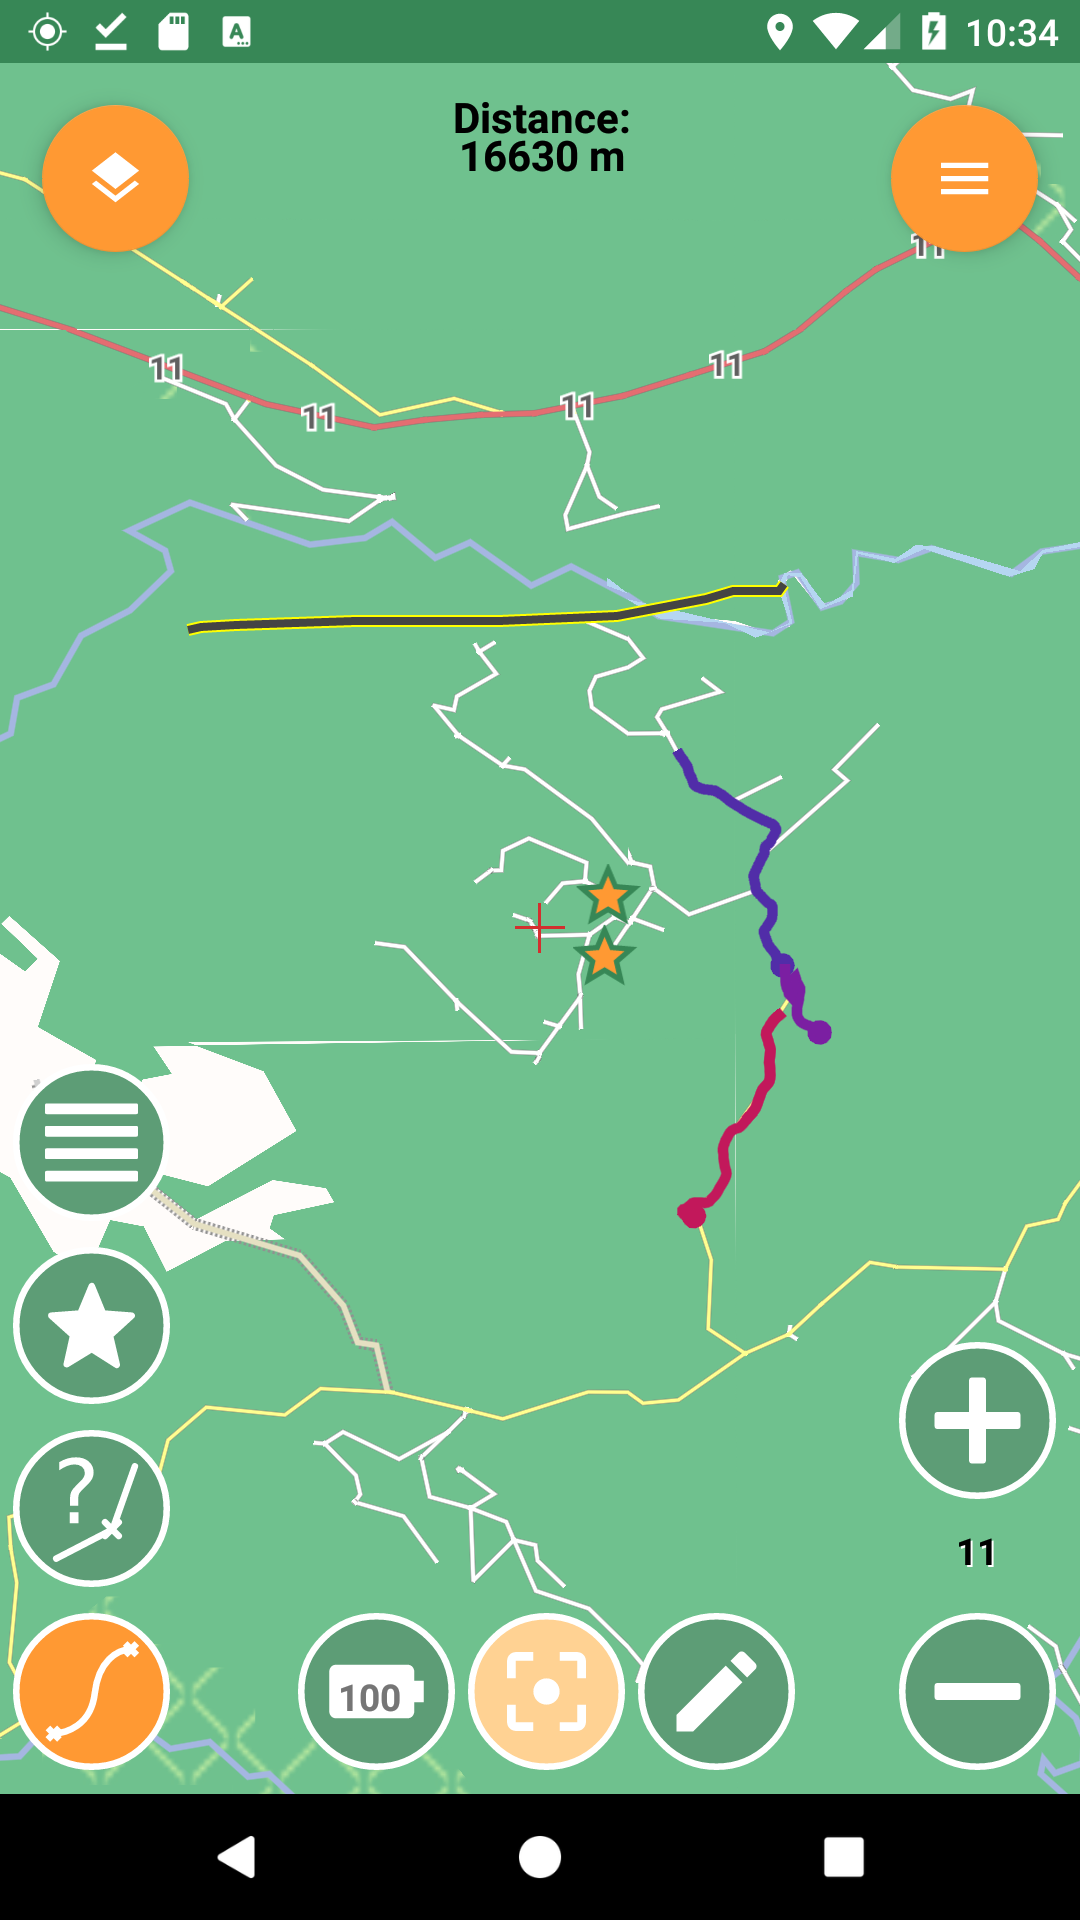
6.9. Measure tool
Activating the measure tool disables the ability to pan the map while enabling the possibility to draw a path on the map and measure the path drawn.
The approximate (the distance is calculated without considering elevation deltas and with the coordinate picking precision of a finger on a screen) distance is shown in the upper part of the map view.
When active, the measure tool has a orange colored icon, when inactive the icon is green instead.
6.10. Battery Status Indicator
The Batter Status Indicator shows the percentage charge of your device’s battery.
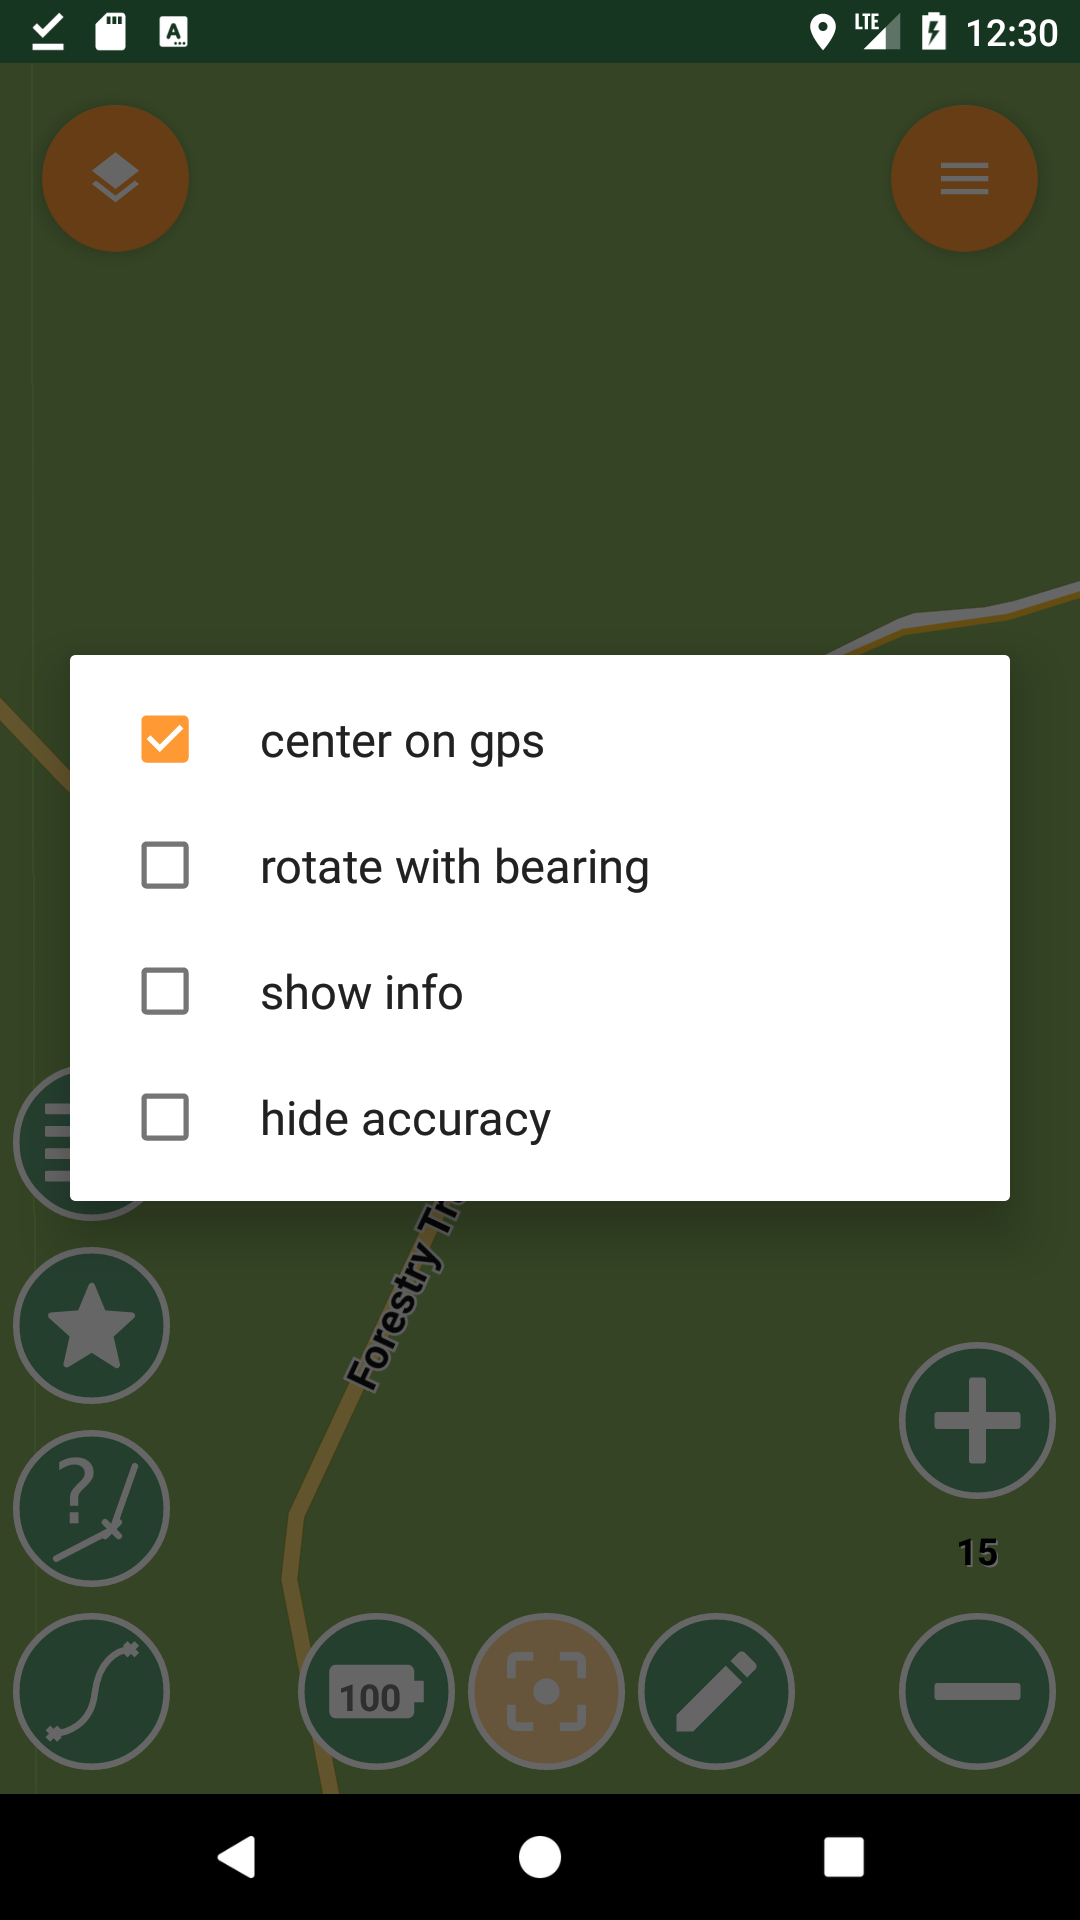
6.11. GPS Position Button
If you tap the GSP Position button, the Map View will center the map on the current GPS position.
A long press on the button will display the GPS options.
7. The Map Menu
The Map Menu button in the upper right of the Map View provides access to some additional map functions:
-
open compass app
-
go to a location
-
share the current position
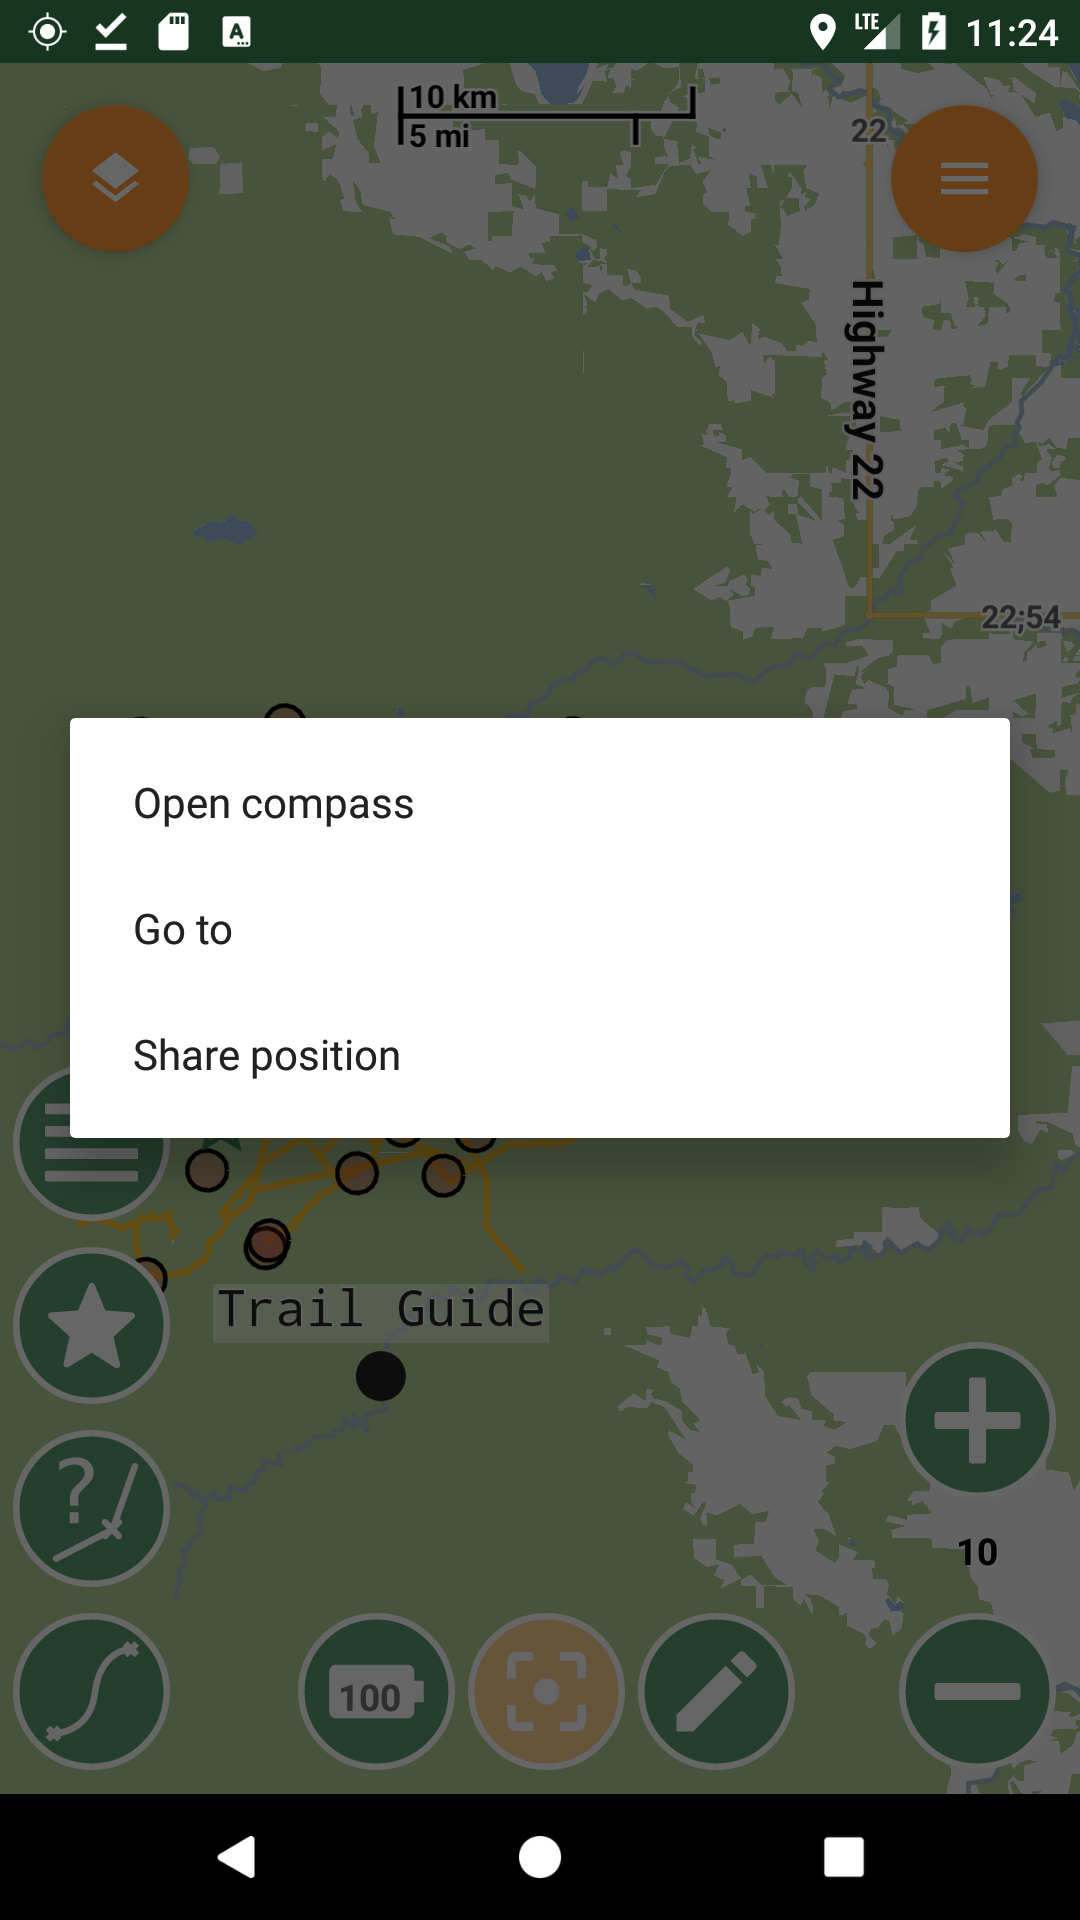
A long press on the Map Menu button will hide the tool buttons in the lower part of the Map View.
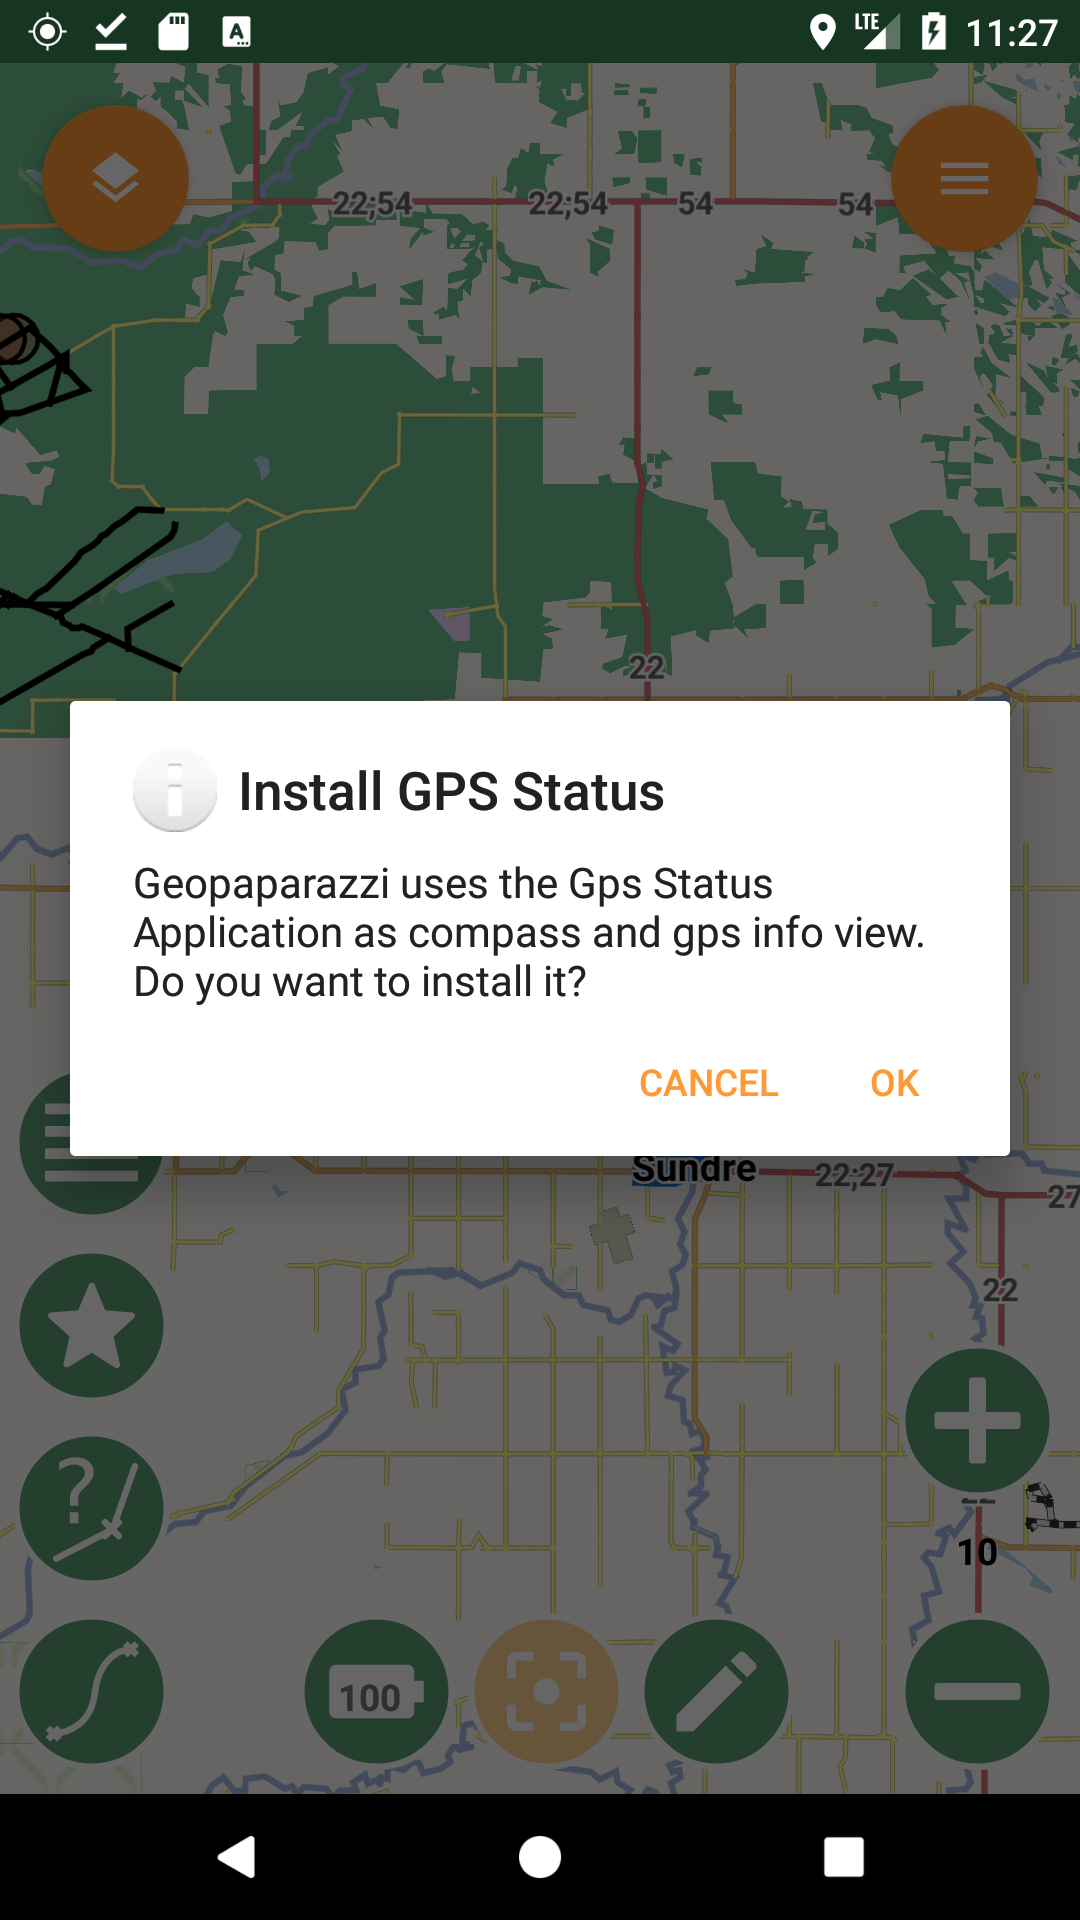
7.1. Open Compass
This function will open the external GPSTest app
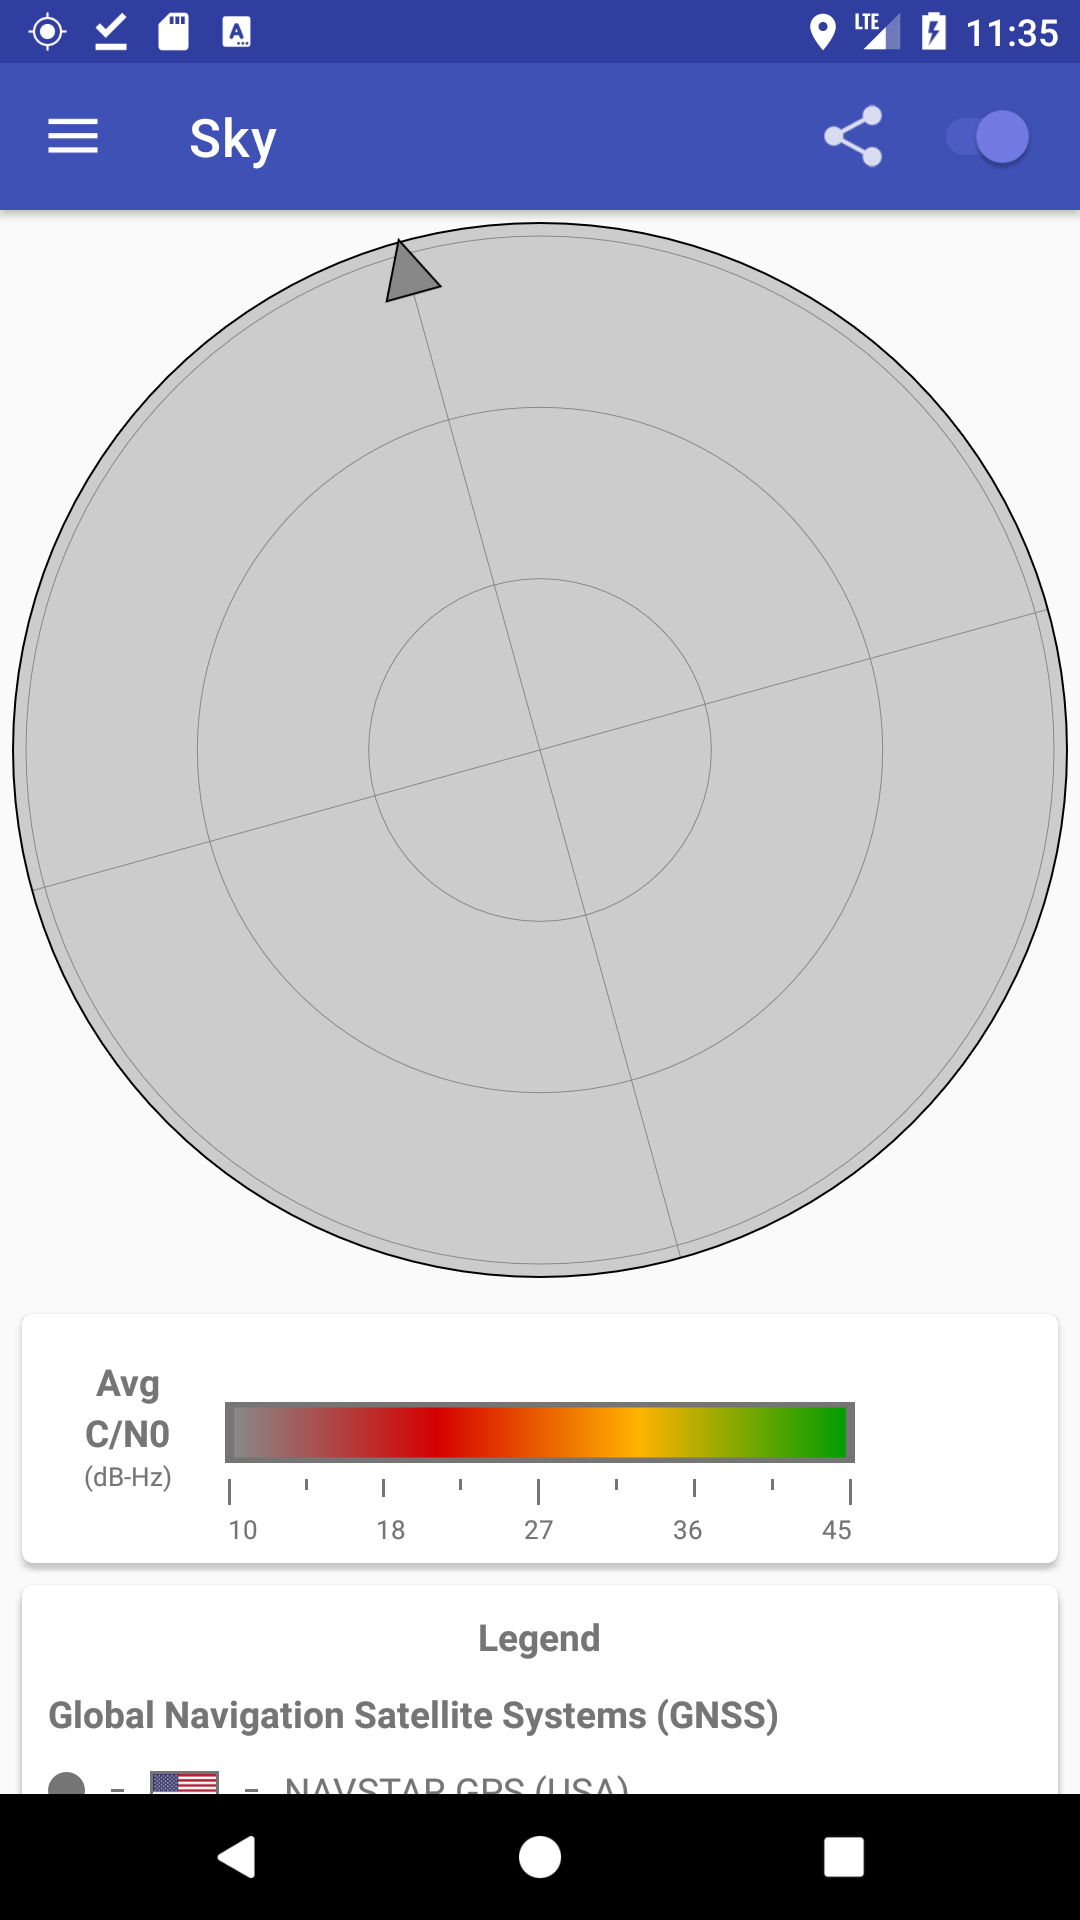
If is not installed on your device, you will be prompted to install.
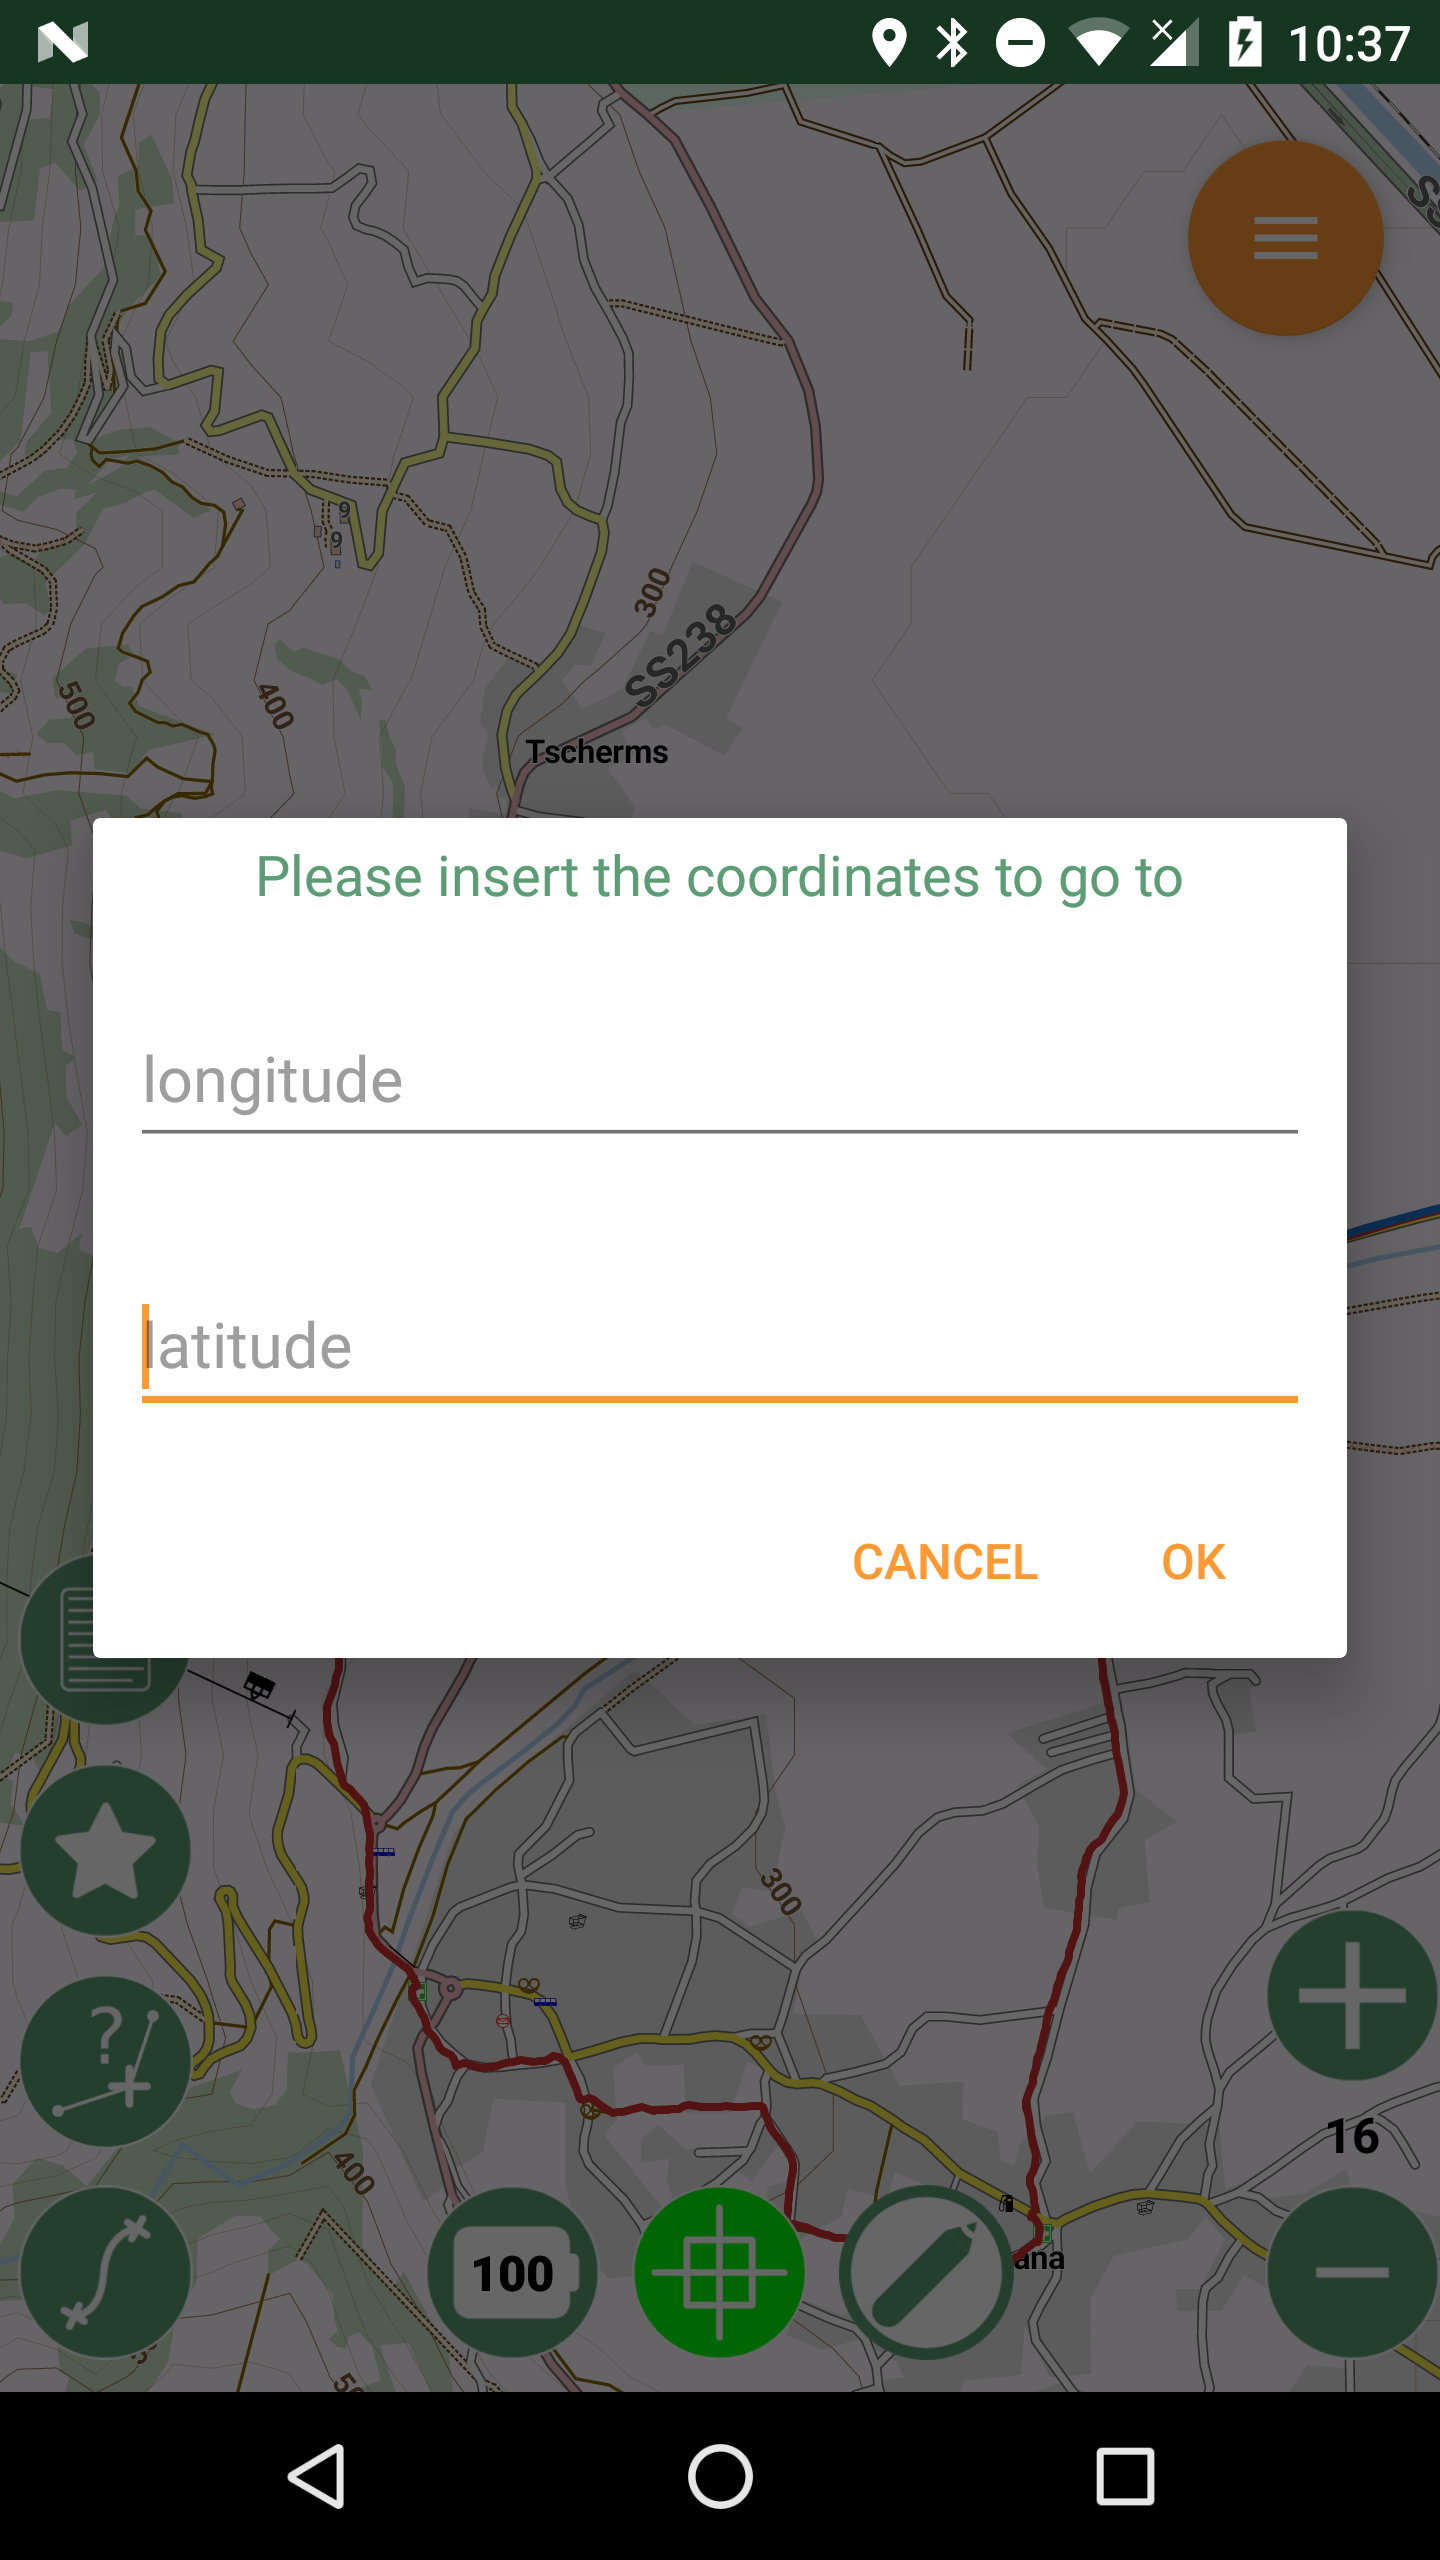
7.2. Go to
The go to function has two possibilities for moving the current map view:
-
go to coordinate
-
use geocoding and/or routing
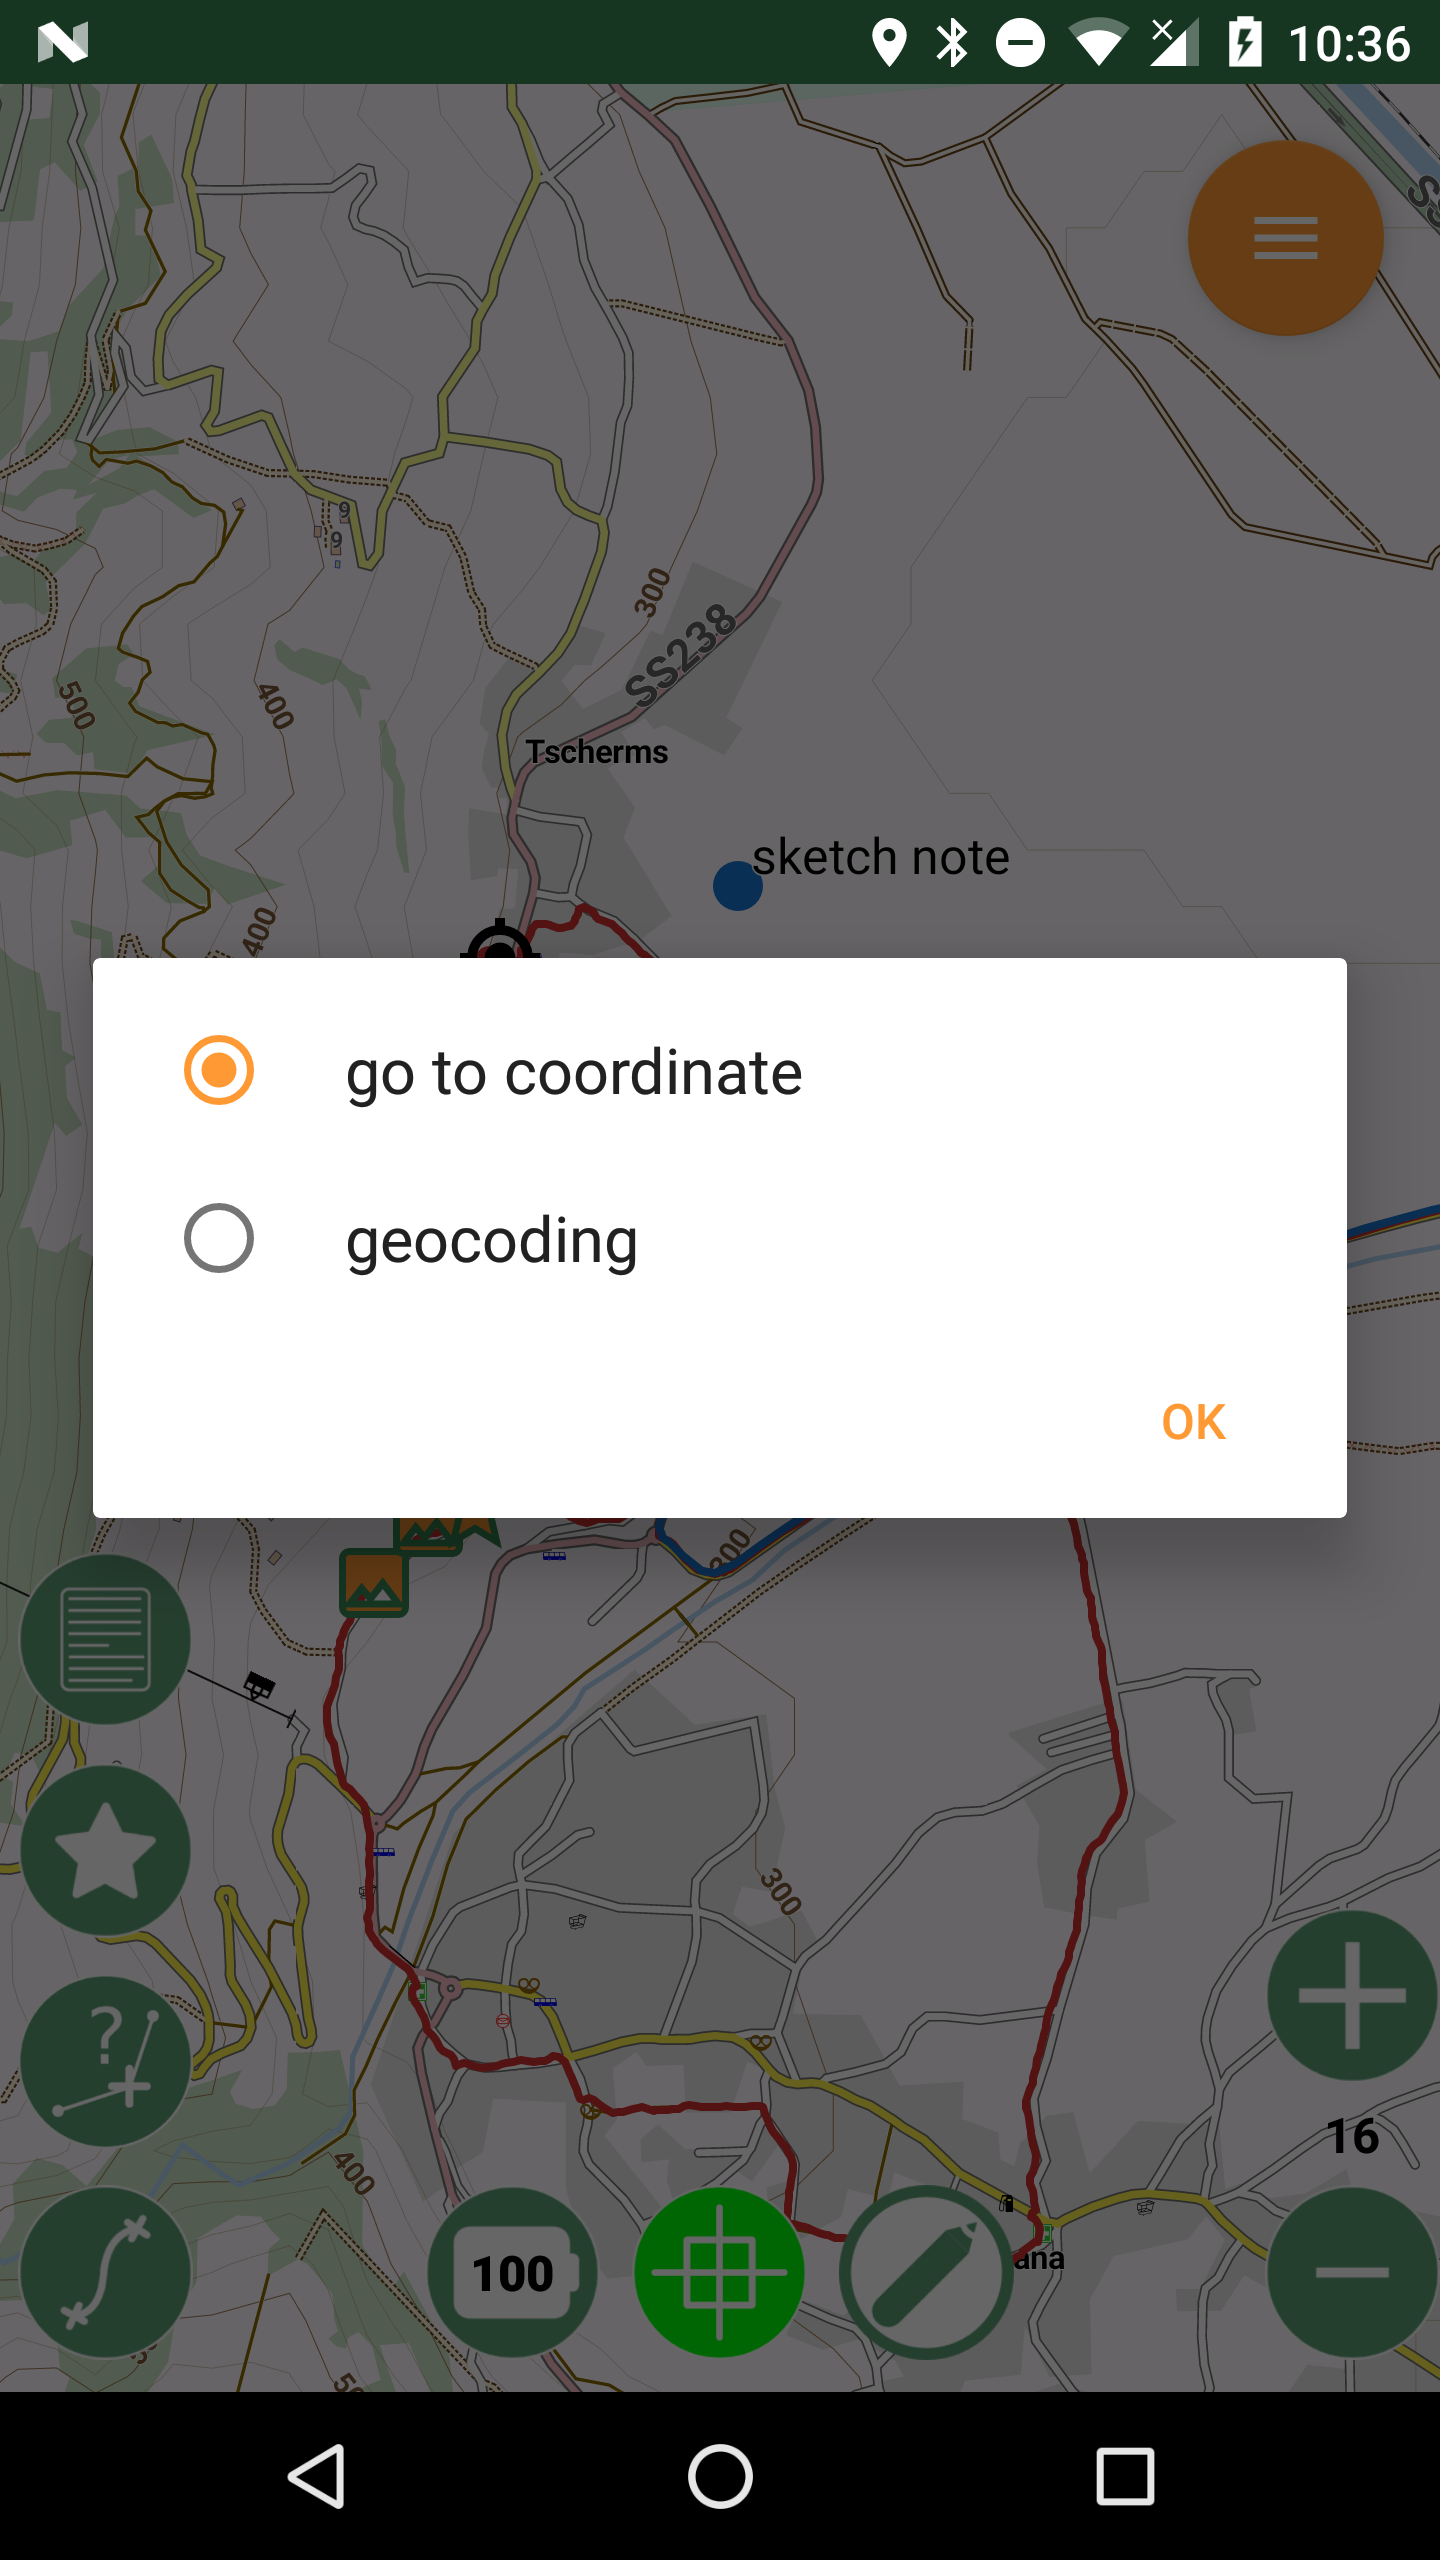
In the go to coordinate panel it is possible to insert lat/long coordinates and navigate to the inserted point on the map view:
Through geocoding it is possible to insert some address and find its location (uses Google Maps geocoding service) when your device has an active network connection.
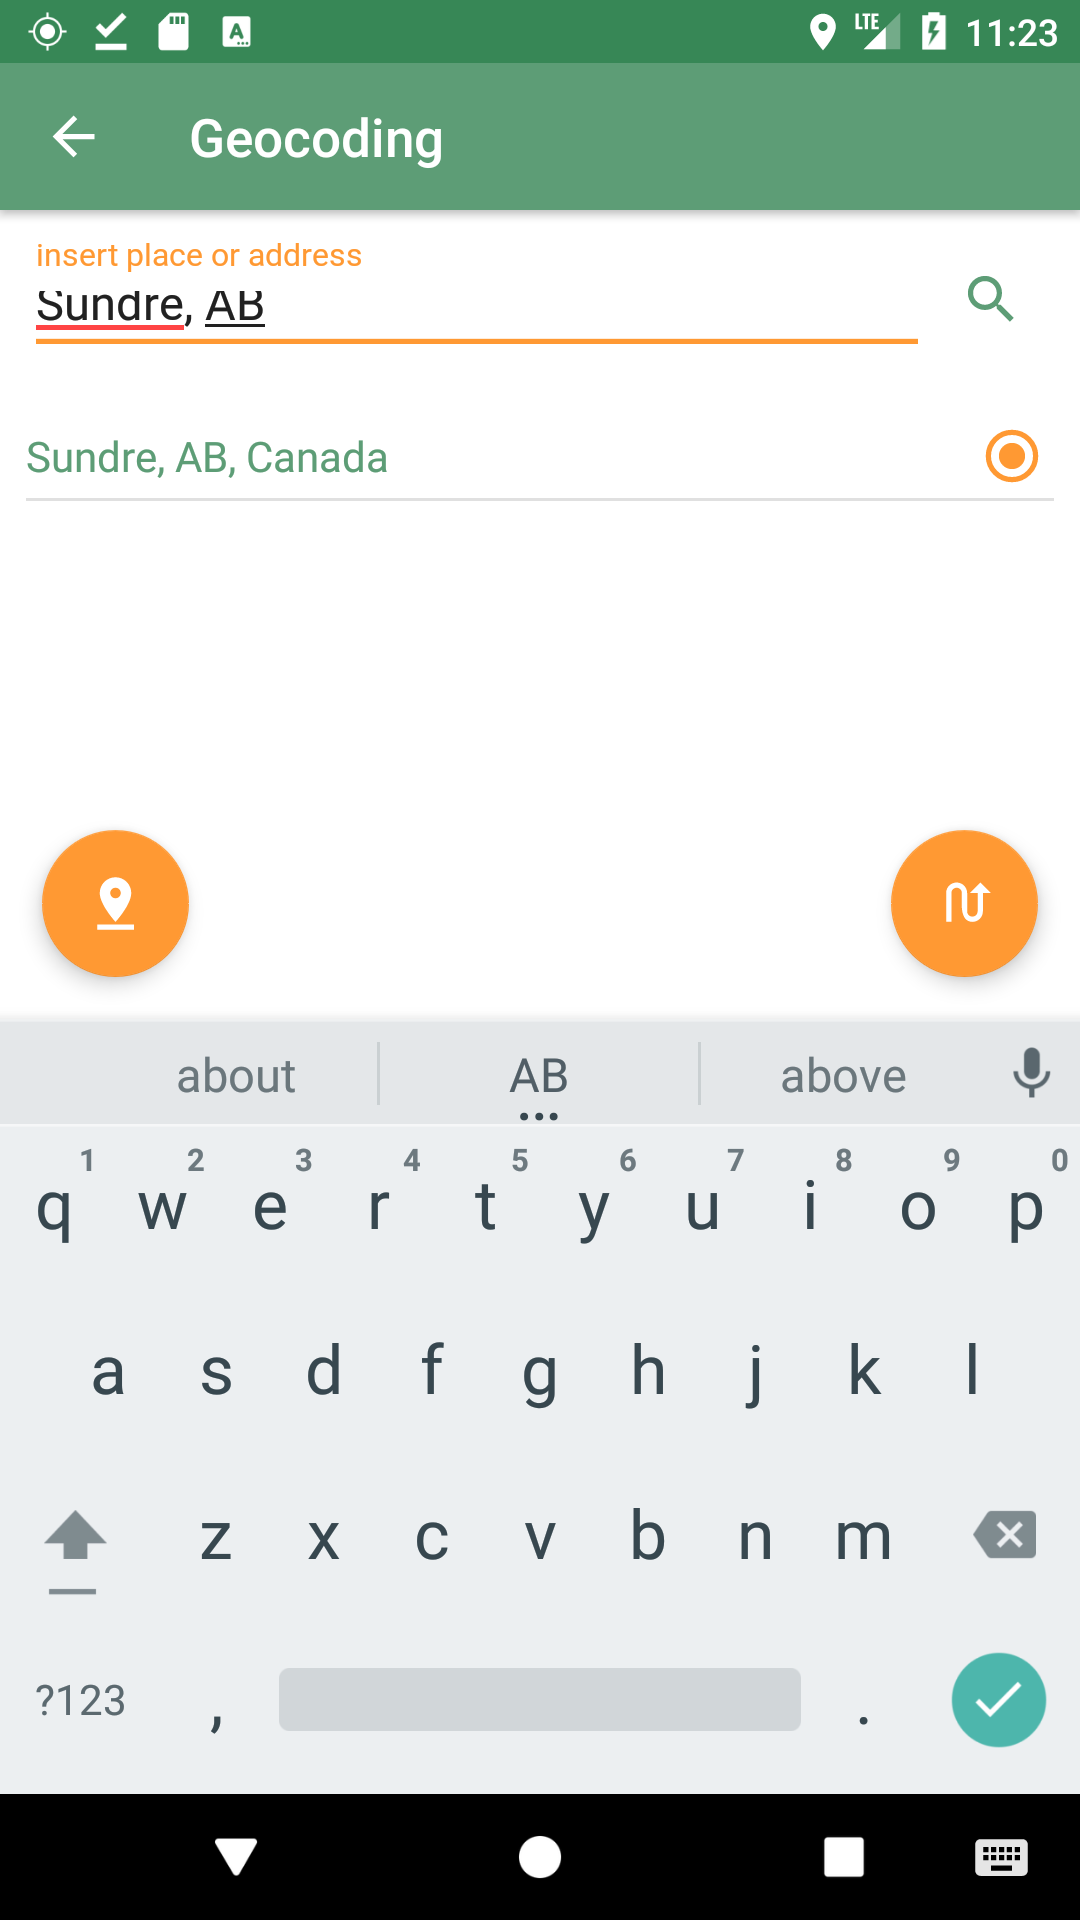
From the same panel it is possible to create a route from the current position to the inserted location.
The routing service used is OSRM.
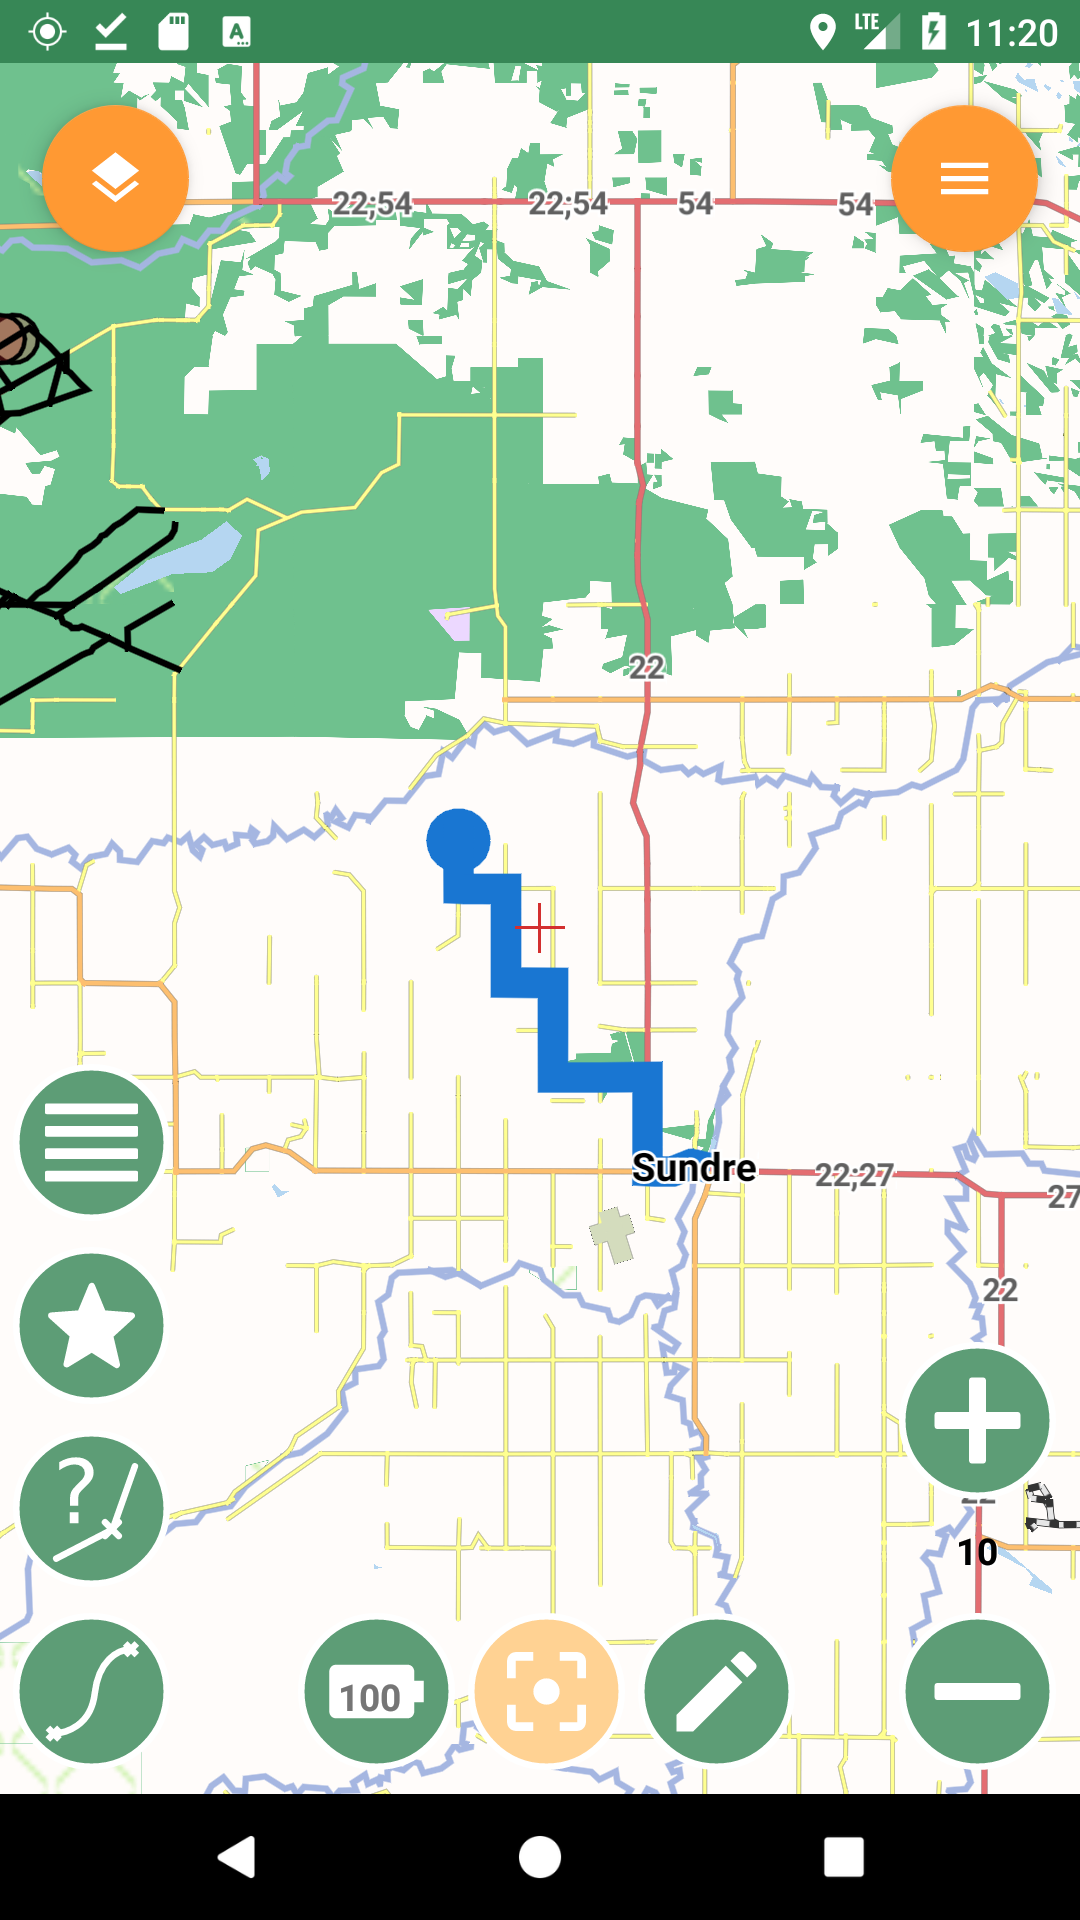
Once the Routing button is tapped, the route is calculated by the service starting from the current map center to the destination point. The route is then downloaded, inserted into the project as a new GPS log, and shown as a GPS log track.
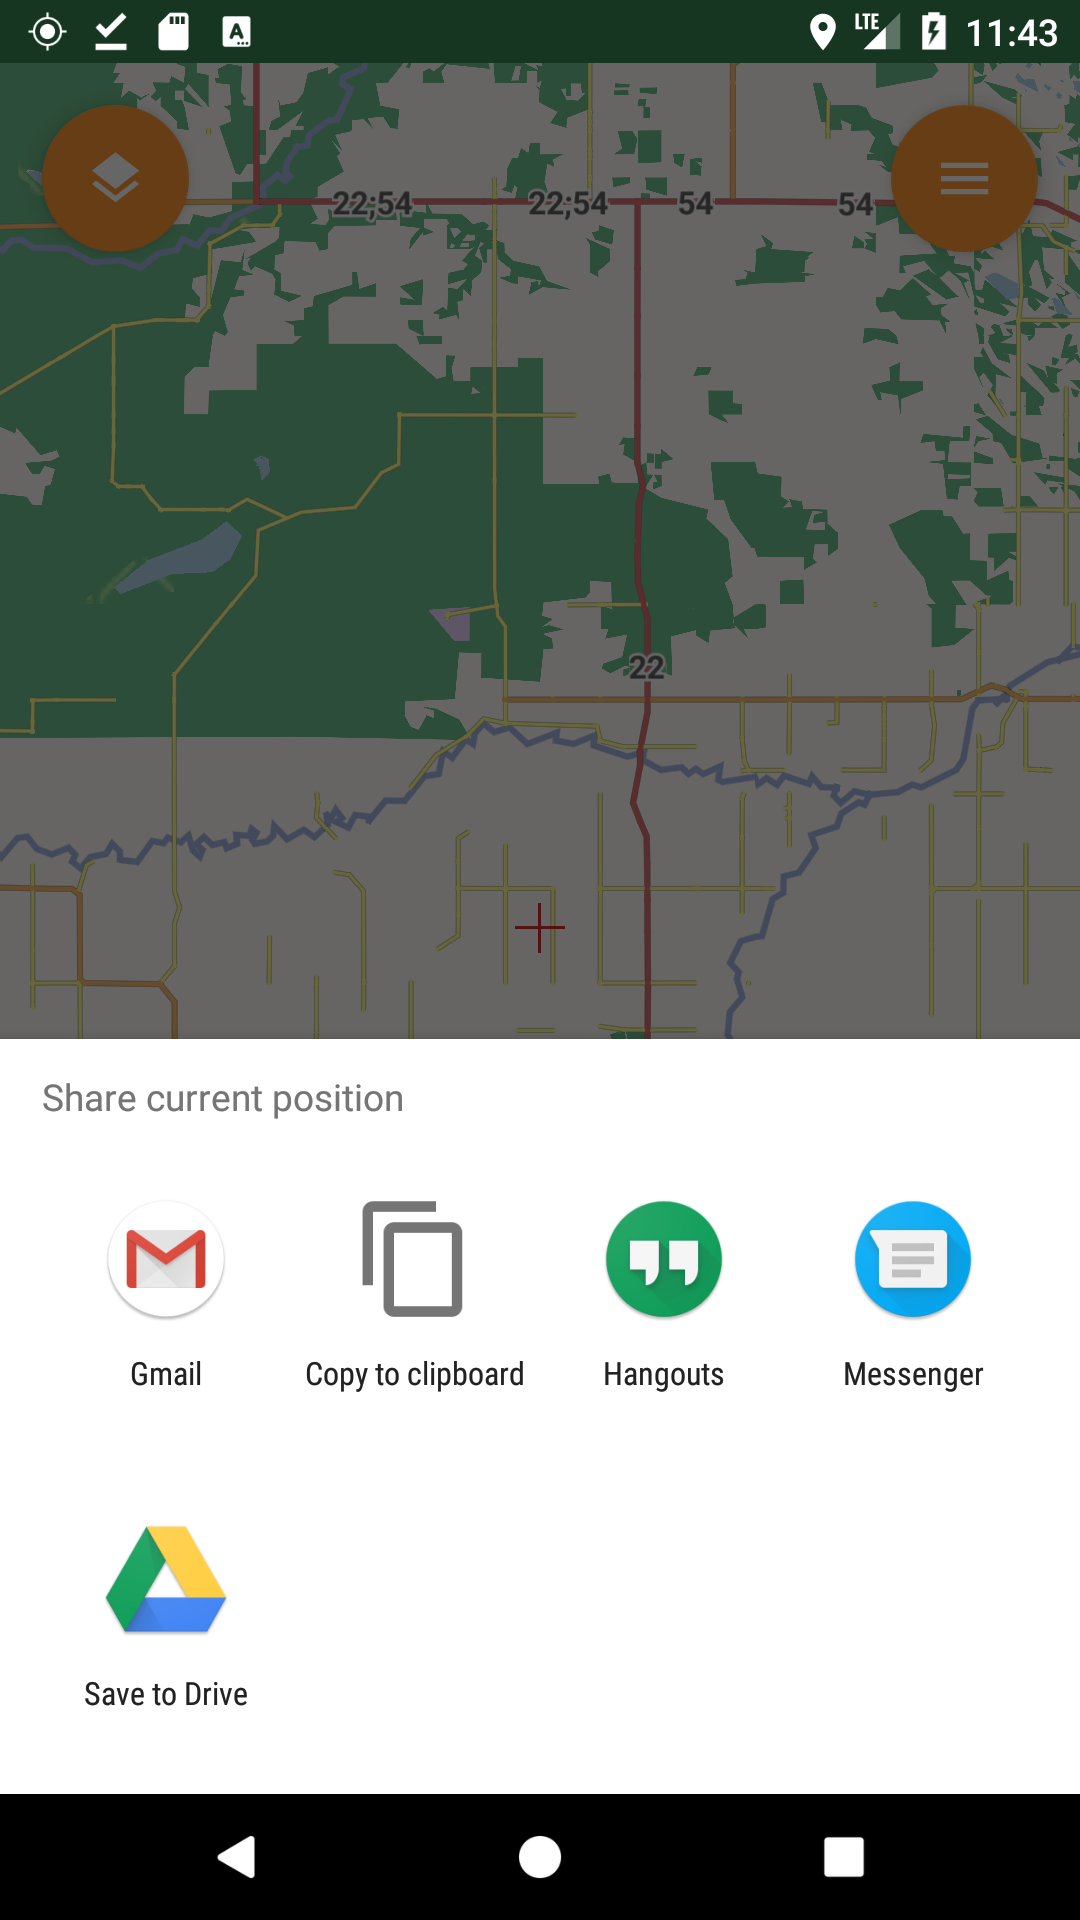
7.3. Share position
The share position entry opens the standard sharing dialog of Android with all the apps available for handling sharing of information:
If for example telegram app is chosen, the sent link will look like:
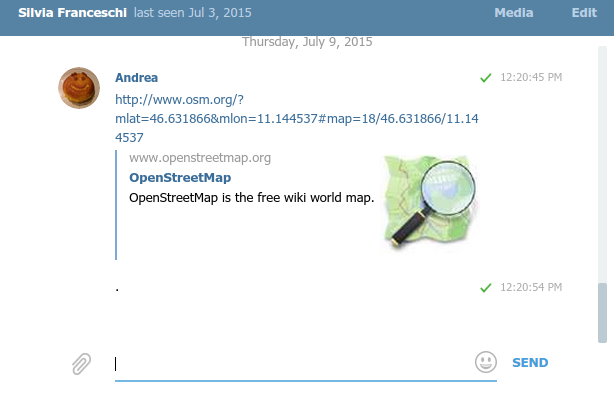
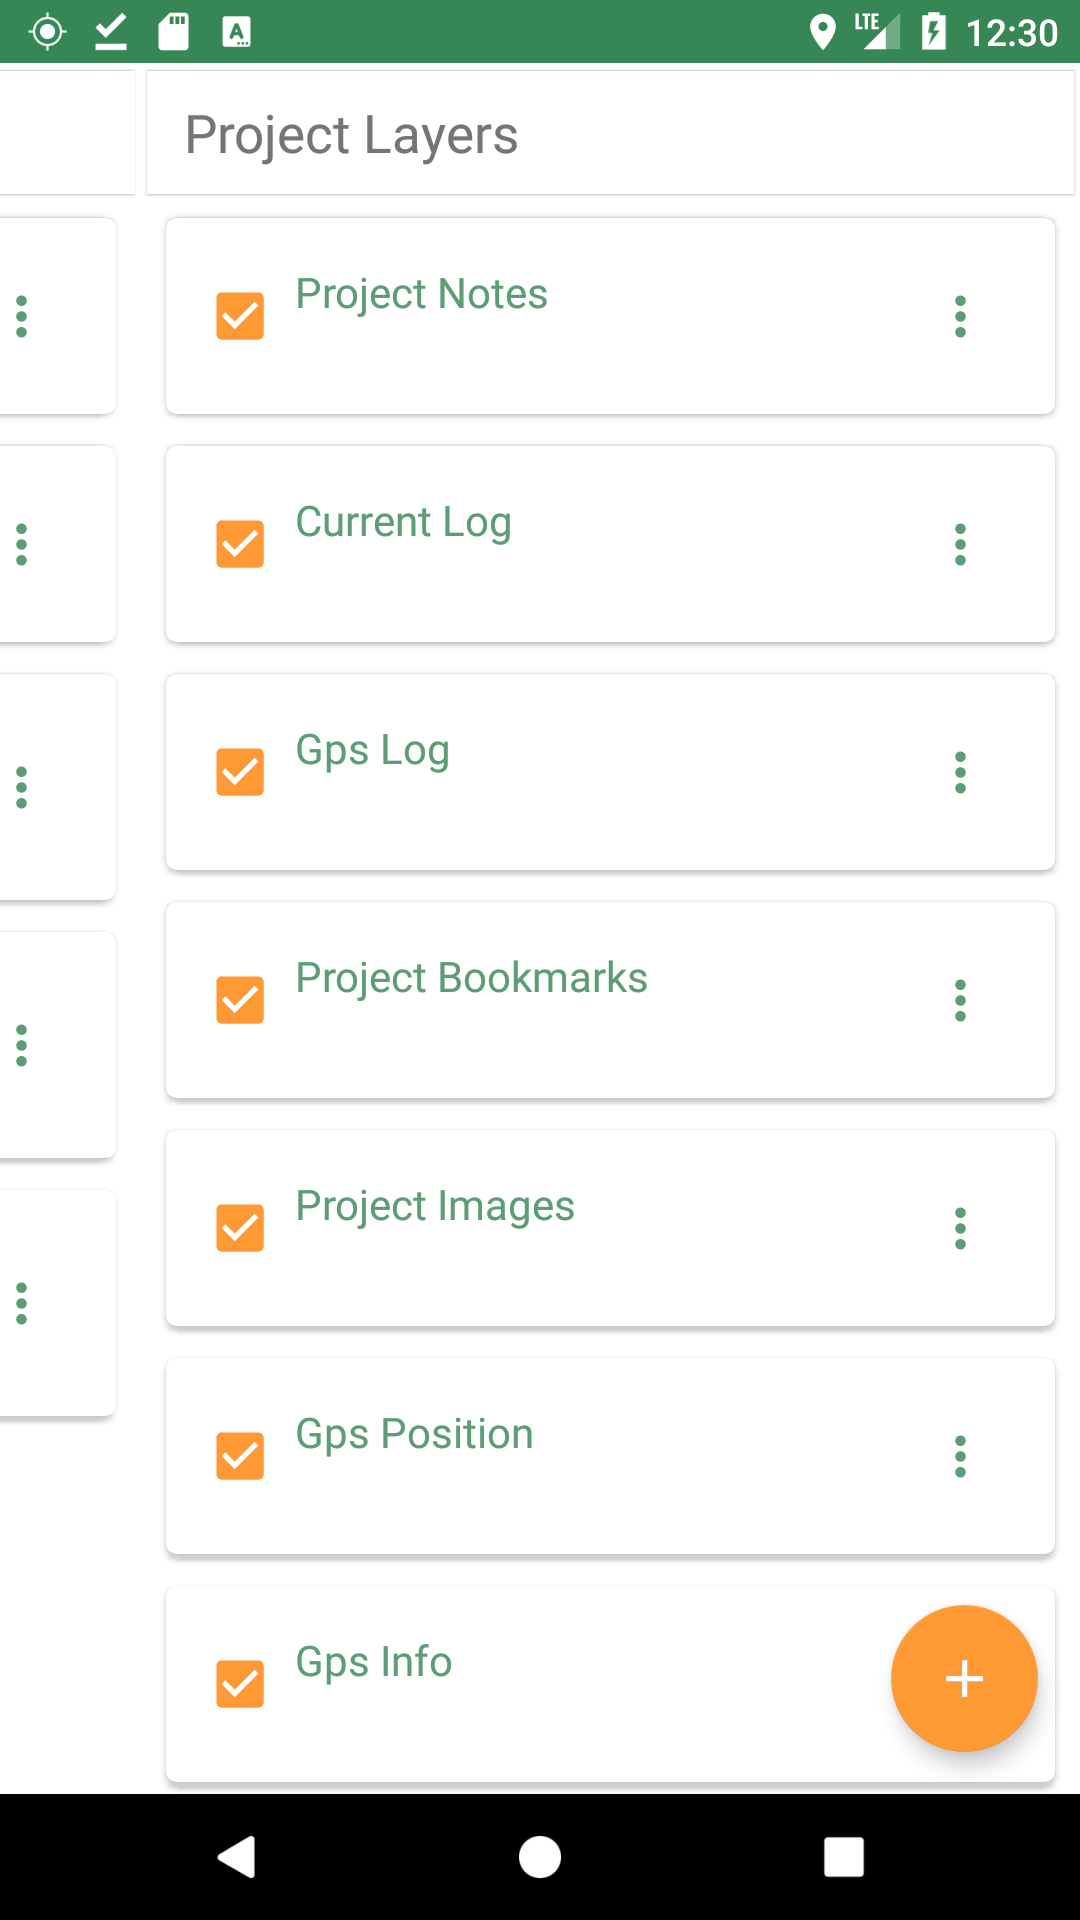
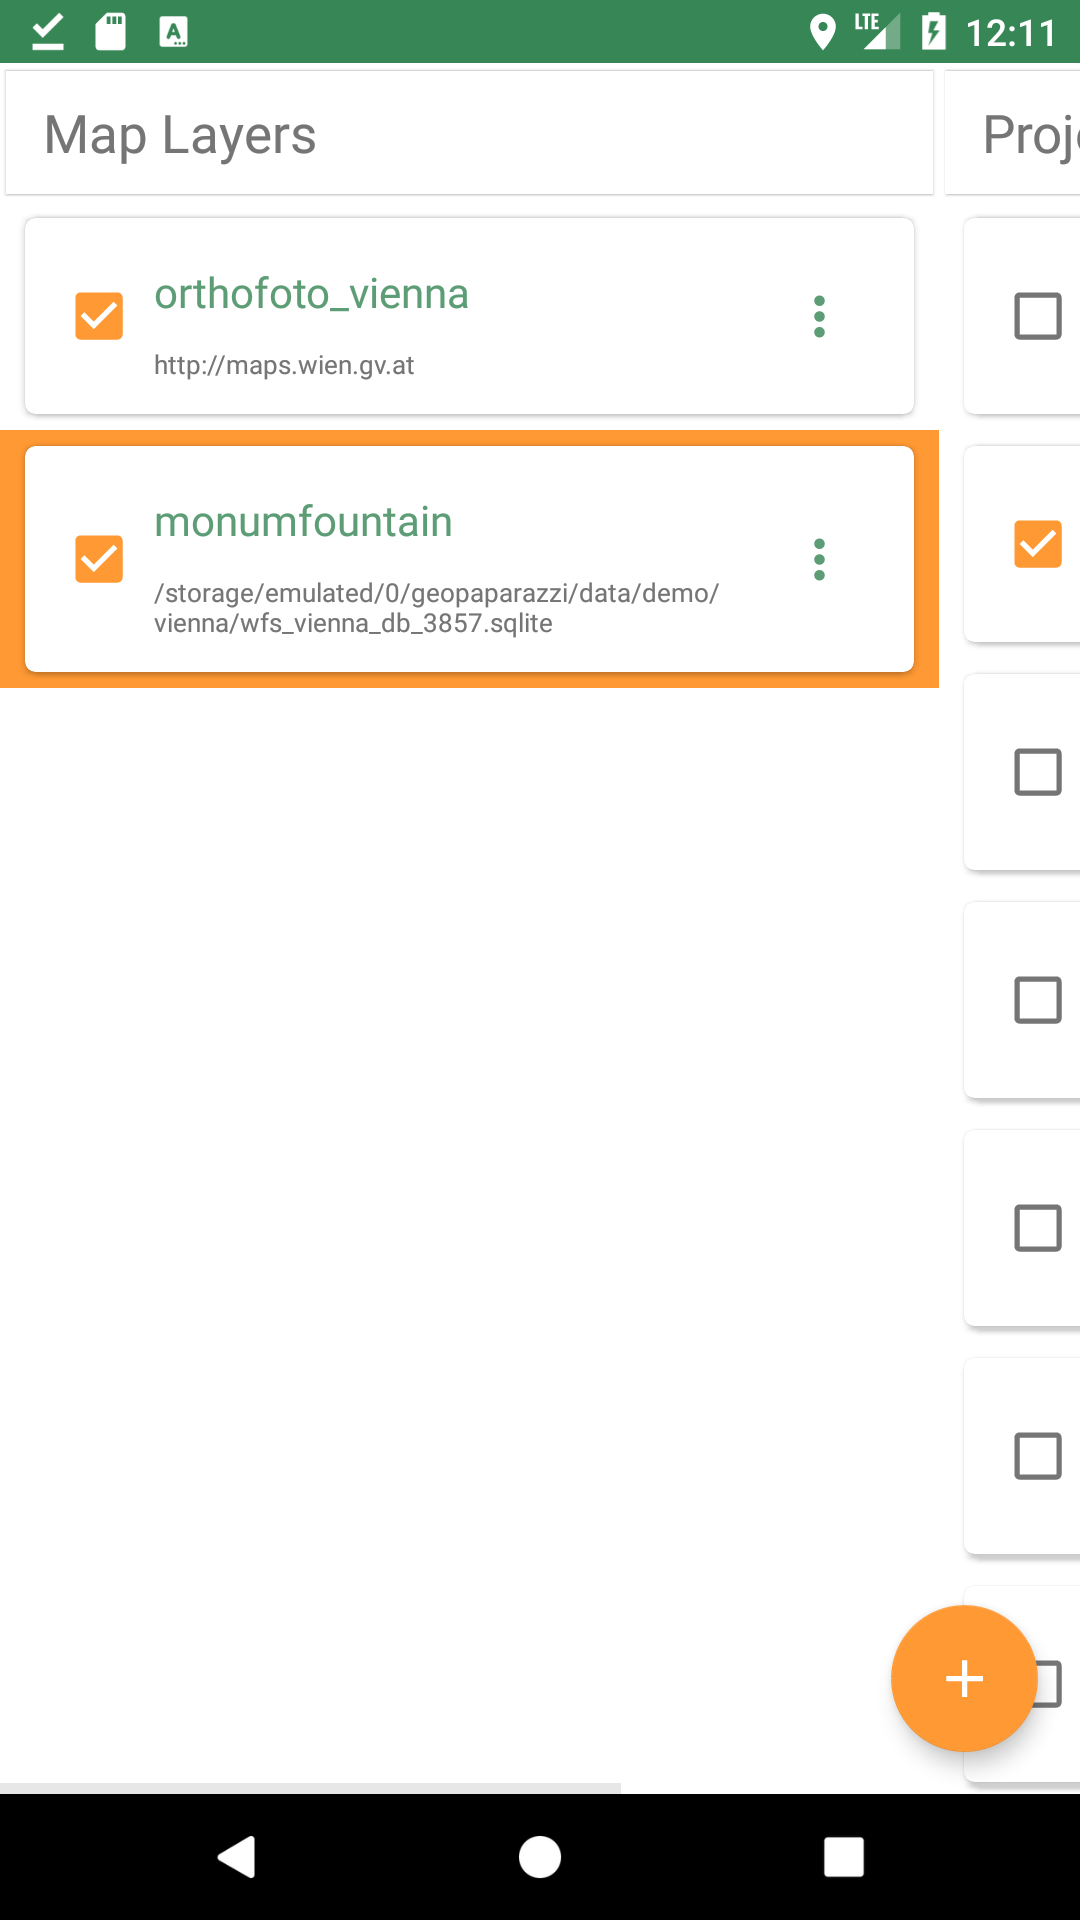
8. Layers List Dialog
The Layers List Dialog allows you to manipulate the layers on the Map View.
The layers are rendered on the map starting with the top layer on the list, so basemap layers should be placed at the top of the list.
You can manipulate the layers by:
-
Swiping to move between viewing the Map Layers list and the Project Layers list.
-
Using the checkbox in the layer item to turn the layer off and on in the Map View.
-
Doing a long press and drag a layer to move it in the ordered list.
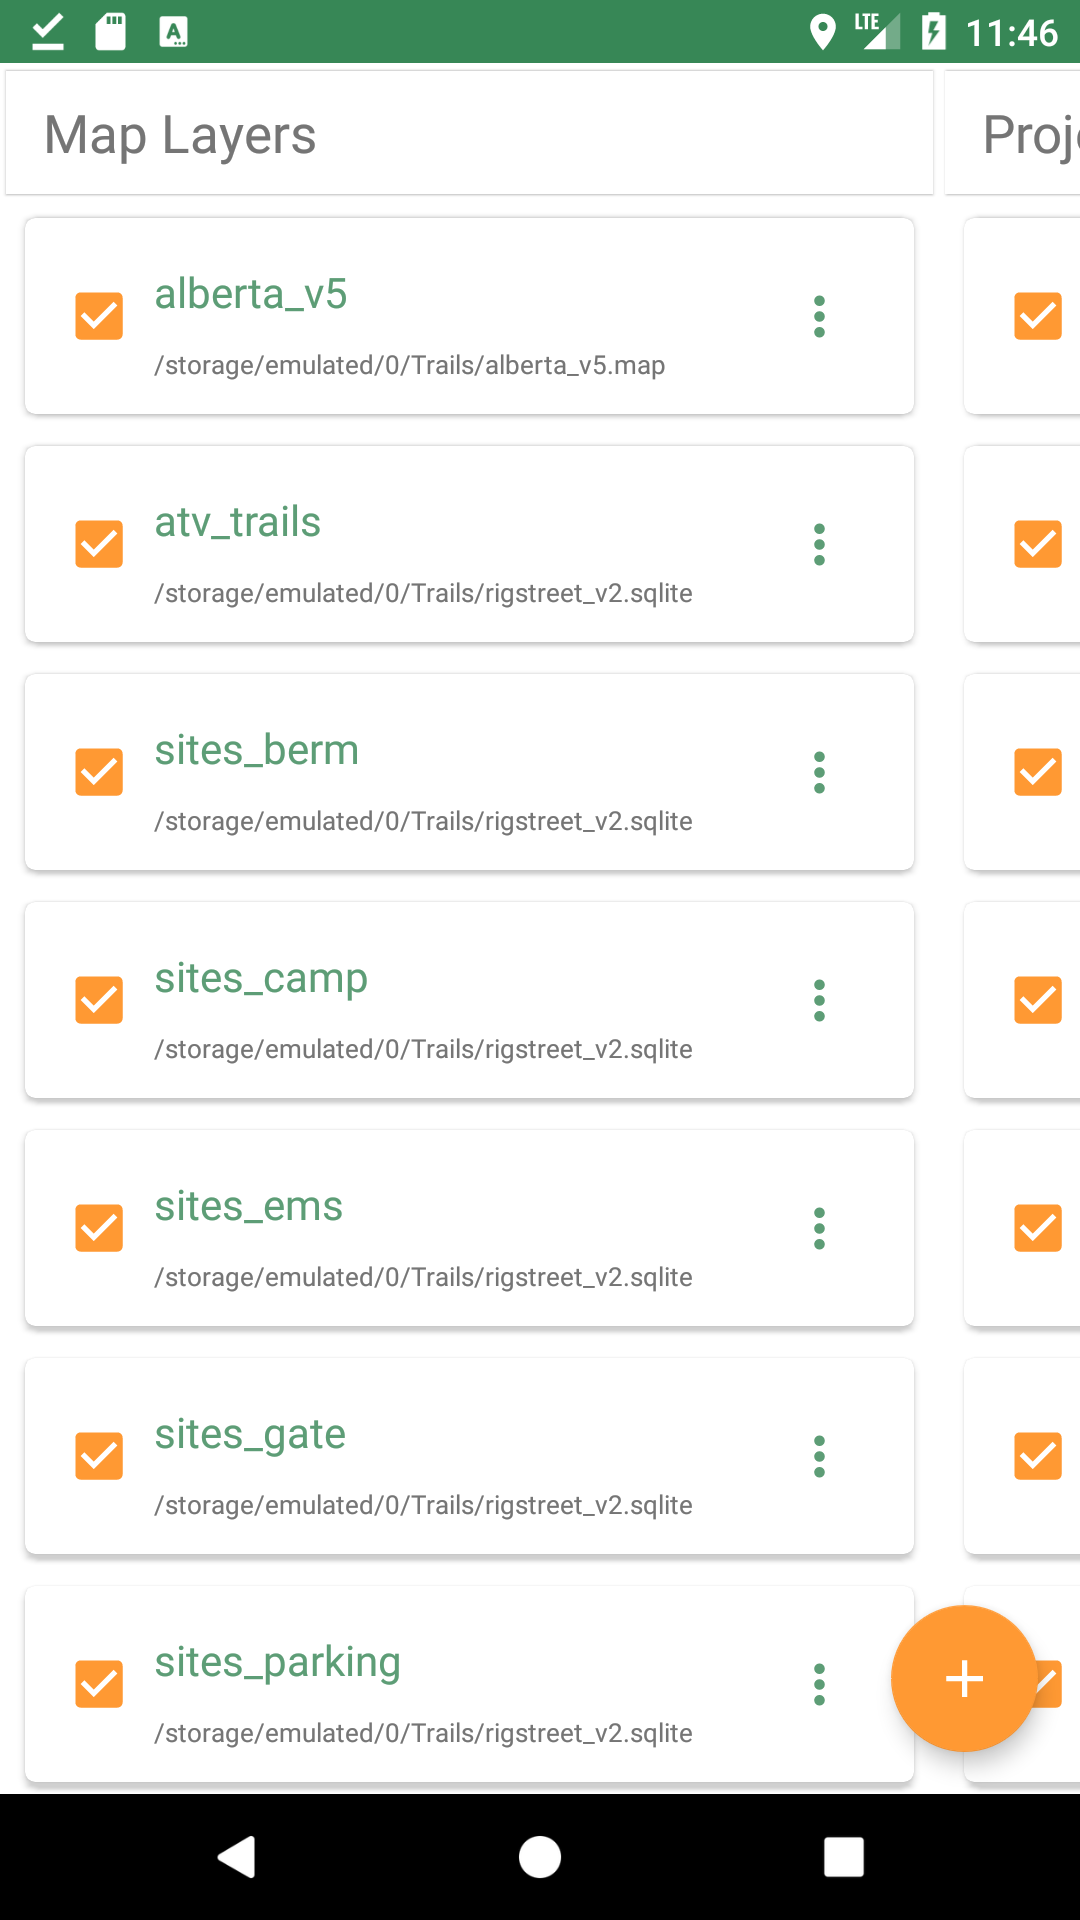
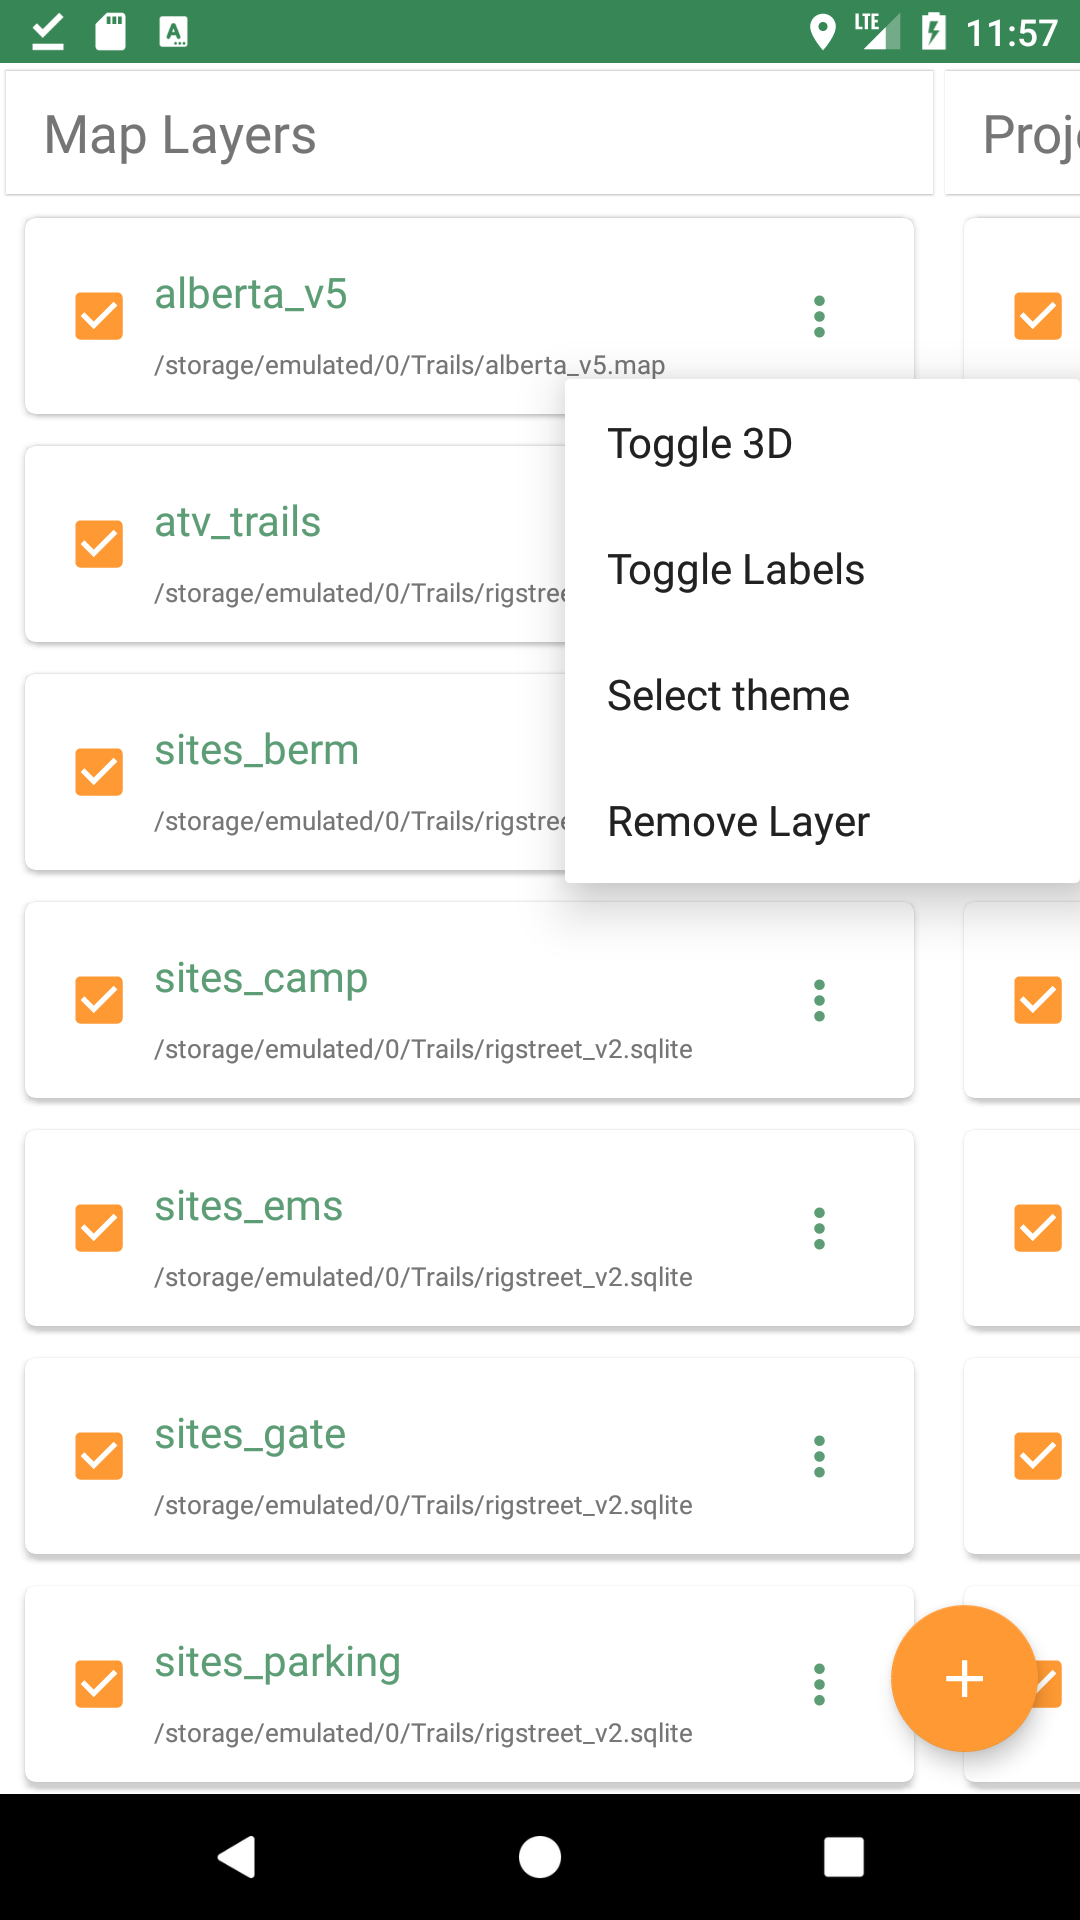
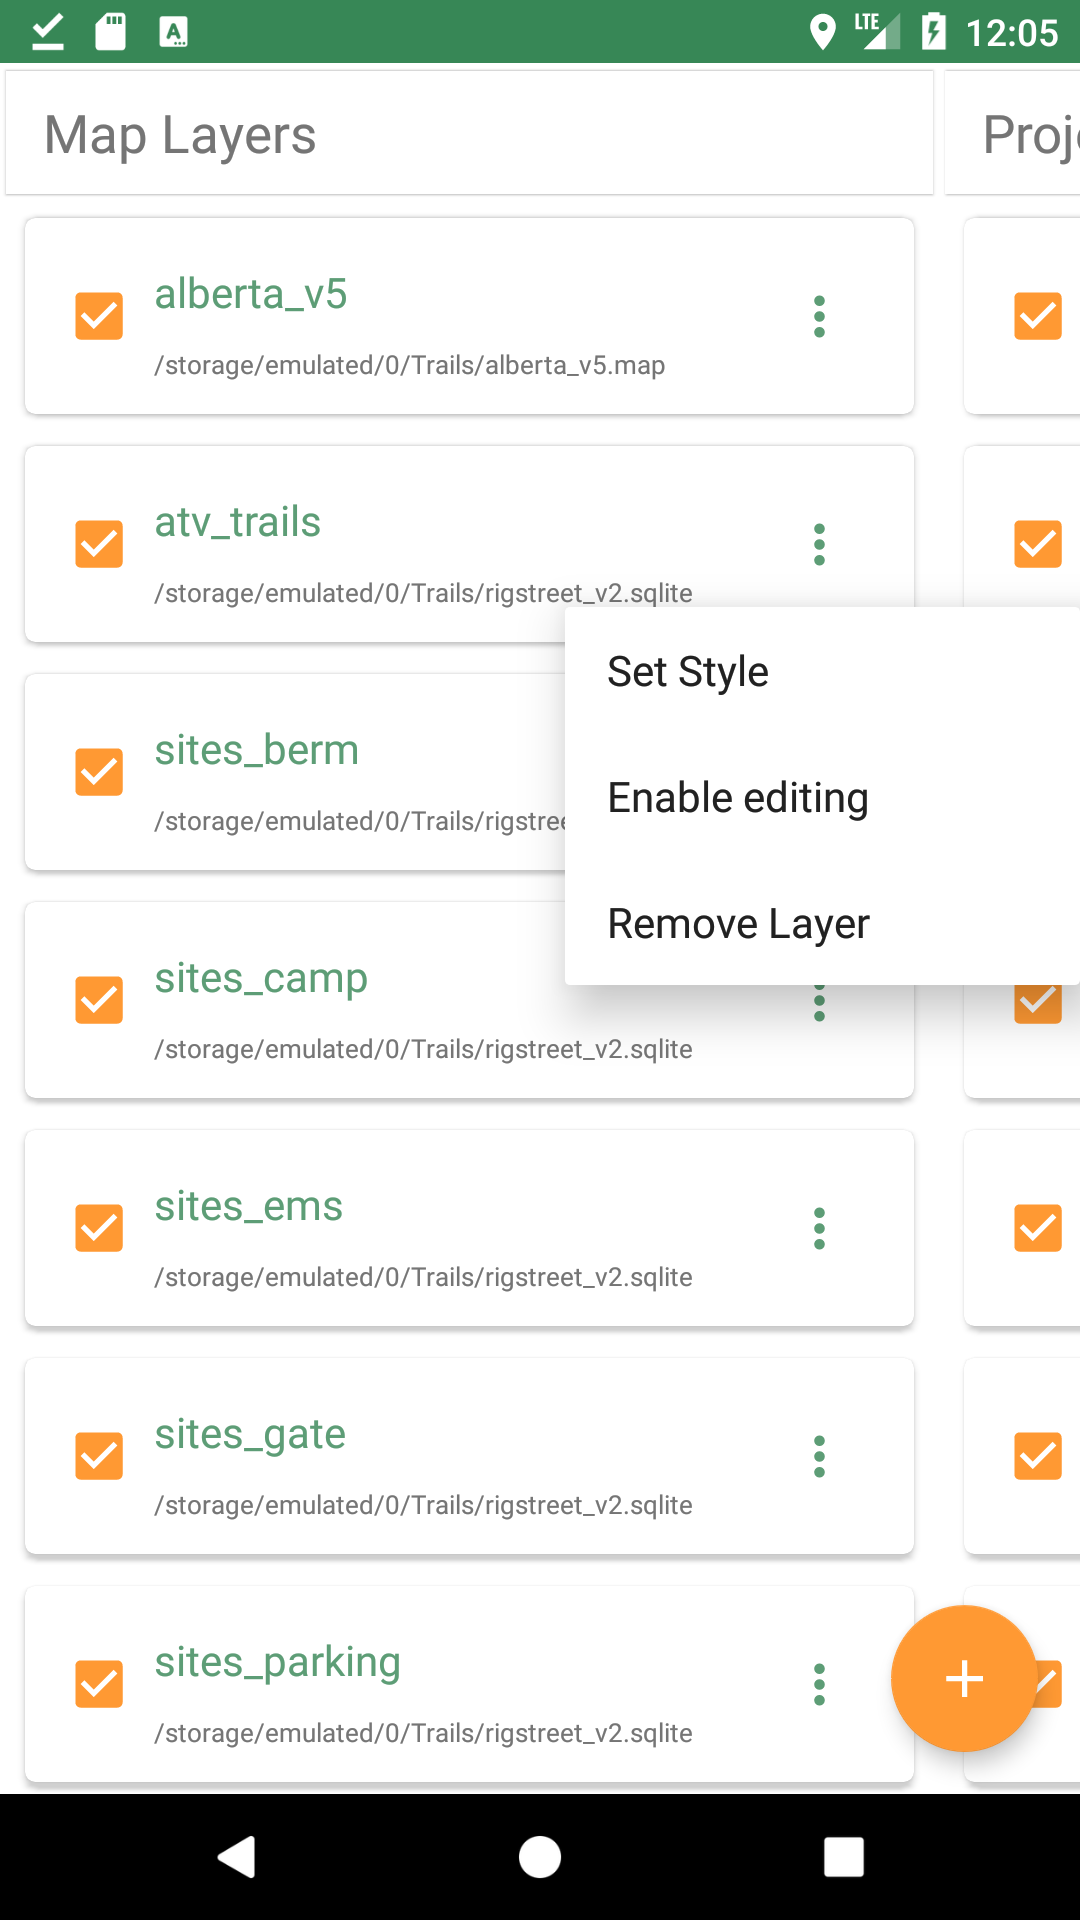
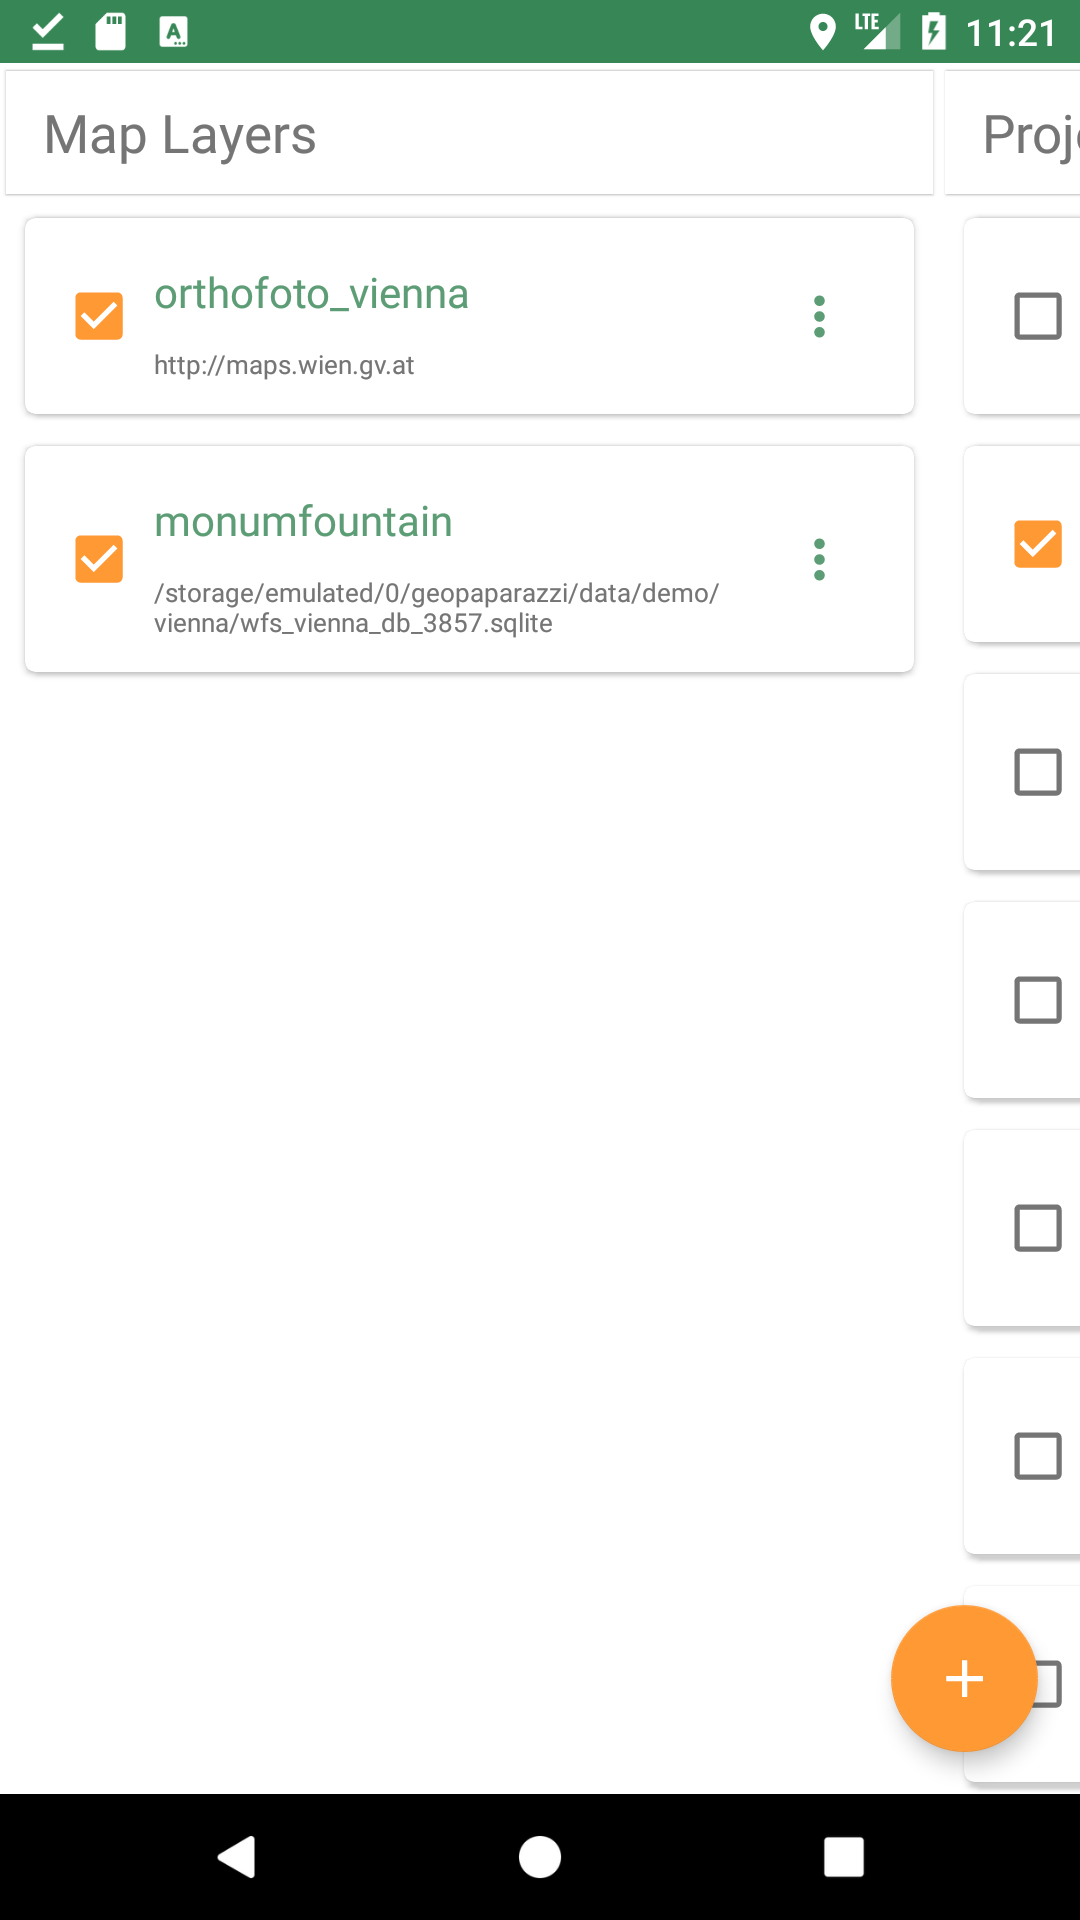
8.1. Map Layers
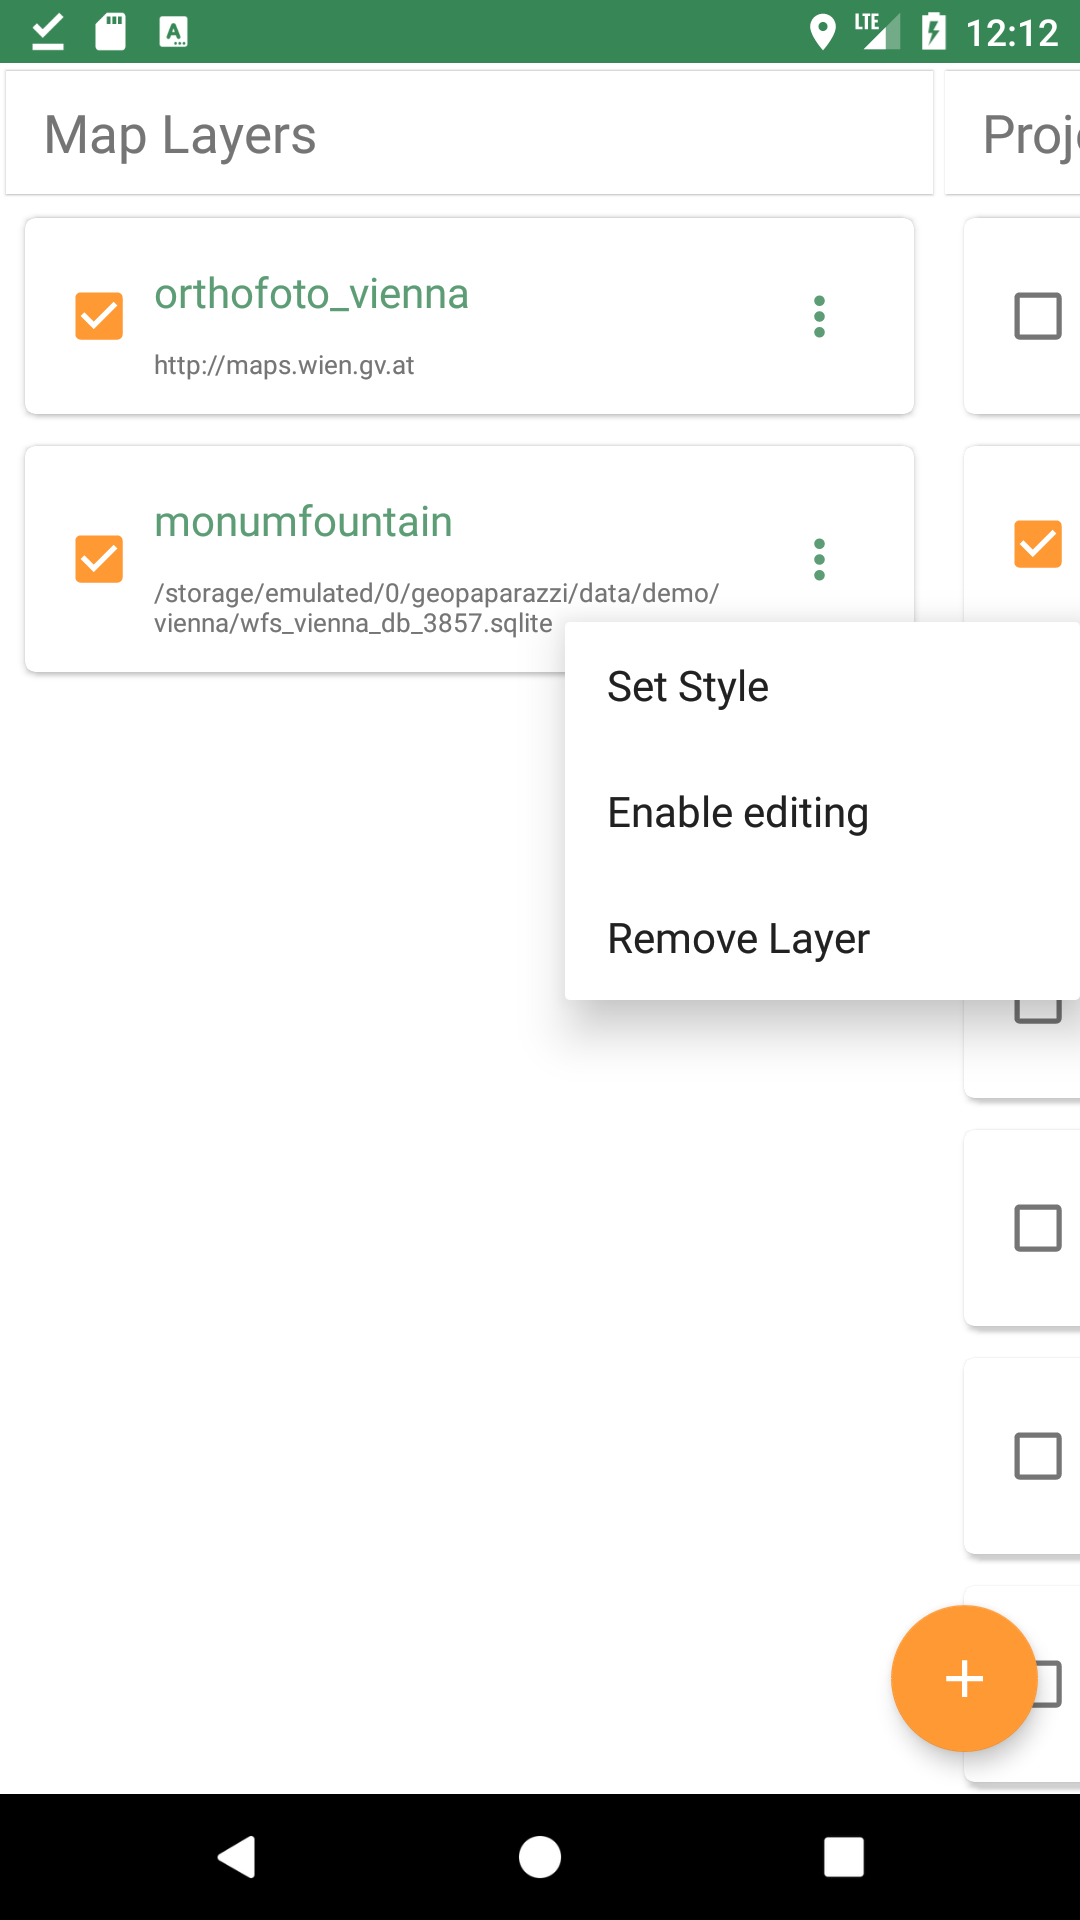
Map layer items will have a menu button on their right side, allow you to change the properties of the layer. The menu options will vary depending on the type of data source for that layer.
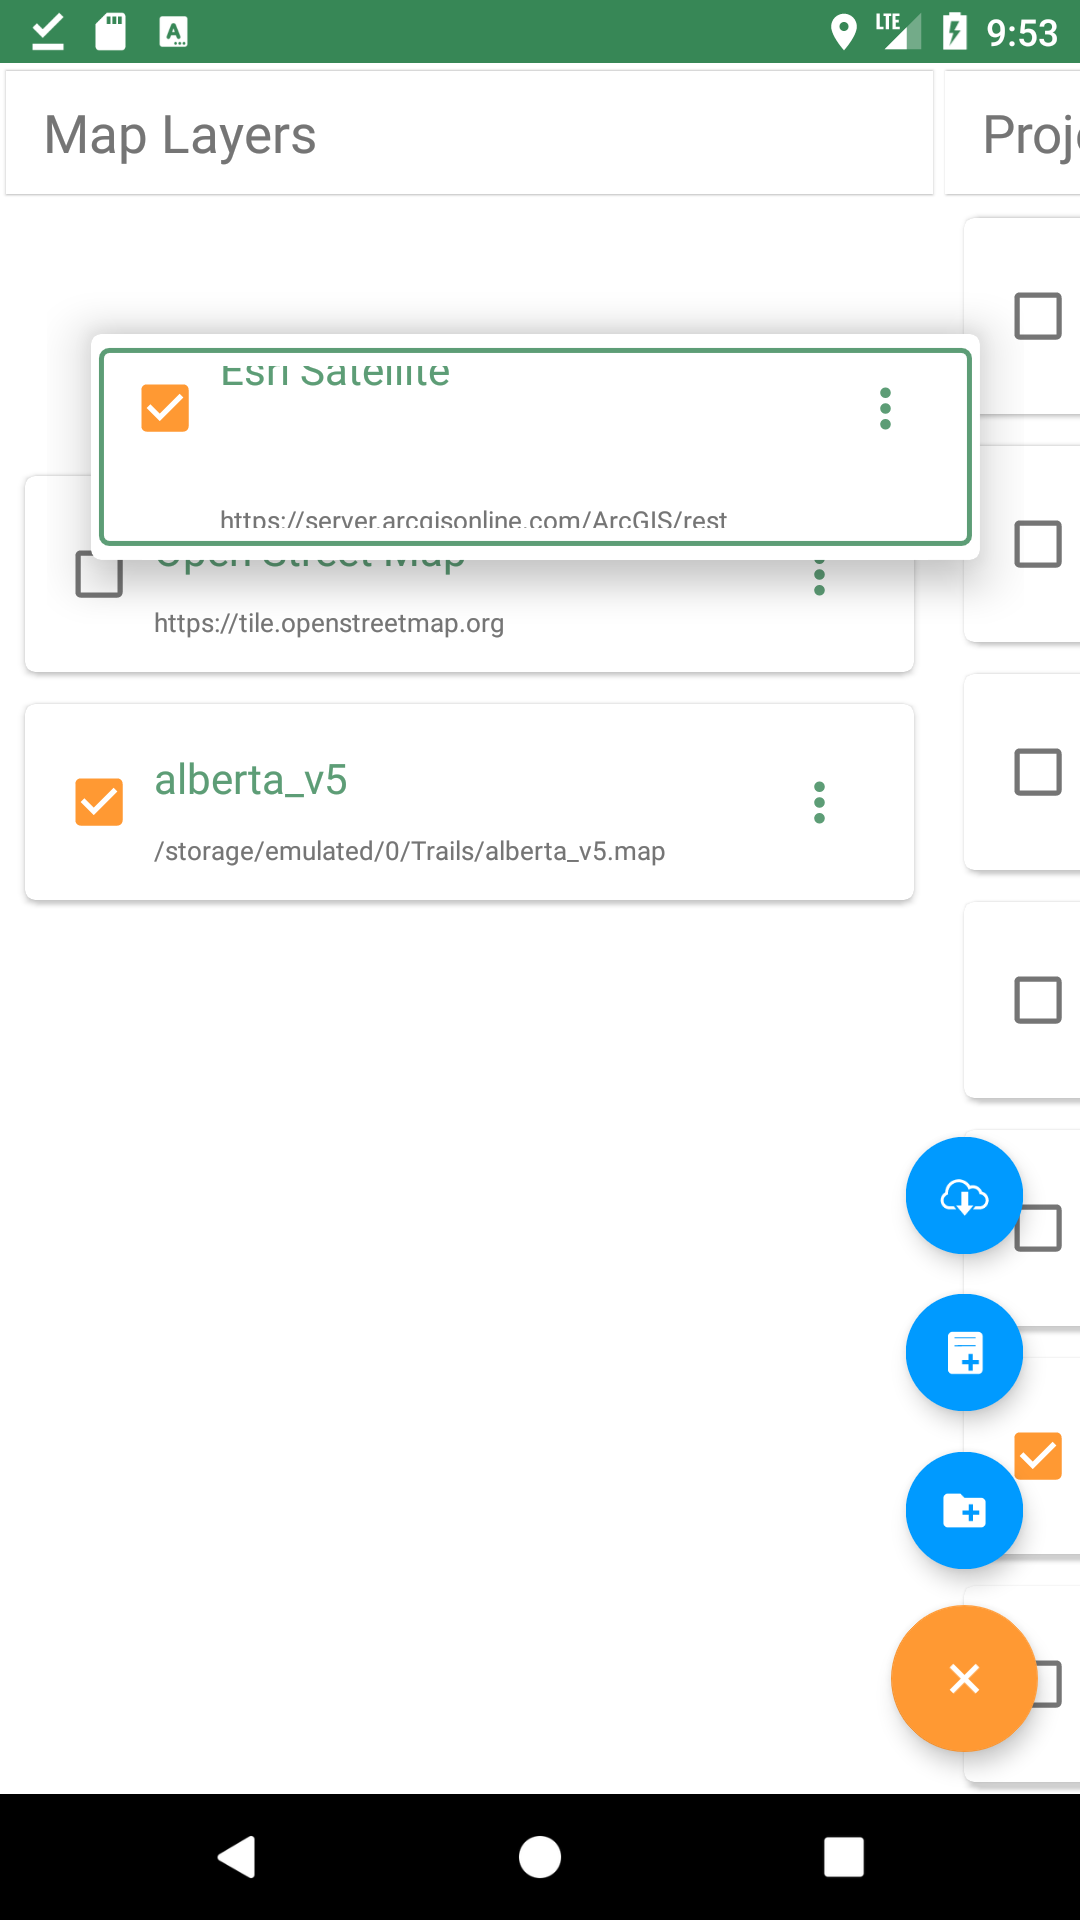
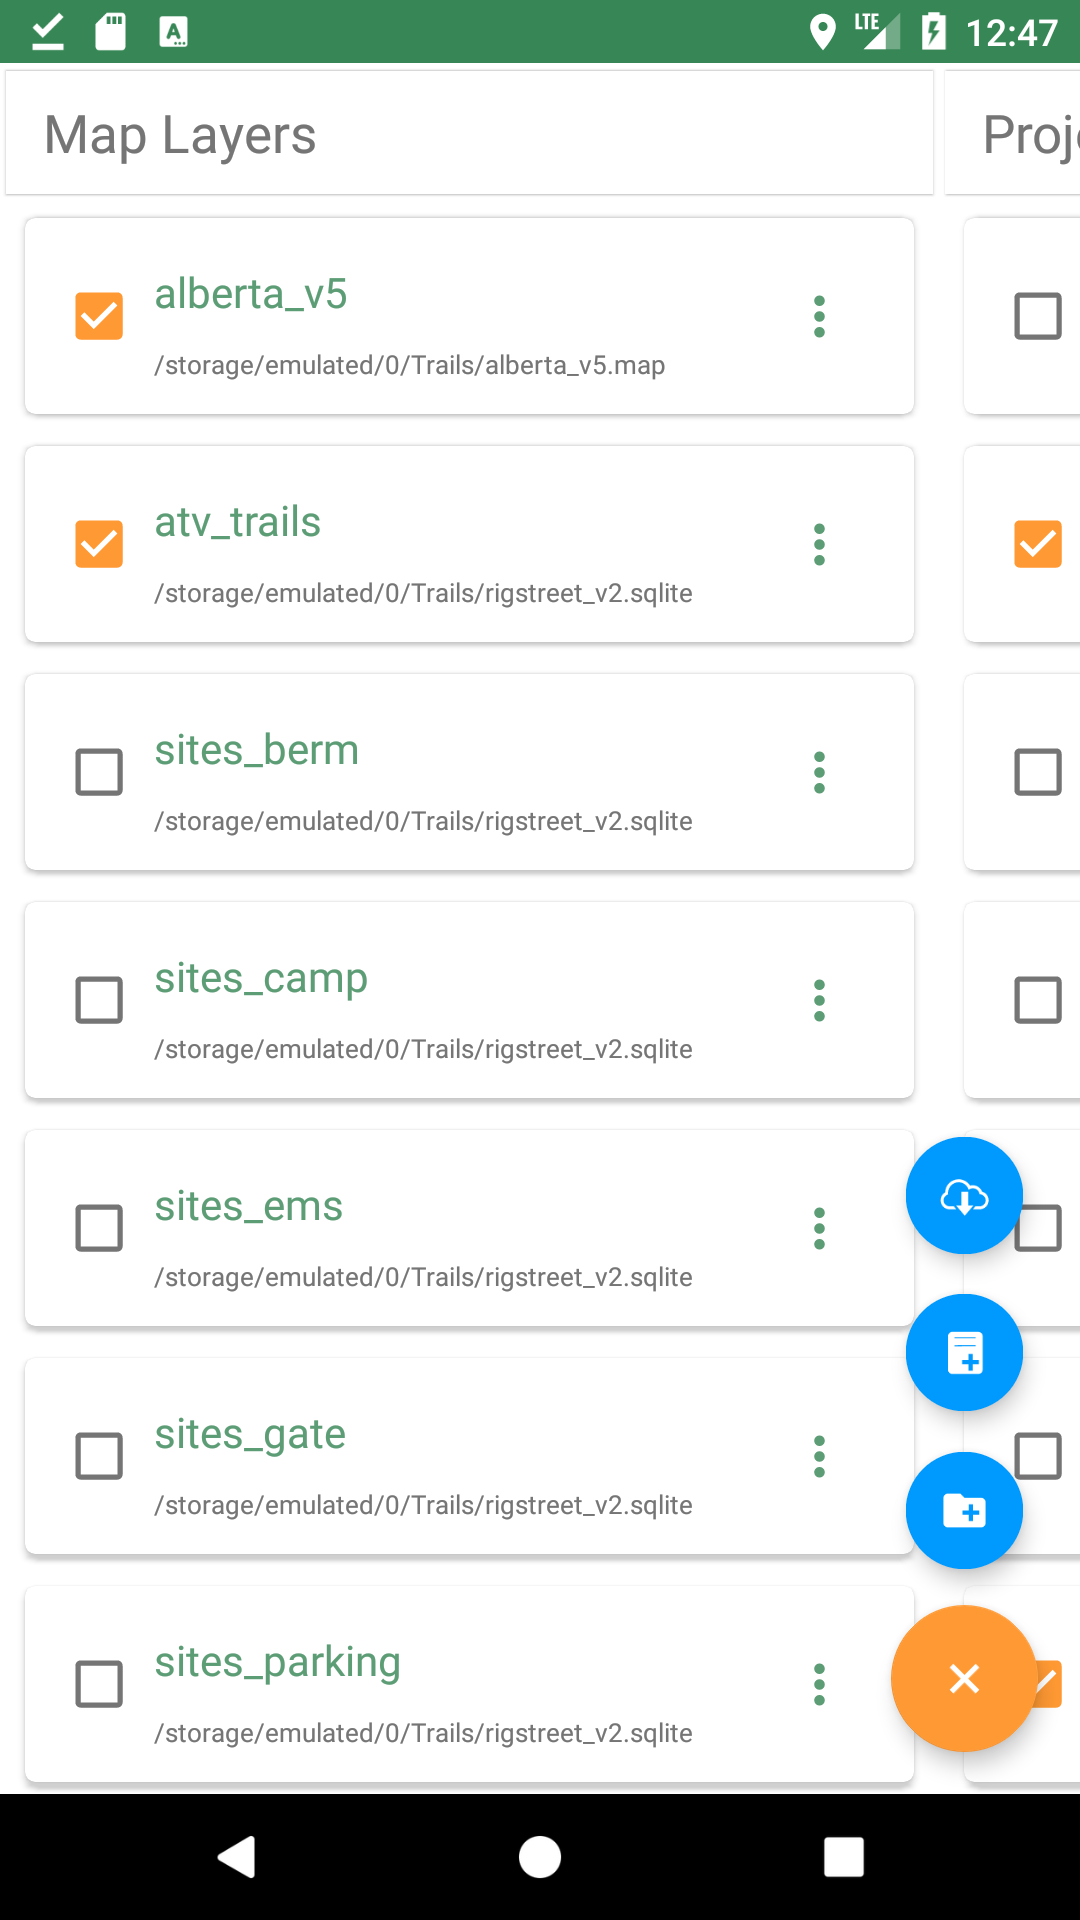
8.1.1. Adding Map Layers
You can add Map Layers be using Add Map Layer ("+") button in the lower right of the Layer List Dialog. This will show three blue icons allowing you add different types of map layers.
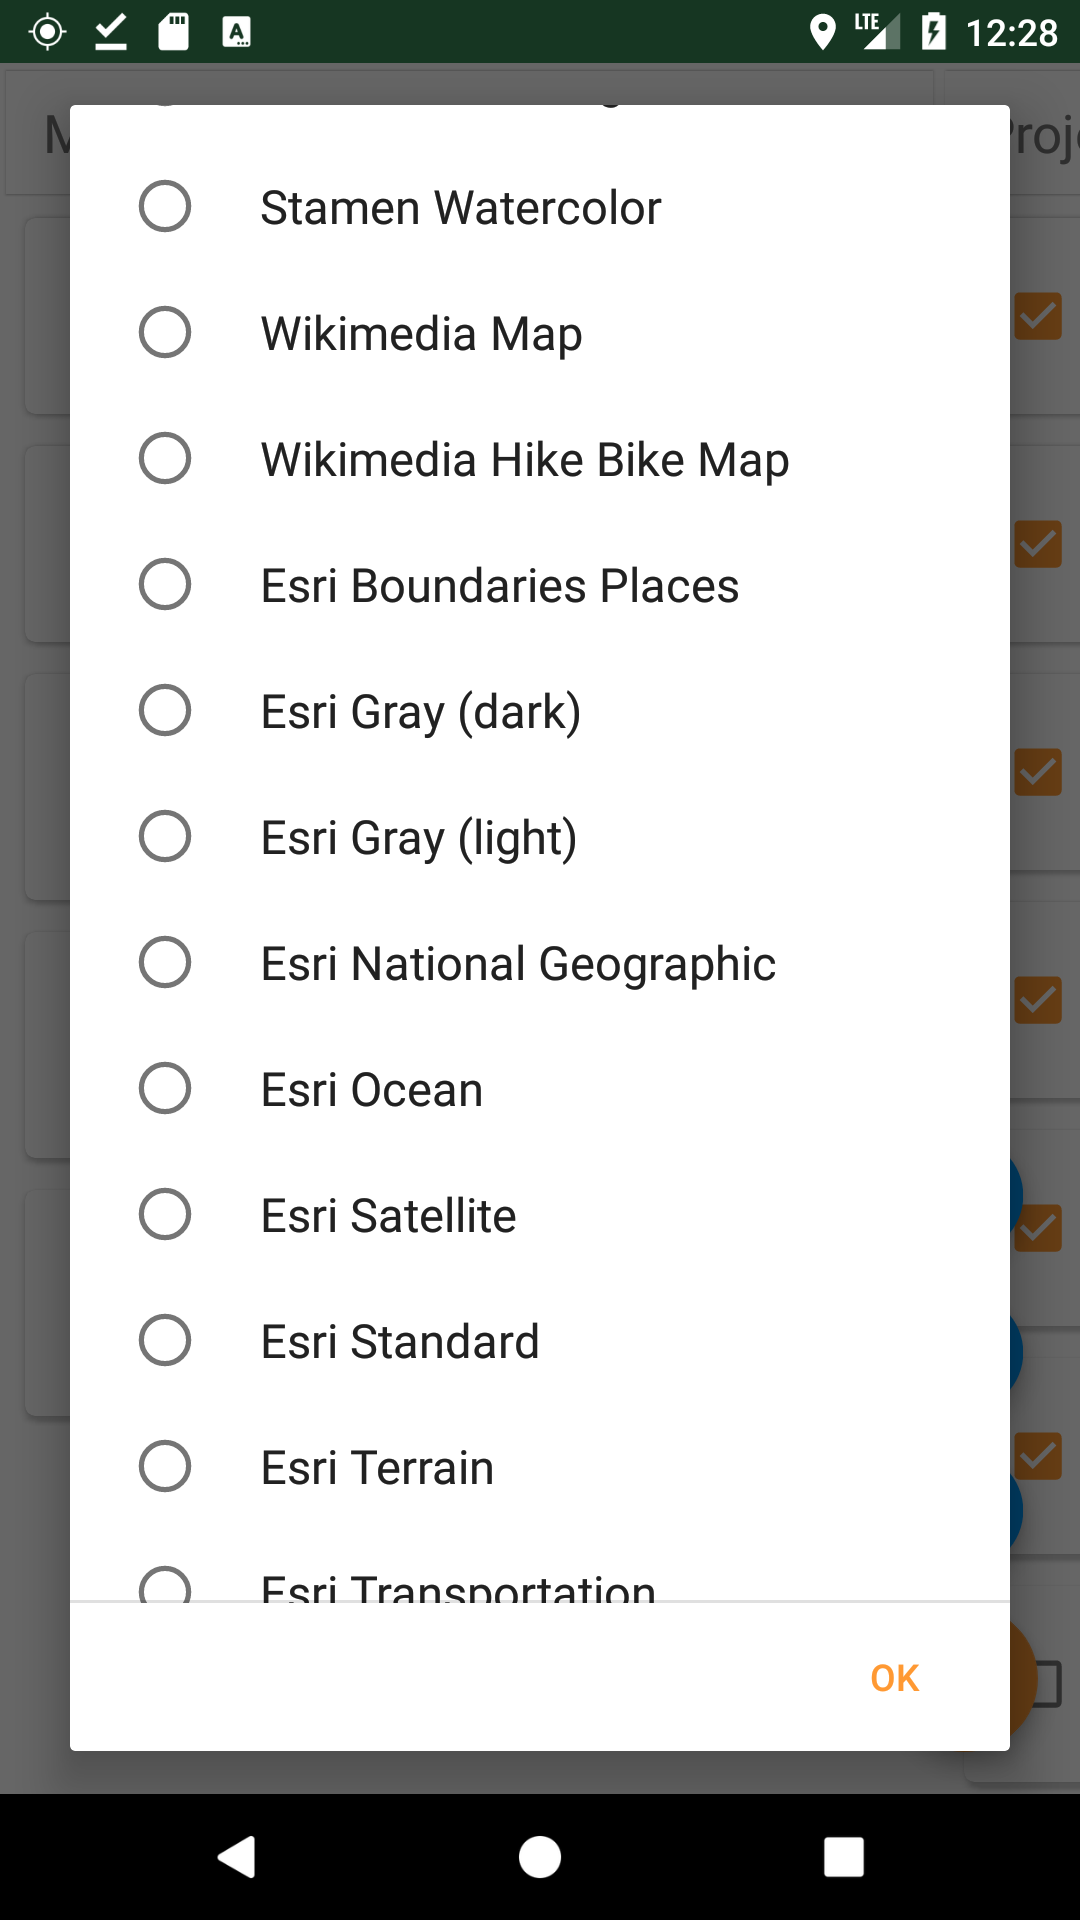
Cloud Layers
Cloud layers are hard-coded layers referencing Cloud servers of mapping tiles. To add a Cloud layer, select a layer from the menu, press OK. If the Cloud server is available, the layer will be added. After adding a Cloud layer, you can move it to be rendered first by long pressing the layer item and dragging it to the top of the list.
Local/Offline Layers
You can add Map Layers from a local data file. This can be
-
Mapsforge files (.map)
-
Spatialite files (.sqlite)
-
mapurl files (.mapurl), with type=google and type=tms only; type=wms is not supported
-
mbtiles (.mbtiles), raster only; vector is not currently supported
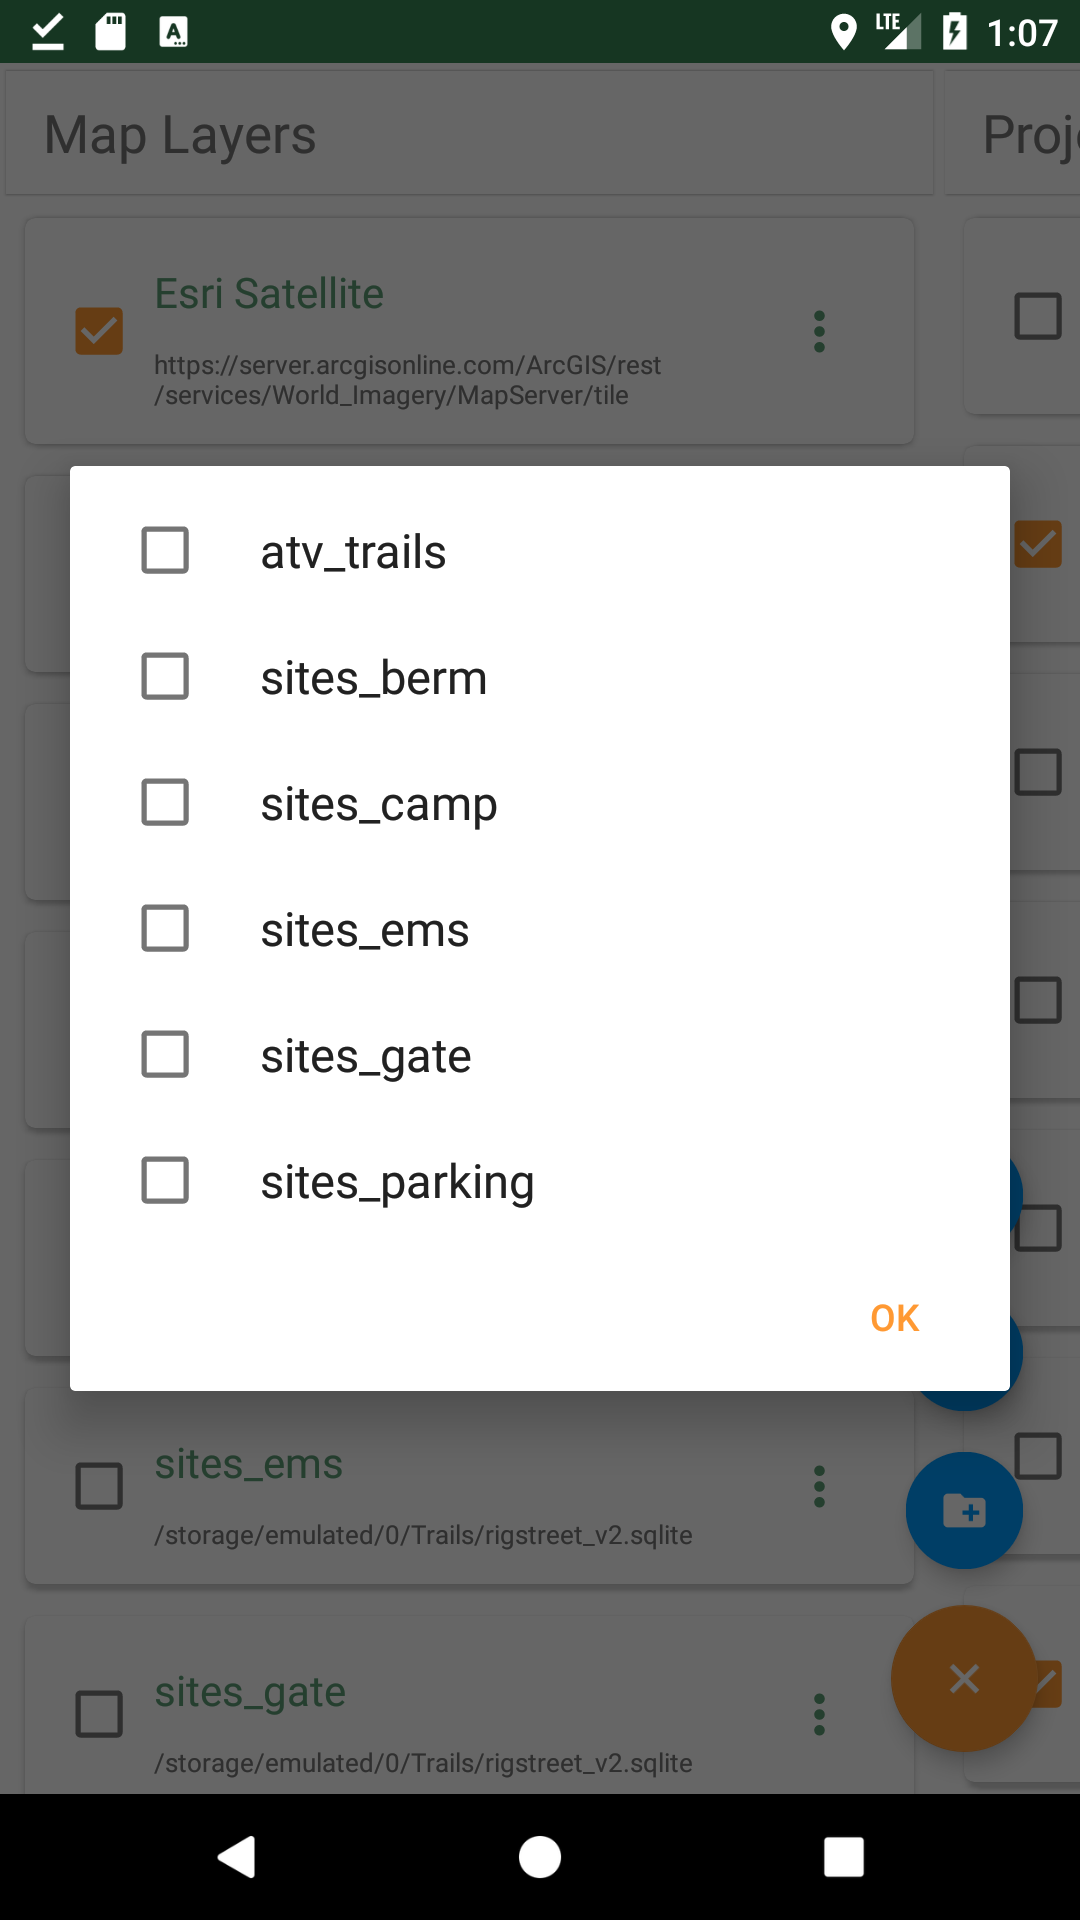
Selecting a Spatialite file will display a list of spatial tables in the Spatialite database; each one you select will be a separate layer.
9. Vector Editing
In the Map View you can create, view, and edit the attributes of point, line and polygon features held in a Spatialite database. You cannot edit the geometry of existing features. You cannot edit geographic features in a Basemap. Editing a Project’s Notes, Bookmarks, and GPS logs are covered elsewhere in this manual.
If you need to create a Spatialite database, press the Import button on the Main View dashboard, and press Default Database (take note of the file name of your new database).
You can use your existing Spatialite databases by attaching them to the Map View by using the Map View menu item Spatialite data list.
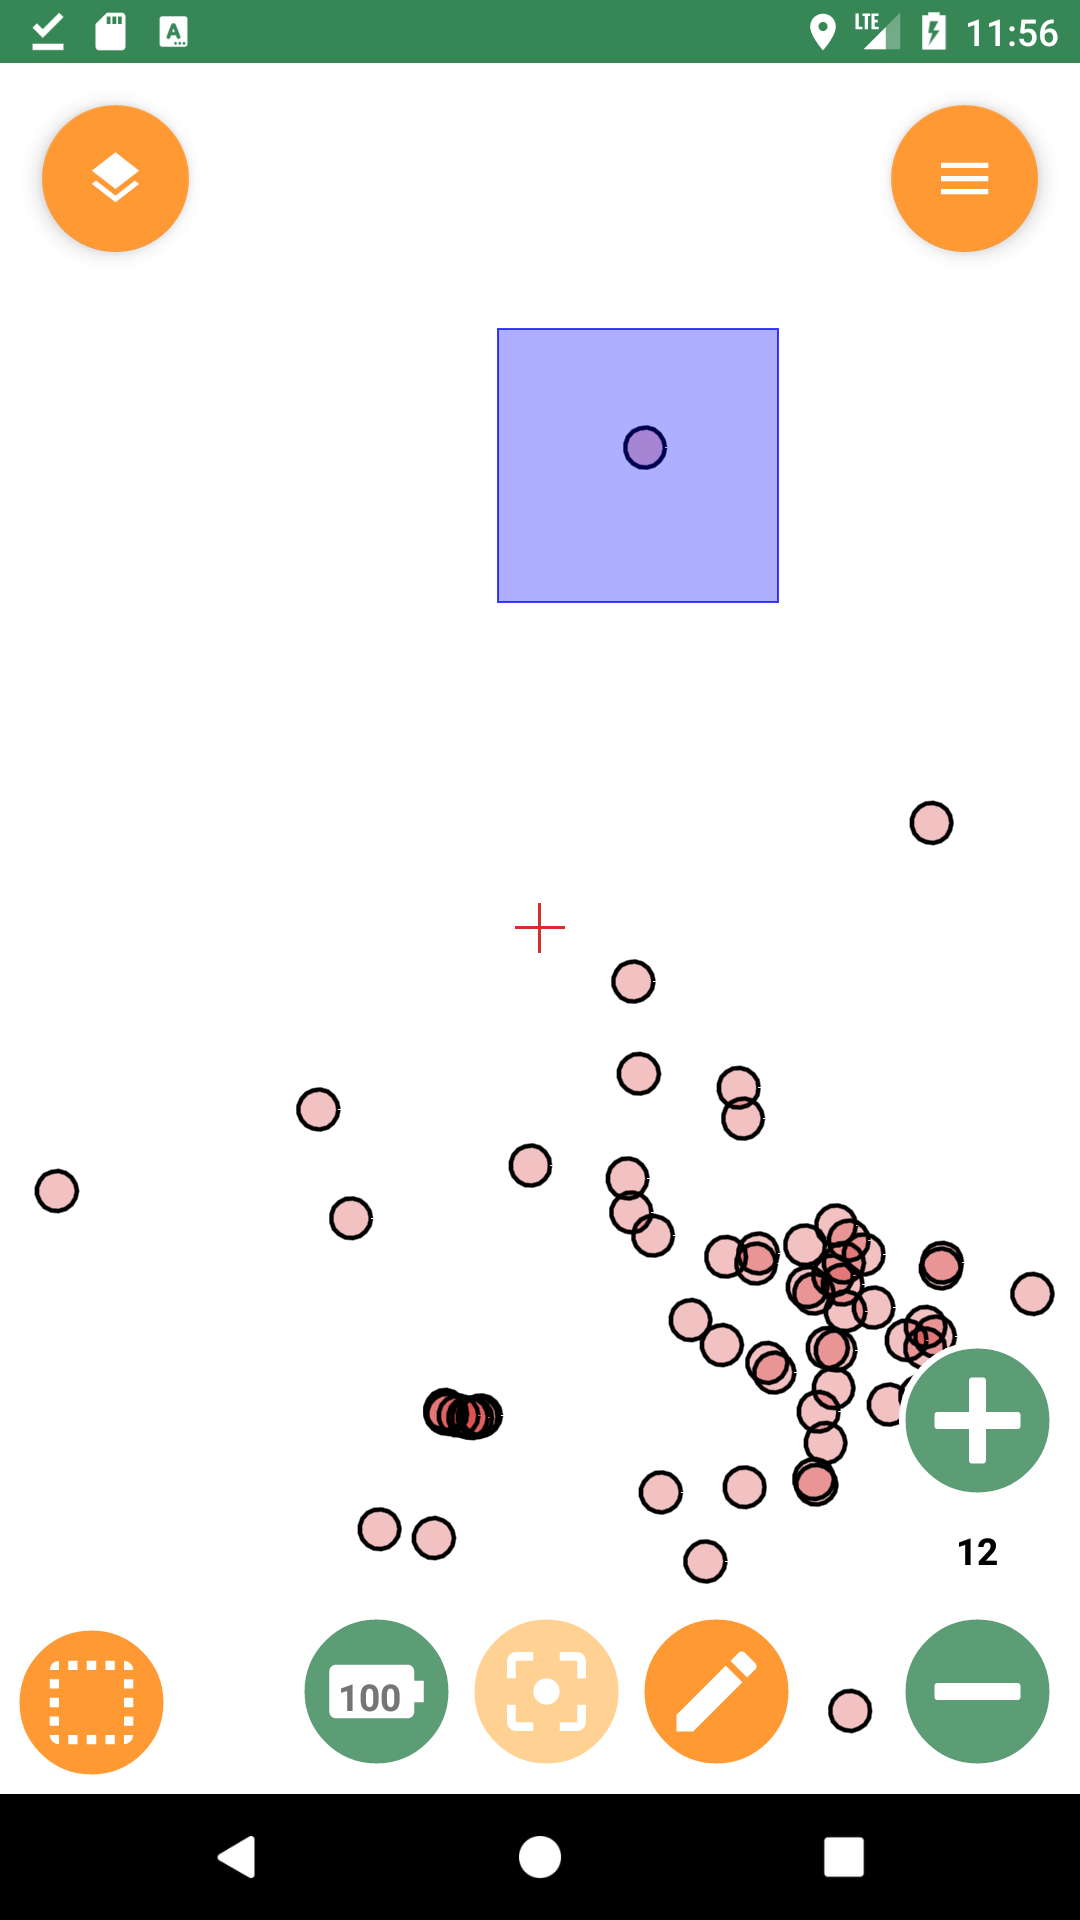
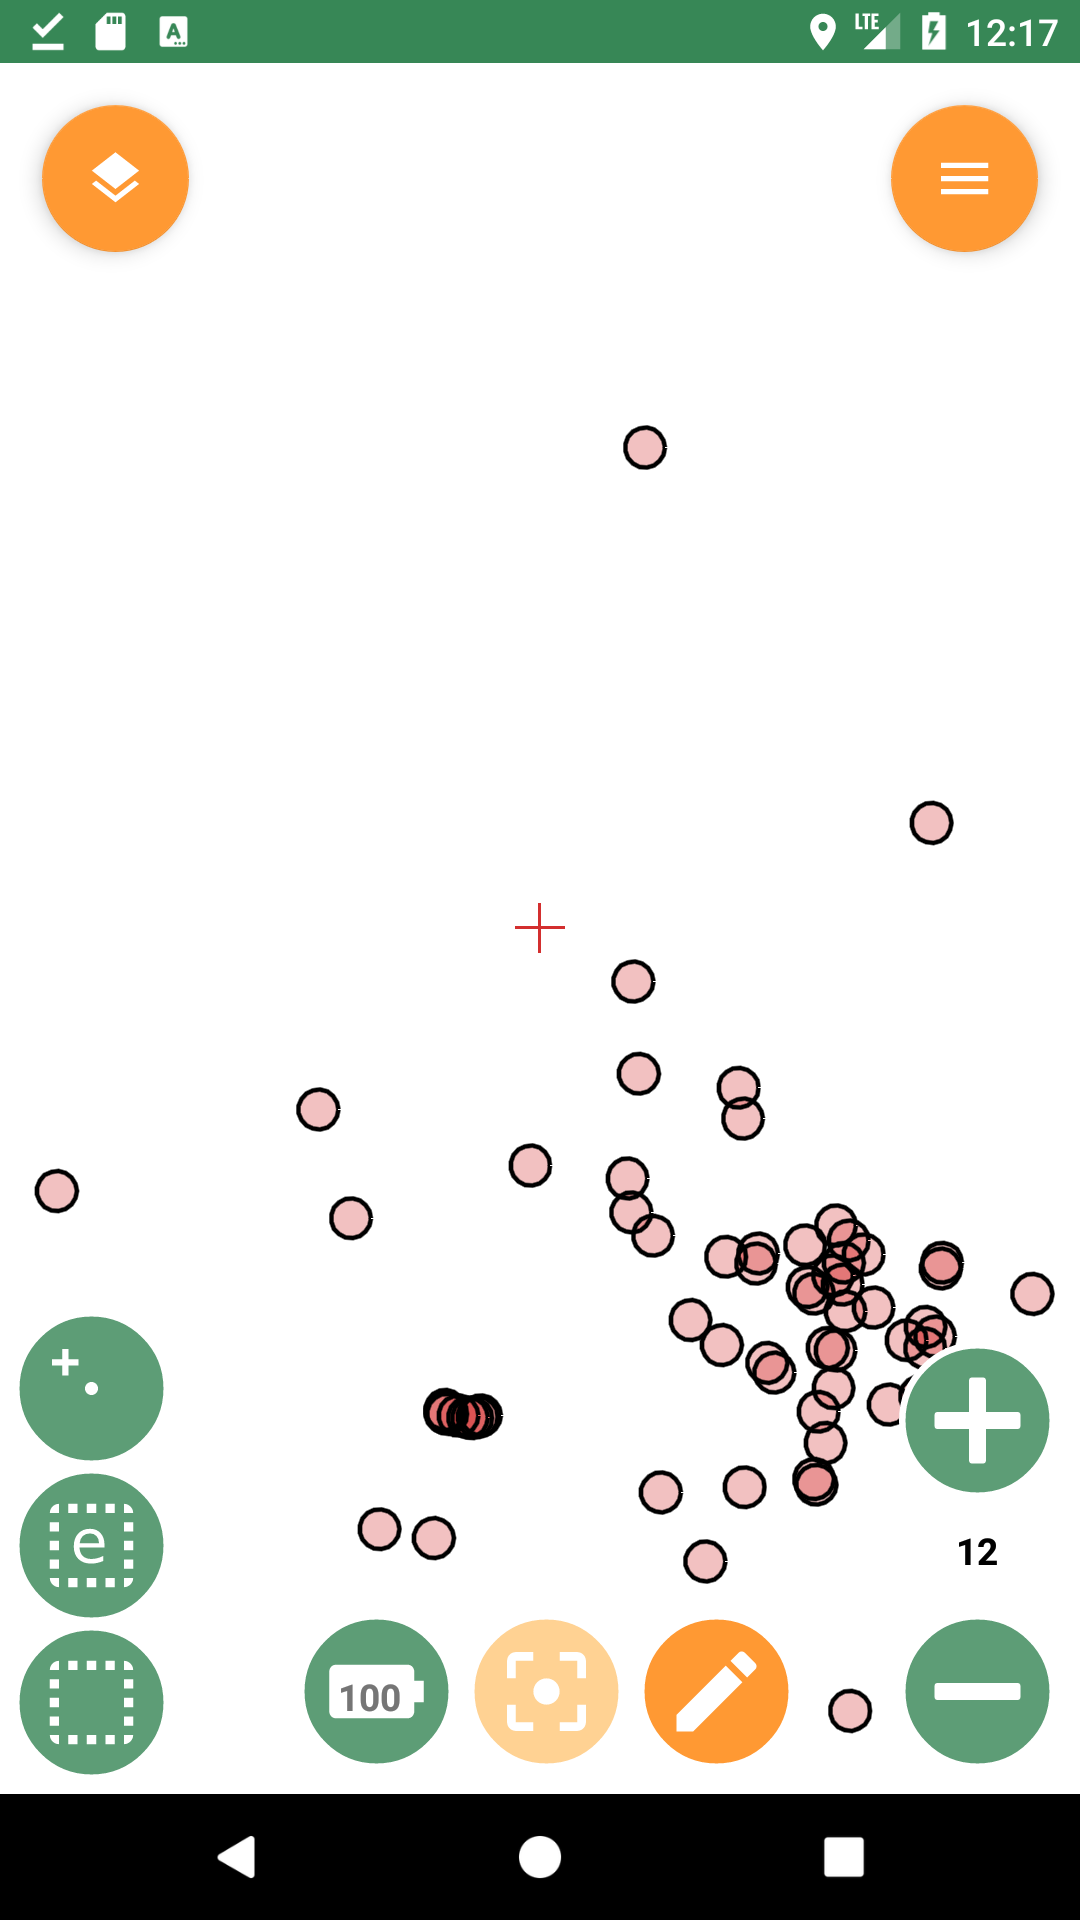
9.1. Viewing Feature Attributes
After adding a Spatialite database in the Map View Layers dialog, turn on the viewing of layers by checking the box next to the layer name.
Back on the Map View, you will see the features (you may need to pan and zoom to them). To view the attribute values of features, press the Edit Tool button (it looks like a pencil) on the lower right of the Map View. That will cause the Feature Select button to appear on the lower left.
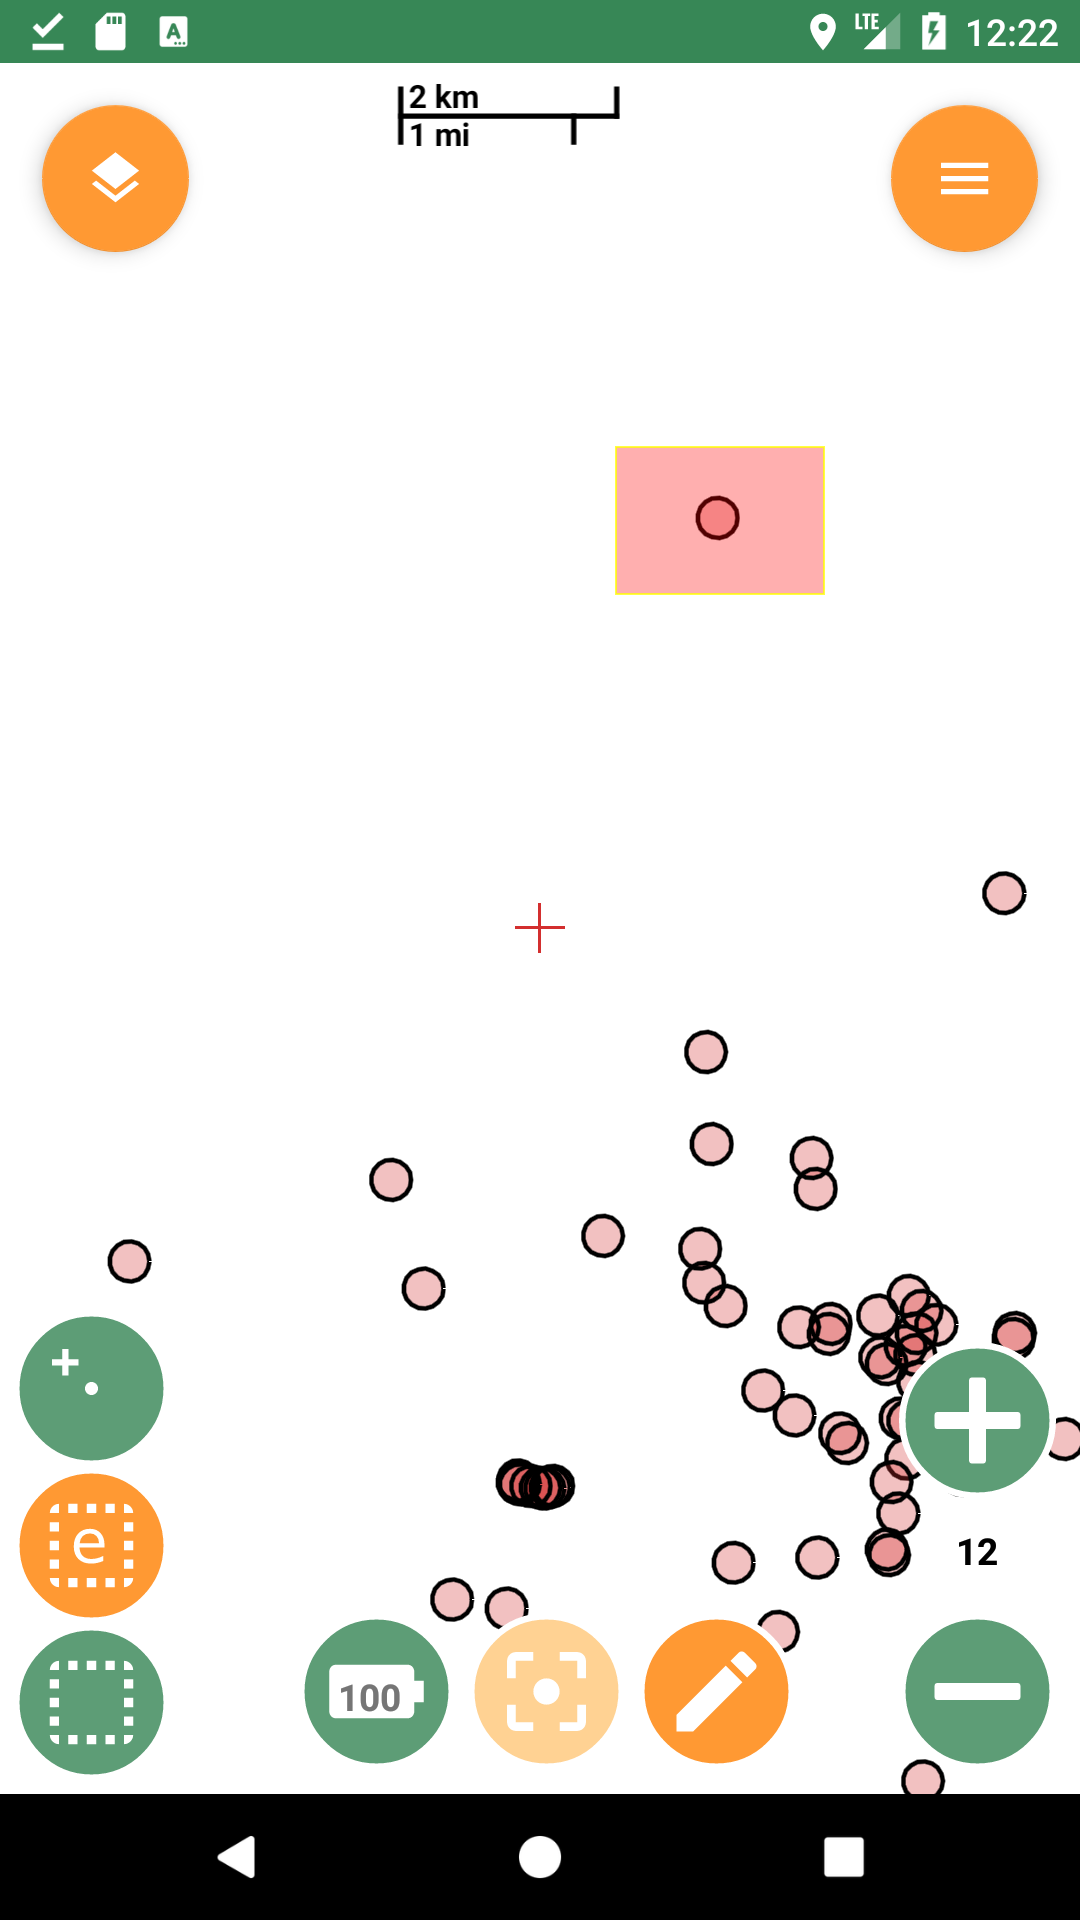
Press the Select button then press and drag on the Map View to make a box surrounding the features you are interested in.
| To exit the Map View the Edit Tool button must be un-selected. |
If there are any features in the box a Features dialog will appear showing the attribute names and values. If you’ve selected more than one feature, you can show their attributes by swiping on the Features dialog.
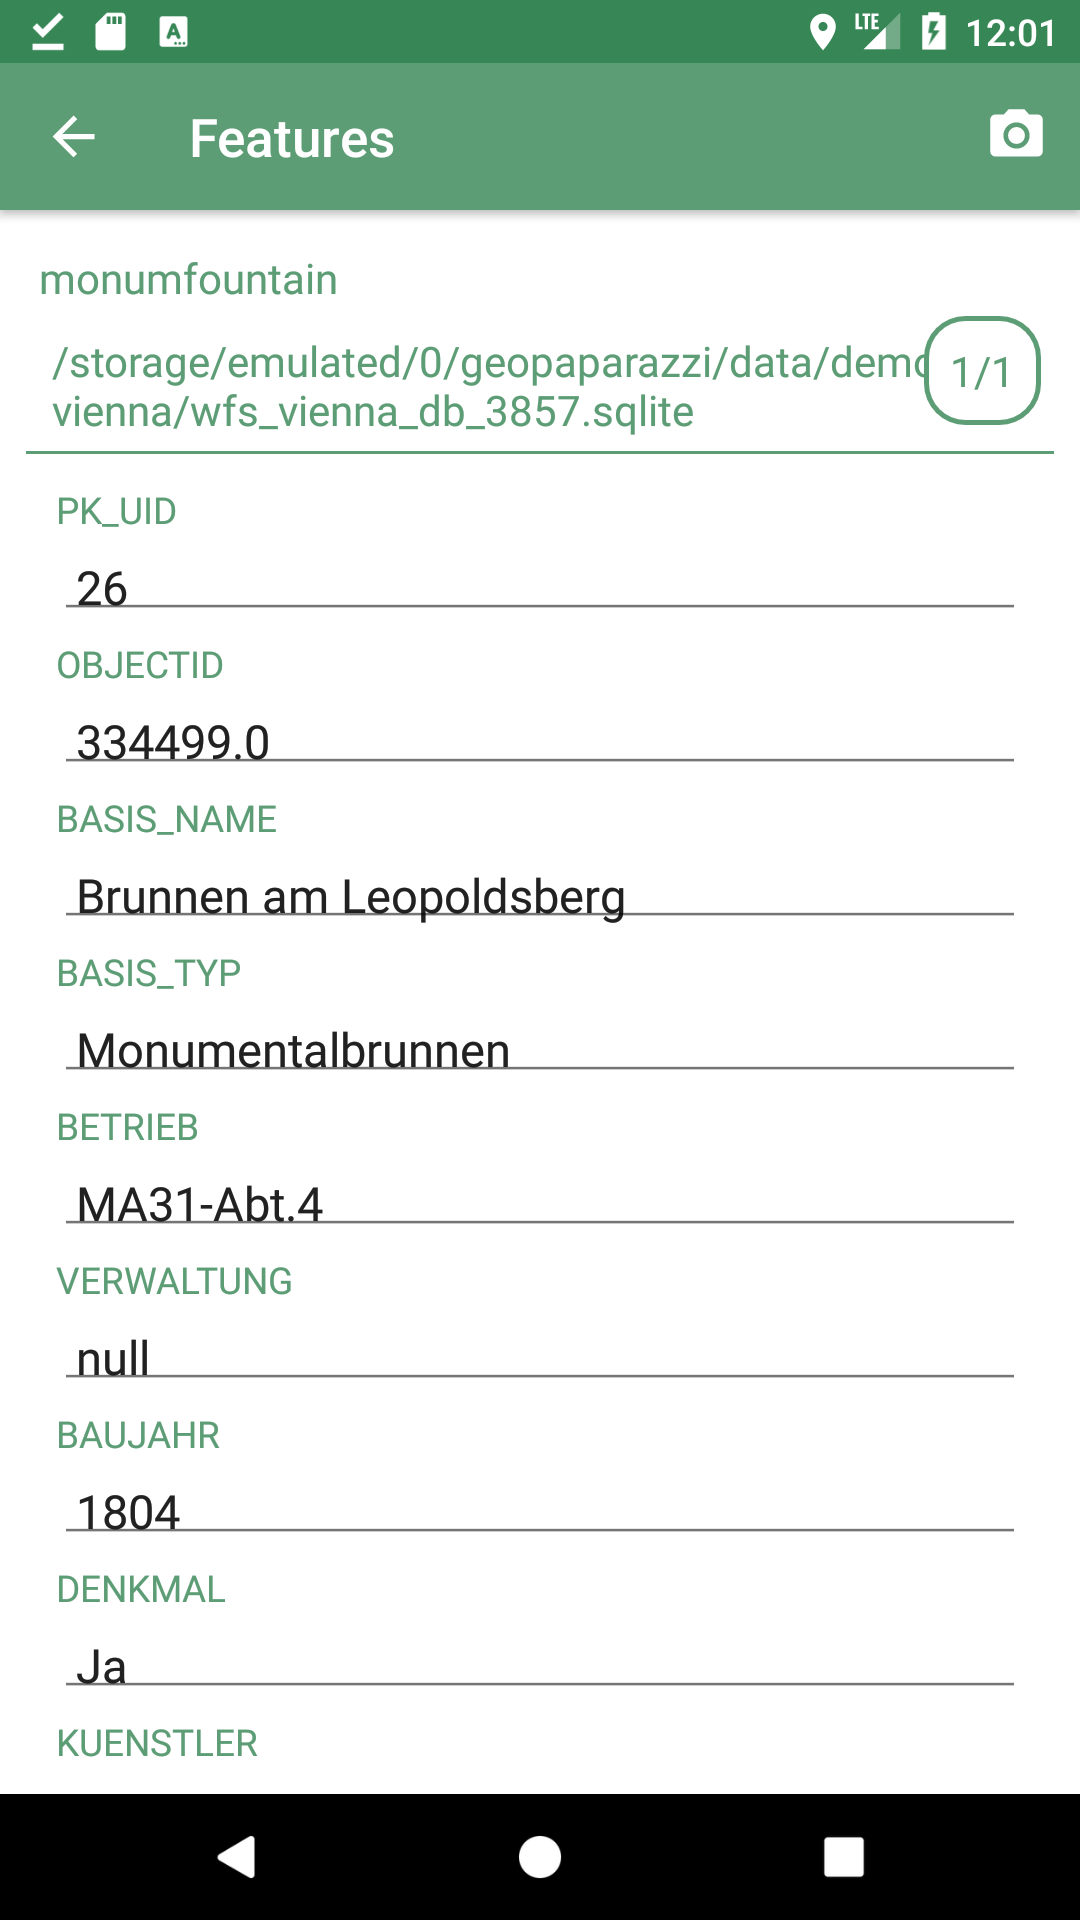
If there are any resource files (for example, images, PDFs ) associated with the feature, a camera icon will appear in the left of the Features Action Bar. Pressing on the camera icon will show a list of resources.
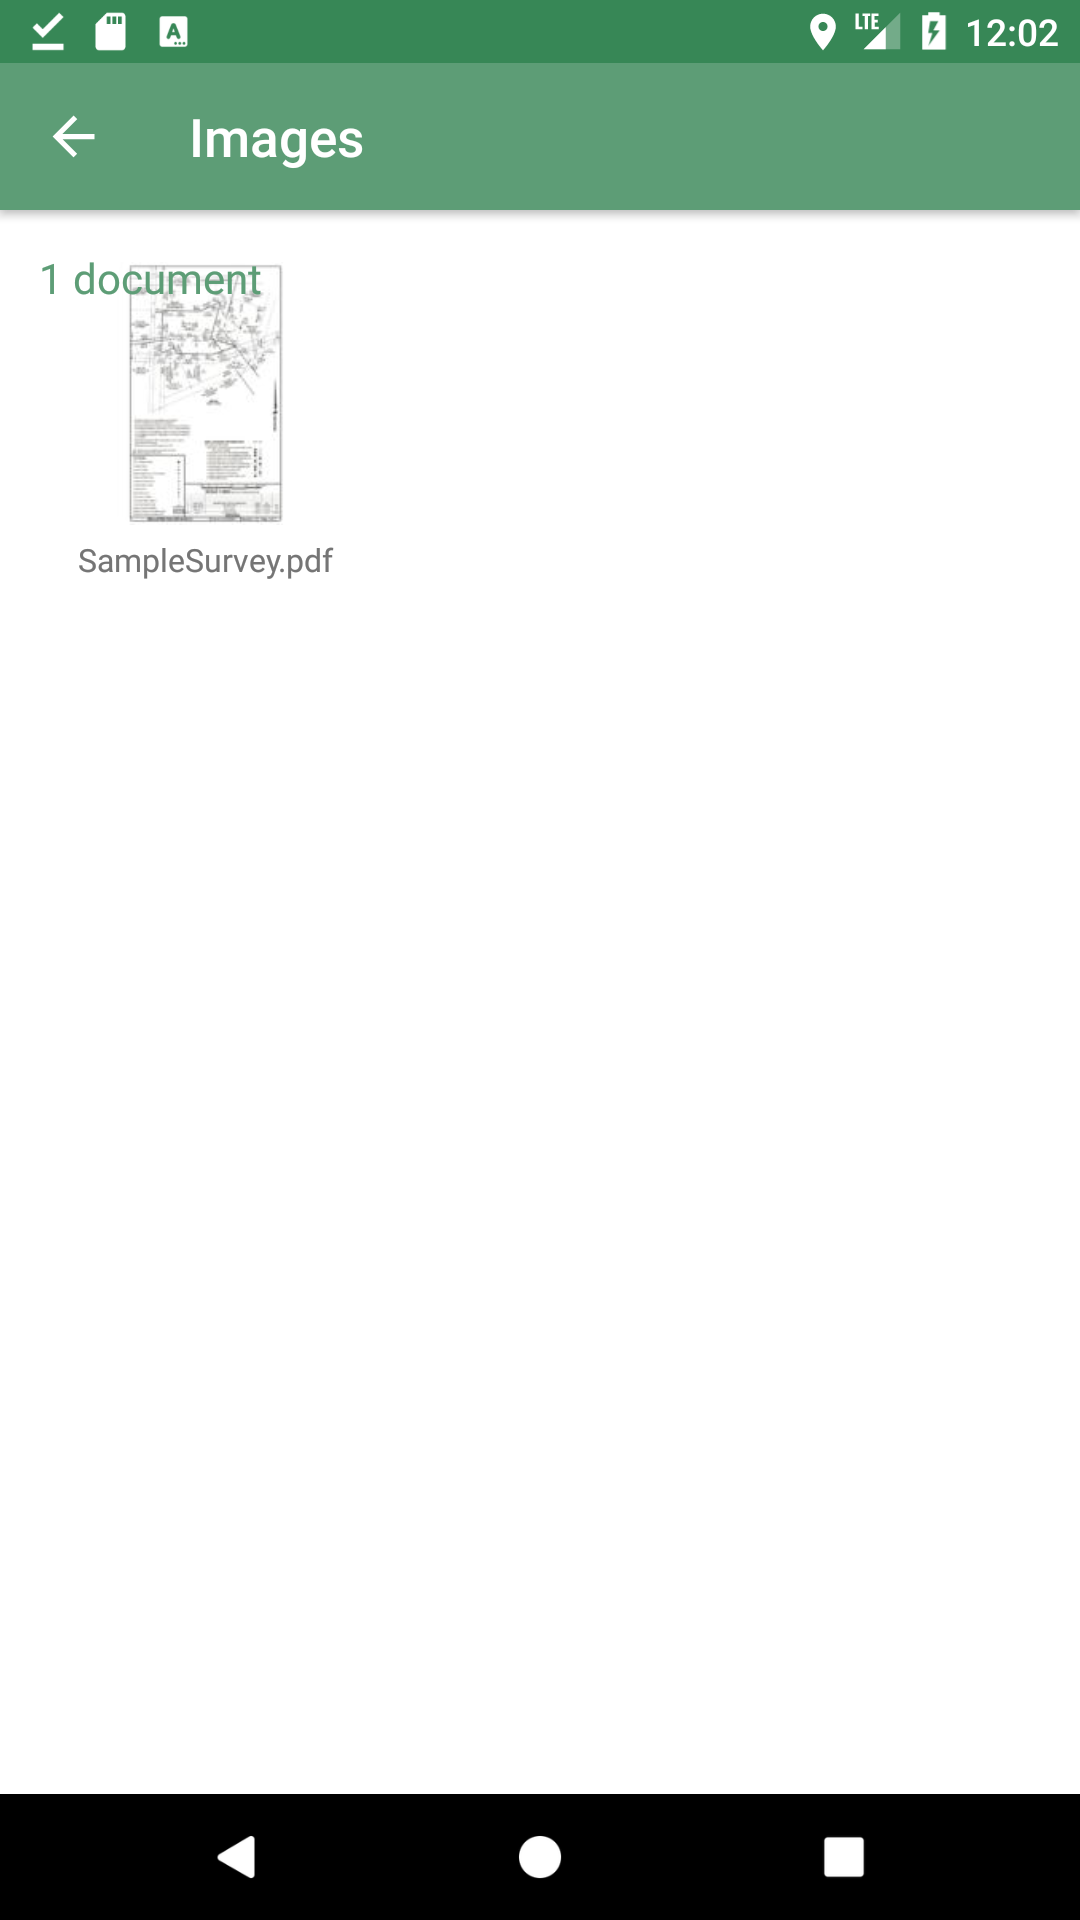
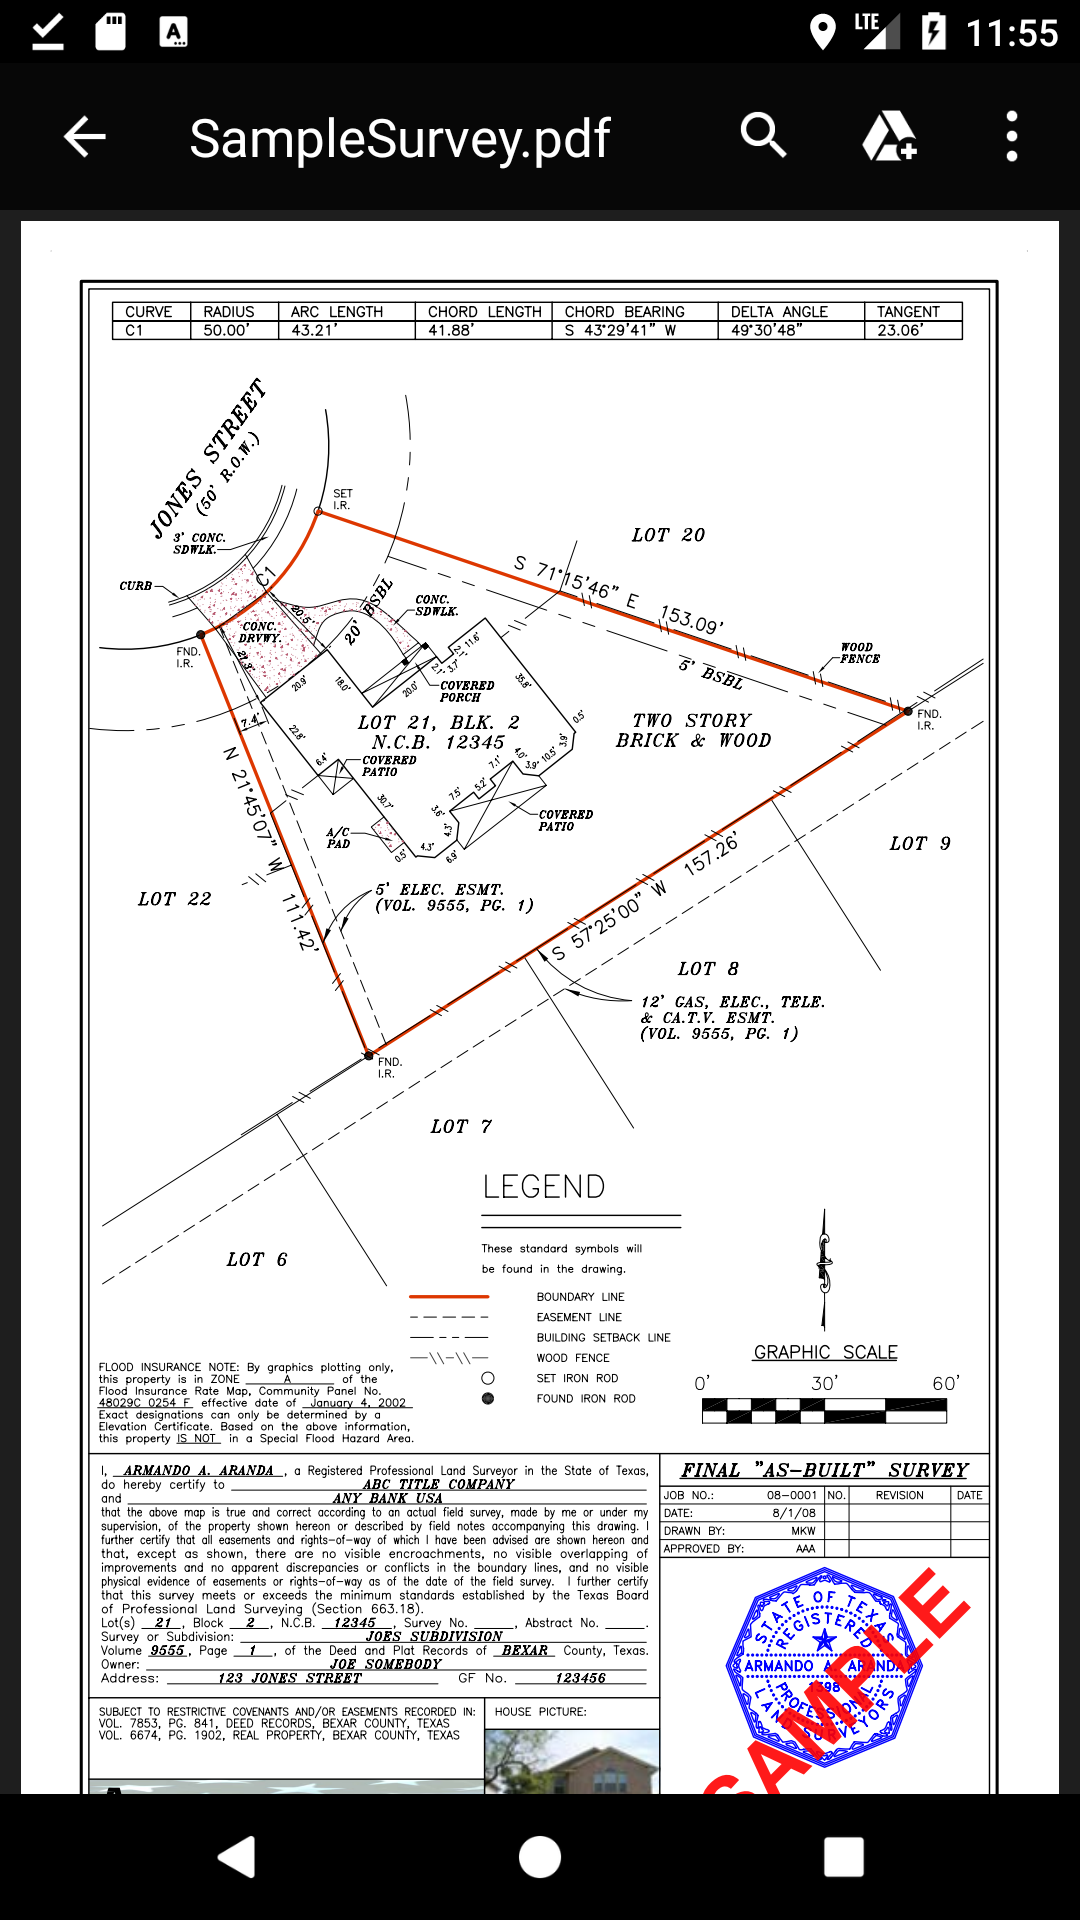
Pressing on the resource thumbnail image will open a viewer of the resource.
9.2. Editing Features
In addition to just viewing the features, you can edit the attribute values of features stored in a Spatialite database or add geometry and attributes of new features.
9.2.1. Select a Layer for Editing
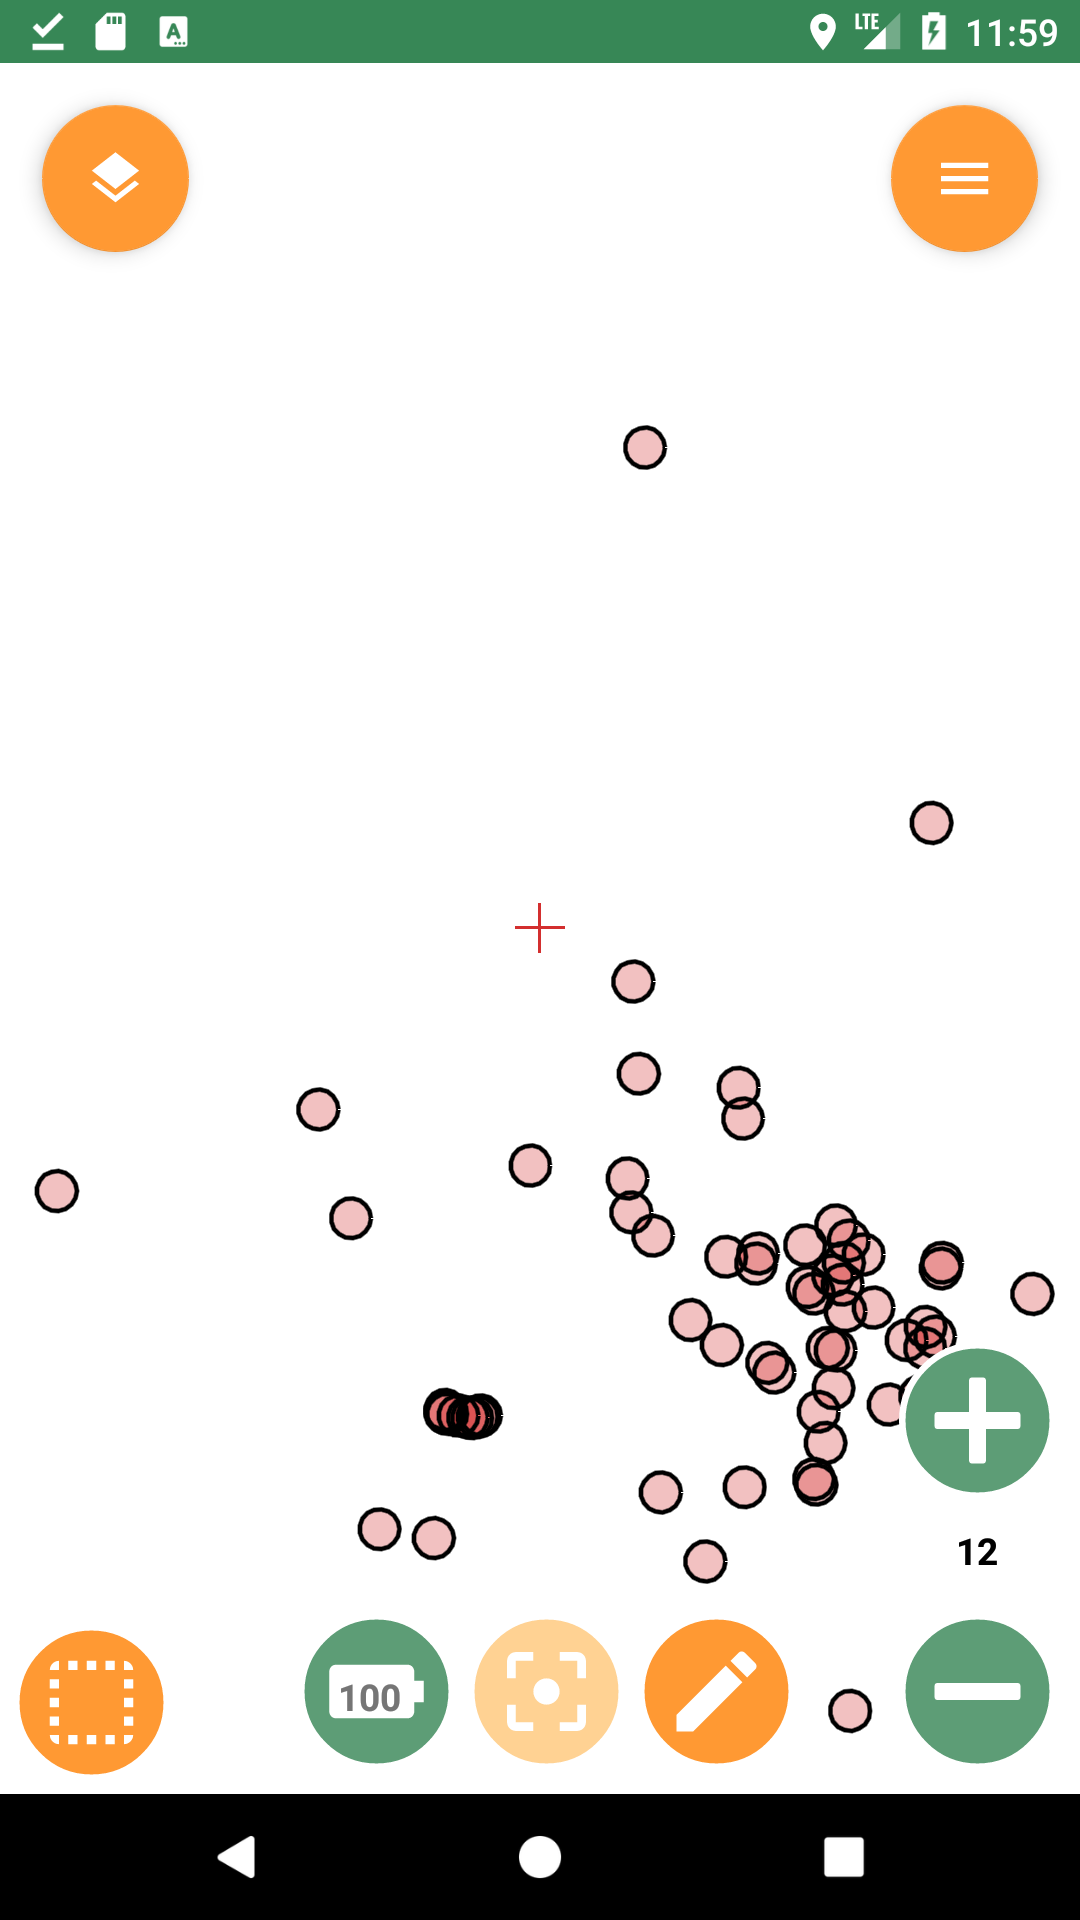
To edit, add a Spatialite database in the Map View and turn on the layer for viewing and enable the layer for editing. Return to the Map View to start editing features.
Back on the Map View press the edit tool button. Depending on the geometry type of the editing layer various editing buttons will appear.
You can add a point using GPS location (if available), map center, or by tapping on the map.
Geopaparazzi’s Map View supports several map types: vector or raster, editable or static. Also, maps can be pulled live from an Internet server, or be generated locally from a map data file for off-line operation.
The following sections will detail various map data source types. In case you want to prepare tailored map datasets as map sources in one of below map formats, please refer to the data preparation section.
From Android version 4.4 (codename KitKat) it is no longer allowed for applications to write to user installed MicroSD cards. Instead applications can still write to internal storage (often seen as sdcard also).
An external user-installed sdcard appears to Geopaparazzi as readonly. Datasets copied on the sdcard on a pc can therefore only be accessed in readonly mode and will create crashes if the user tries for example to modify a feature attribute.
One lesser known thing is that if the data are kept inside the application’s data folder, they can be accessed in read/write mode.
So for example, if one puts the dataset in the folder:
/storage/YOUR-SDCARD/Android/data/eu.hydrologis.geopaparazzi/files
it will be handled as if it was in the internal memory.
Map data sources used as layers in the Map View can be different types:
-
Geopaparazzi defined Cloud Tile servers
-
Geopaparazzi mapurls
-
Mapbox mbtiles
-
Mapsforge maps
-
Spatialite databases
9.3. Cloud Tile Servers
For ease of use, Geopaparazzi has stored the location of several map tile servers available remotely on the Internet. While you can choose these when added layers to the Map View, you cannot add, delete, or modify this internal list.
9.4. Mapurls: Map tiles
Mapurl files are simple text files containing definitions of tile sources, either local or remote. A mapurl file must have the file extension/suffix .mapurl to be recognized by Geopaparazzi.
9.4.1. Remote Tile sources
By default, Geopaparazzi is configured to load map Mapnik rendered tiles from OpenStreetMap’s tile server on the Internet. Have a look at the contents of the mapnik.mapurl file below for how this is done. You can exchange the OSM tile server with any other tile server as long as it adheres to the Mapurl URL conventions. The basics are:
url=http://tile.openstreetmap.org/ZZZ/XXX/YYY.png
minzoom=0
maxzoom=19
center=11.42 46.8
type=google
format=png
defaultzoom=13
mbtiles=defaulttiles/_mapnik.mbtiles
description=Mapnik - OpenStreetMap and contributors, ODbL.
The mandatory information is:
-
the url of the tile server, having:
-
ZZZ instead of the zoom level
-
XXX instead of the tile column number
-
YYY instead of the tile row number
-
| This information can be tested also in a browser http://tile.openstreetmap.org/9/271/182.png has ZZZ=9, XXX=271 and YYY=182 |
-
the minimum zoom level that is supported (typically 0)
-
the maximum zoom level that is supported (likely not more than 19 or 21 depending on the server)
-
the center of the tile source
-
the type of tile server. Currently both standard TMS and Google Maps based numbering of the tiles is supported by the line:
-
type=tms
-
type=google
-
-
the backup mbtiles path. This one is used to save downloaded tiles in the local mbtiles database
| The user needs to make sure that the backup mbtiles path is in a writable folder (see a word about "external" storages) or else crashes might occur. |
Geopaparazzi will cache/store downloaded Mapurl tiles in a local MBTiles SQLite file, so pre-fetched tiles will remain viewable when Geopaparazzi is operated disconnected from a remote Mapurl source (in off-line operation).
9.4.2. Local Tile sources
Just like your mapurl configuration may reference an on-line/remote tile sources, your mapurl setting may reference a local tile source folder for off-line use. This way it’s possible to load on any smart phone complex map tiles.
To be able to load such maps, one needs to prepare the tiles properly. This can be done via in several ways as explained in the data preparation section.
The tile folder have then to be loaded in the same folder as the description of the tile source:
url=mytilesfolder/ZZZ/XXX/YYY.png
minzoom=12
maxzoom=18
center=11.40553 46.39478
type=tms
Nothing changes against the description for the remote source apart of the URL. The URL in this case represents the relative path of the tiles folder.
| Filesystems are known to have problems in handling large amounts of very small files. This the exact case of local tile sources. If the dataset is large, it gets very hard to move the data from and to the device. Therefore this method, even if still supported, is flagged as deprecated. The MBTiles datasource, explained in the next section, should be used instead. |
9.5. MBTiles
MBTiles is a file format for storing map tiles in a single file. It is, technically, a SQLite database. See the openstreetmap wiki for more information.
9.6. Mapsforge Format Data
The mapsforge project provides free and open software for the rendering of vector data based on OpenStreetMap. It developed an efficient binary format for storage of OSM map data (usually with file extension .map), and is offering country specific .map files for download. Geopaparazzi is able to render map tiles locally from .map files and will cache rendered tiles in a local MBTiles store.
Apart from Mapsforge itself, OpenAndroMaps is also offering .map files but with a different data bias and different render theme.
9.6.1. Mapsforge Supplied .map Files
These are the standard map data files generated, maintained and distributed by the mapsforge team and can be downloaded from their download server.
In their default style they kind of look like:
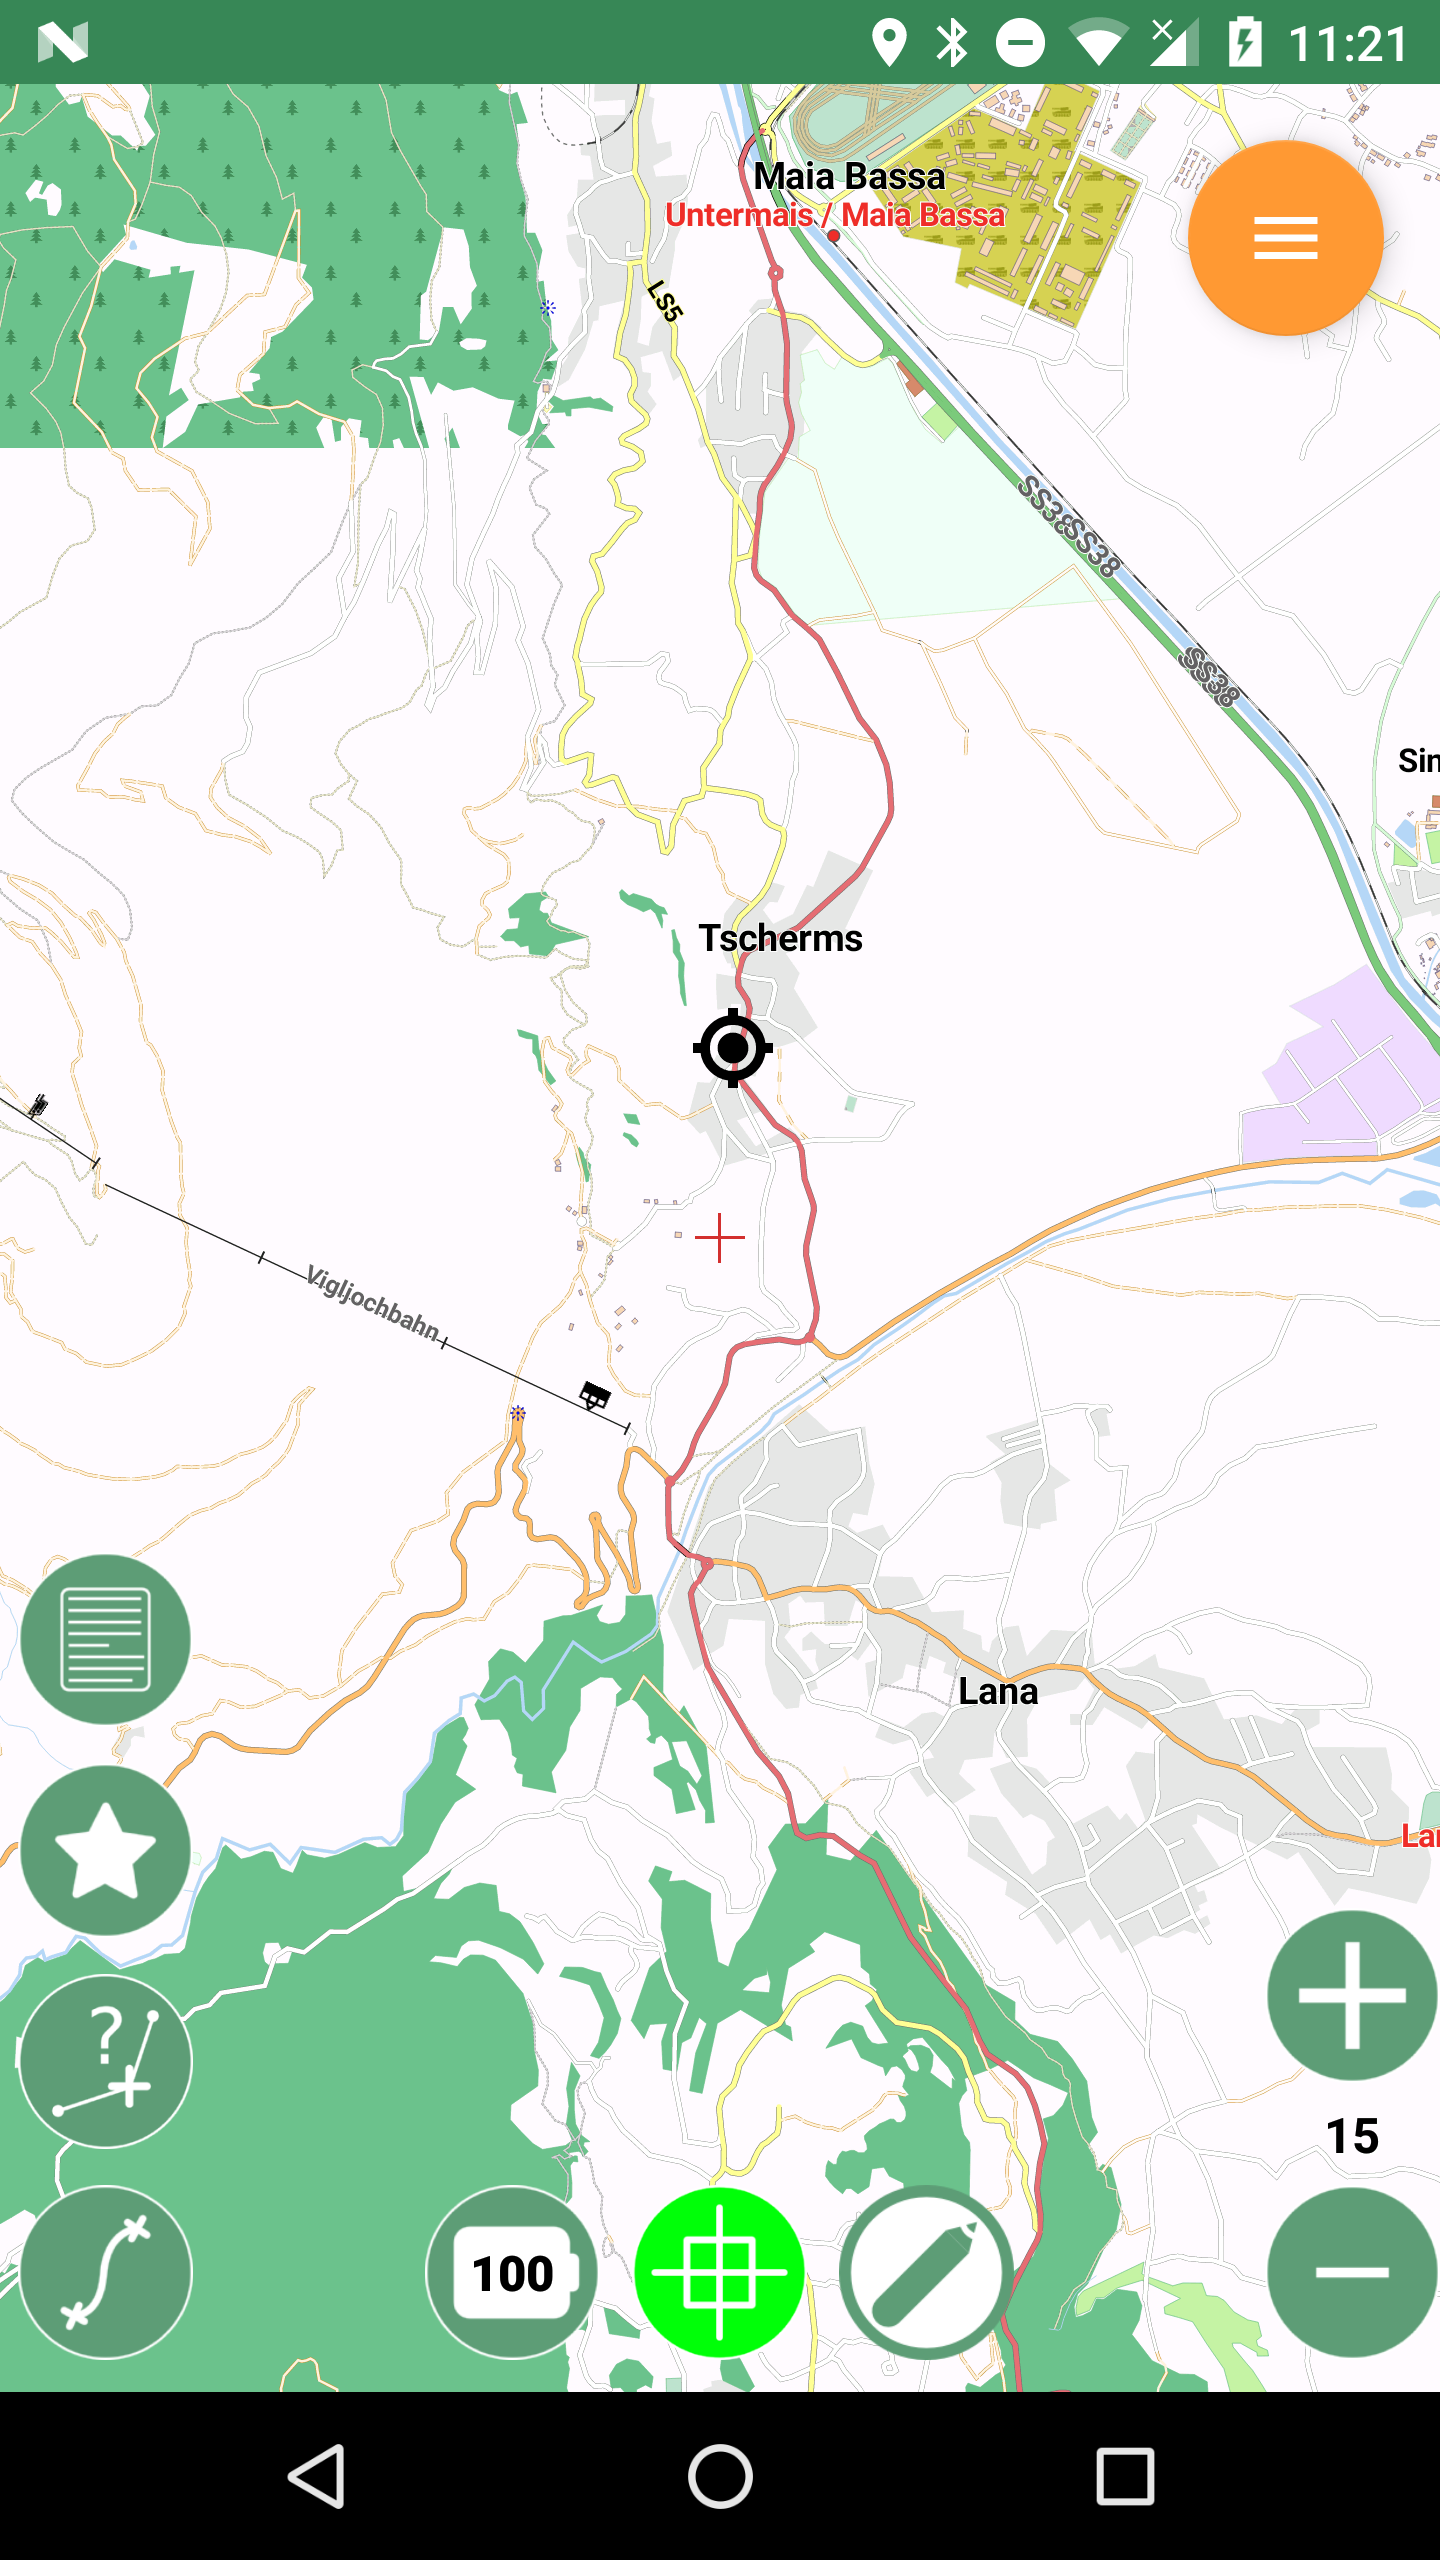
9.6.2. OpenAndroMaps Supplied .map Files
Openandromaps generates Mapsforge format map files following the opencycle theme, with isolines and more hiking related stuff. The map files are larger but worth every byte. Their download area is here.
With the Oruxmaps theme that is available from the download area, the maps look like:
9.6.3. Apply a render theme
When rendering Mapsforge tiles locally, Geopaparazzi applies render themes if they are found on the disk. In order to be found, the render theme XML file needs to have the same name as the map file. Ex, the above cycle map example has a:
italy_cycle.map
and a:
italy_cycle.xml
render theme file in the same folder as the map file itself.
9.7. Spatialite Data Sources
Spatialite spatial tables and views can be added as layers to the Map View as vector layers (and can be edited on the Map View). For more information on this format, see spatialite database format site. If you want to create Spatialite databases, have a look at the Spatialite GUI section. For details on Geoparazzi specific tables in Spatialite databases, see the Spatialite Databases section.
10. Handling datasets from and for Geopaparazzi
Several applications can be used to prepare and evaluate datasets for Geopaparazzi. The current ones known are:
-
gvSIG
-
STAGE
-
QGIS
-
Spatialite GUI
-
GDAL
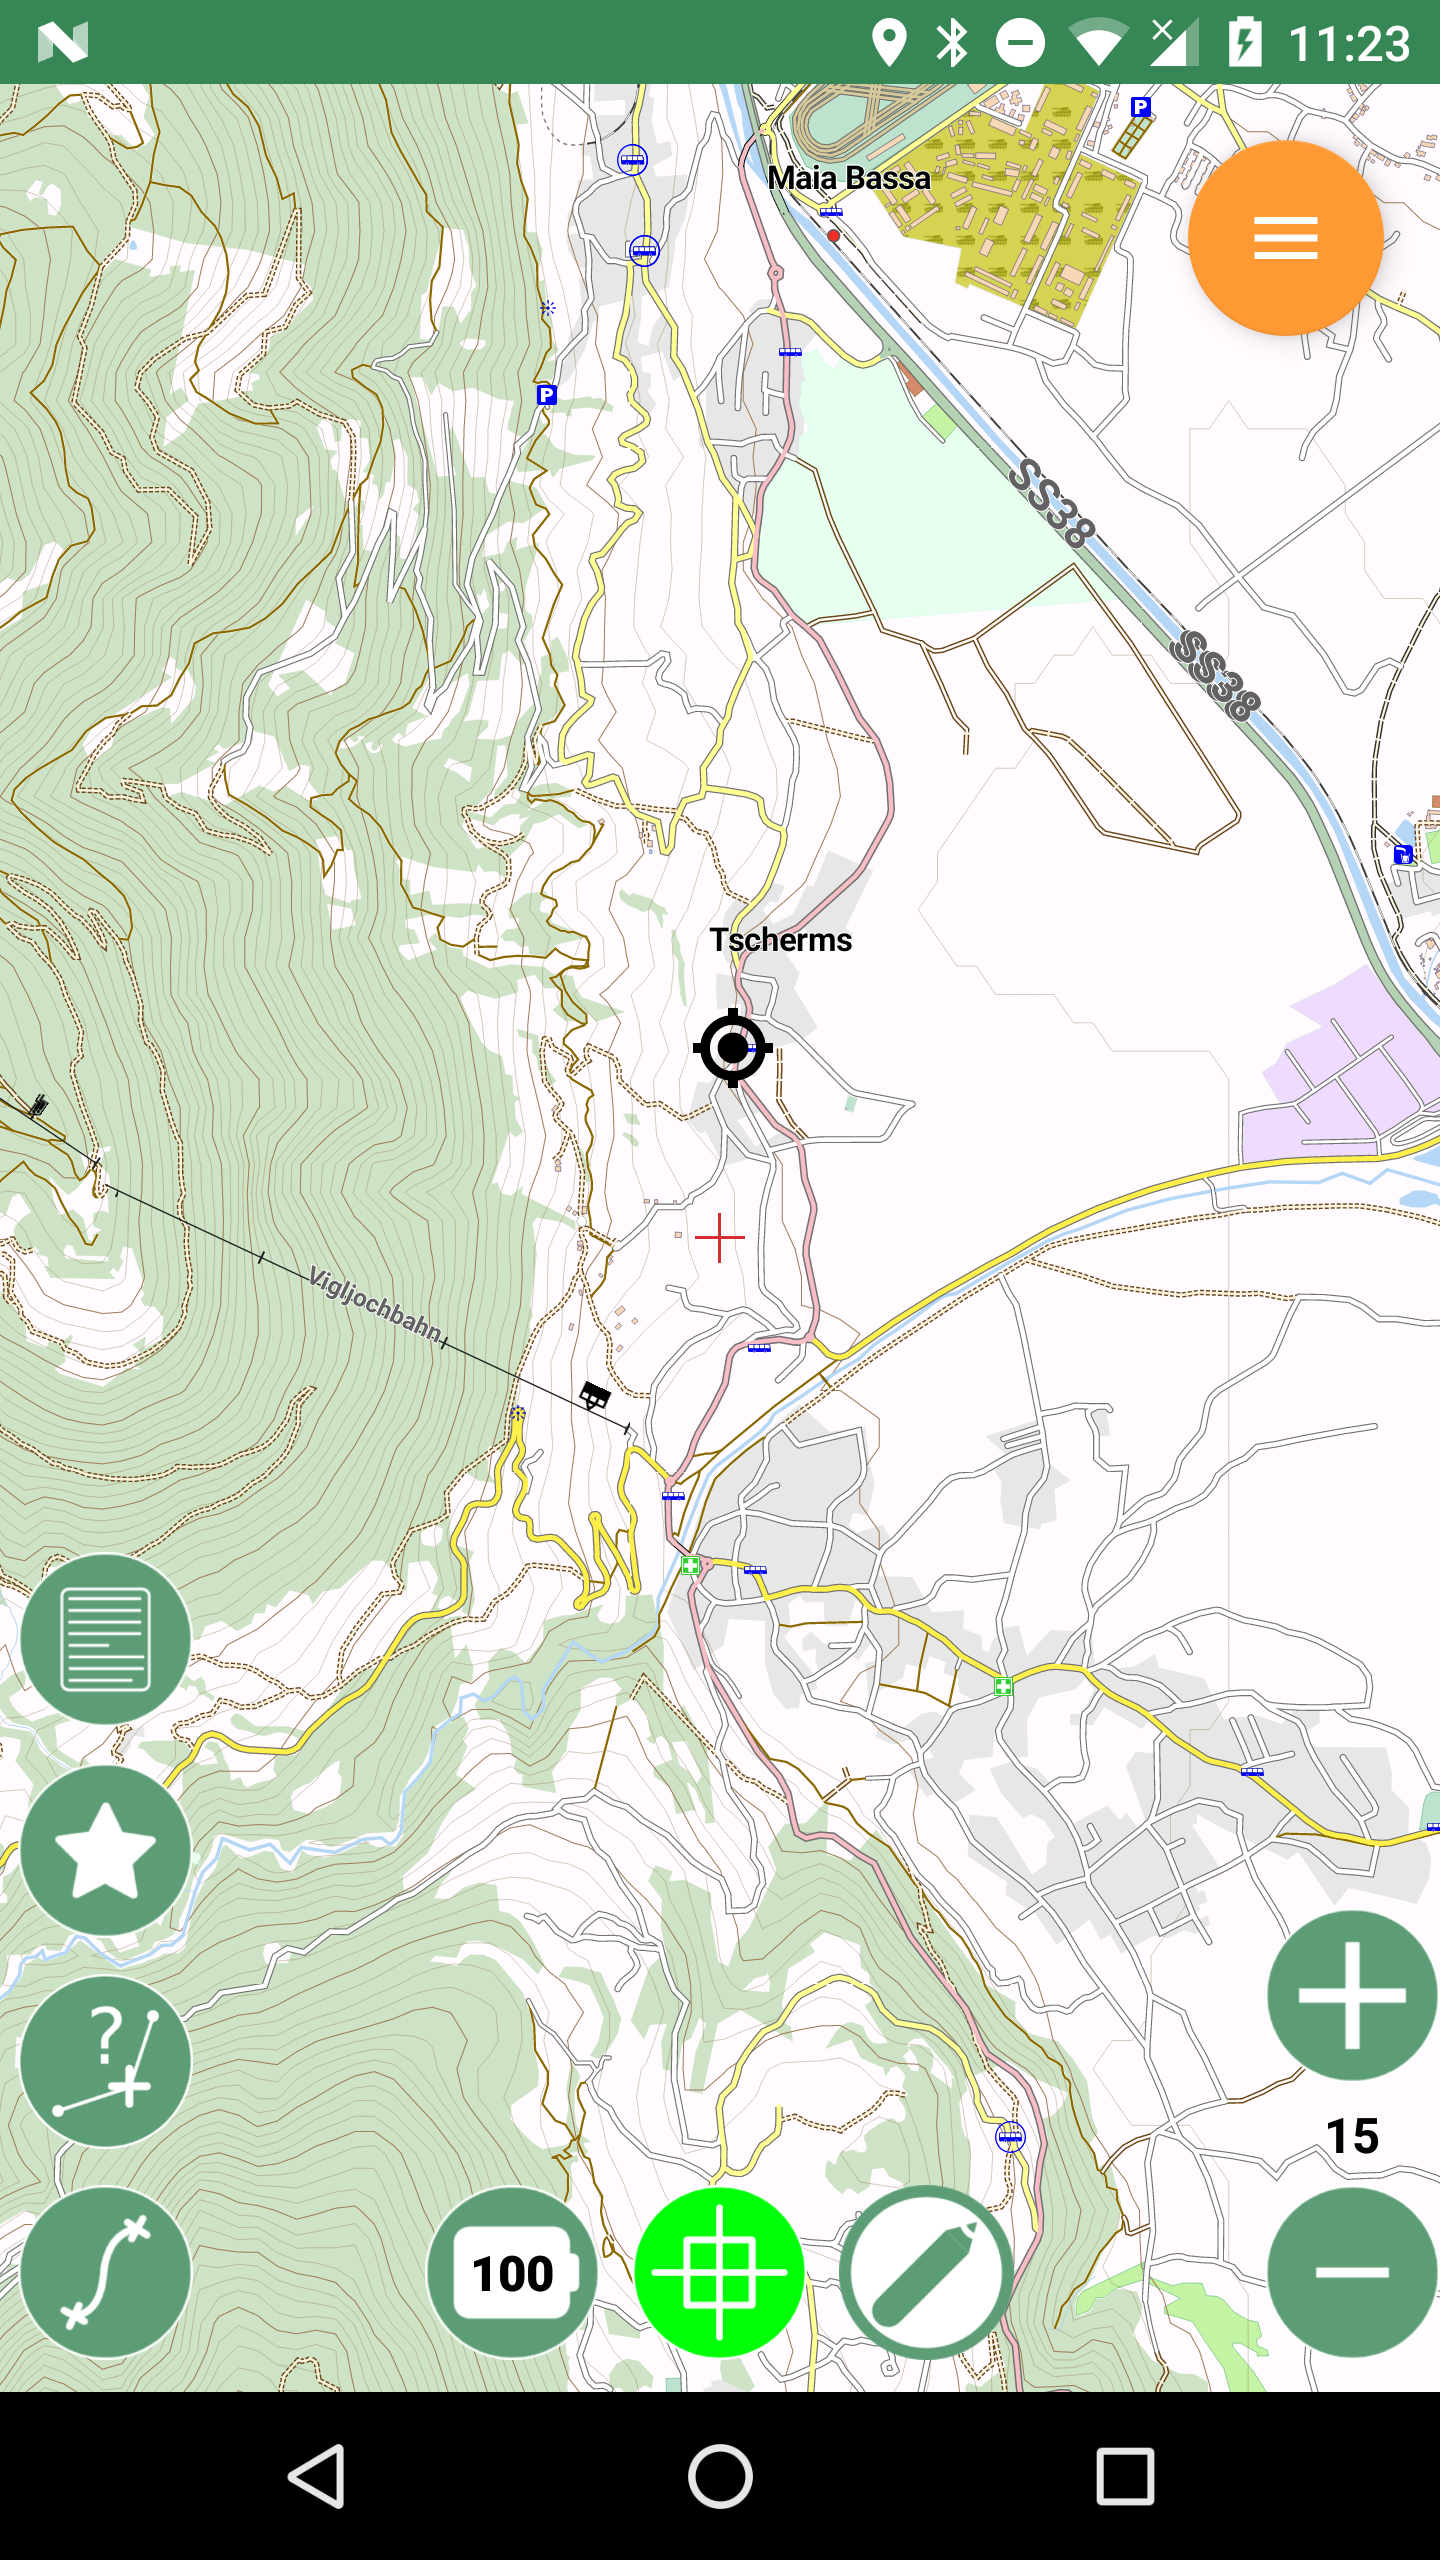
10.1. STAGE 0.7
STAGE (Spatial Toolbox And Geoscripting Environment) is a standalone application dedicated to spatial analyses.
Related to Geopaparazzi, it contains functions to:
-
Create mbtiles files from raster and vector sources.
-
Export Geopaparazzi projects (version 3 or 4) to shapefiles, notes, profiles, and other details.
-
Convert Geopaparazzi projects from version 3 to version 4.
10.1.1. Installation
STAGE can be downloaded from the github releases page.
Steps:
-
copy the zip file in a folder:
-
stage_0.7_win64.zip for 64 bits Windows operating systems
-
stage_0.7_win32.zip for 32 bits Windows operating systems
-
stage_0.7_lin64.zip for 64 bits Linux operating systems
-
-
unzip the file in a folder
-
enter the unzipped folder
-
run the Stage application (ex. stage.exe for windows)
The mobile section contains modules related to Geopaparazzi.
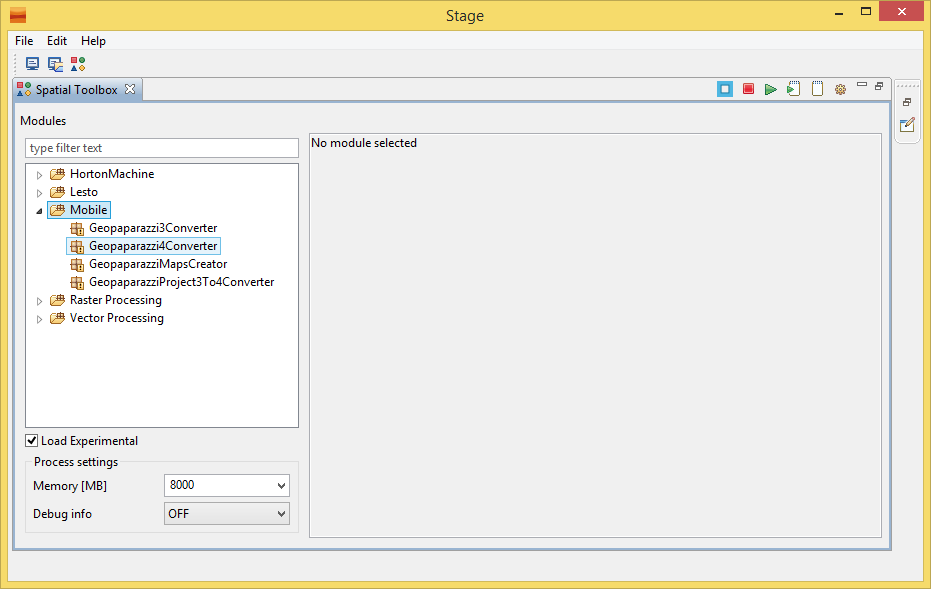
10.1.2. MBTiles creation
For the creation of an MBTiles file from a set of GIS data, as shapefiles and tiff rasters, select the module: GeopaparazziMapsCreator
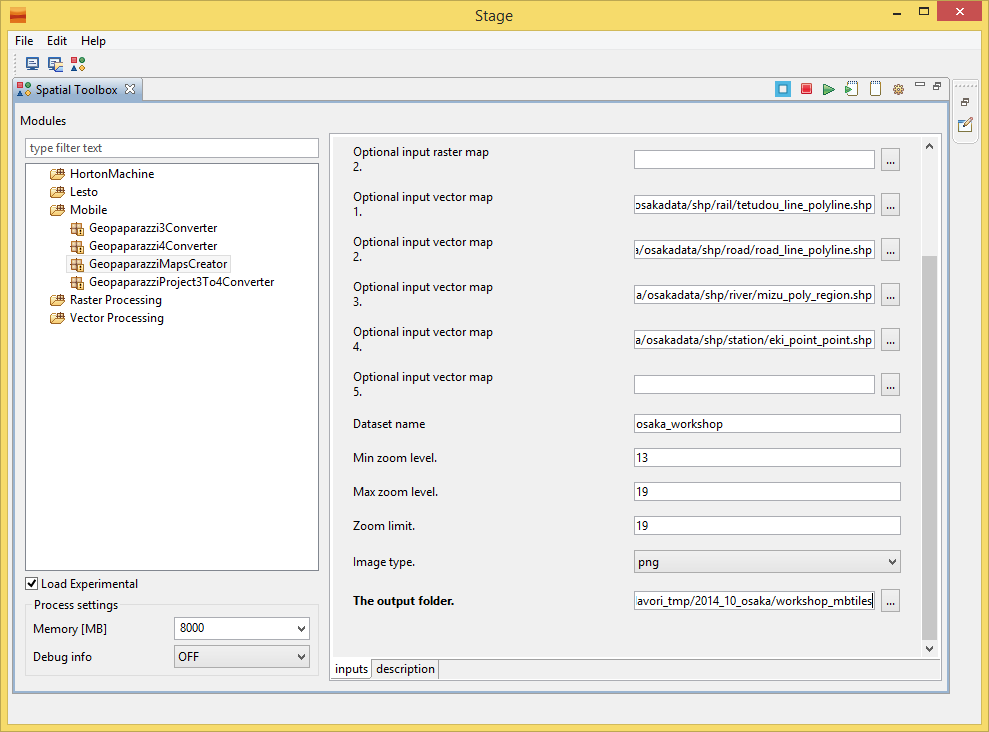
The user will be able to add:
-
up to 2 raster tiff or asc maps
-
up to 5 vector shapefiles
-
define the name of the new mbtiles dataset
-
define the minimum and maximum wanted zoomlevel (zoomlevels > 18 start to take long time to build because of the large number of tiles generated)
-
the image type to use:
-
jpg: this should be used when photographic data are used (ex. aerial images)
-
png: this should be used when images are used (ex. technical maps)
-
-
the output folder, inside which the database will be created
Once the parameters are set, the module can be launched by pushing the green play button in the top right toolbar.
In case of big data the user should consider to set the memory put available to the run module. This is done in the lower left combobox labeled Memory [MB]. The number to set is considered to be MegaBytes. A safe value to use is a bit less than the amount of RAM available on the computer.
For windows 32bit machines it is not possible to use more than 1000 MB due to technical limitations of Java itself.
10.1.3. Conversion of Geopaparazzi data to GIS data
Through the module Geopaparazzi4Converter it is possible to export data from a Geopaparazzi project database.
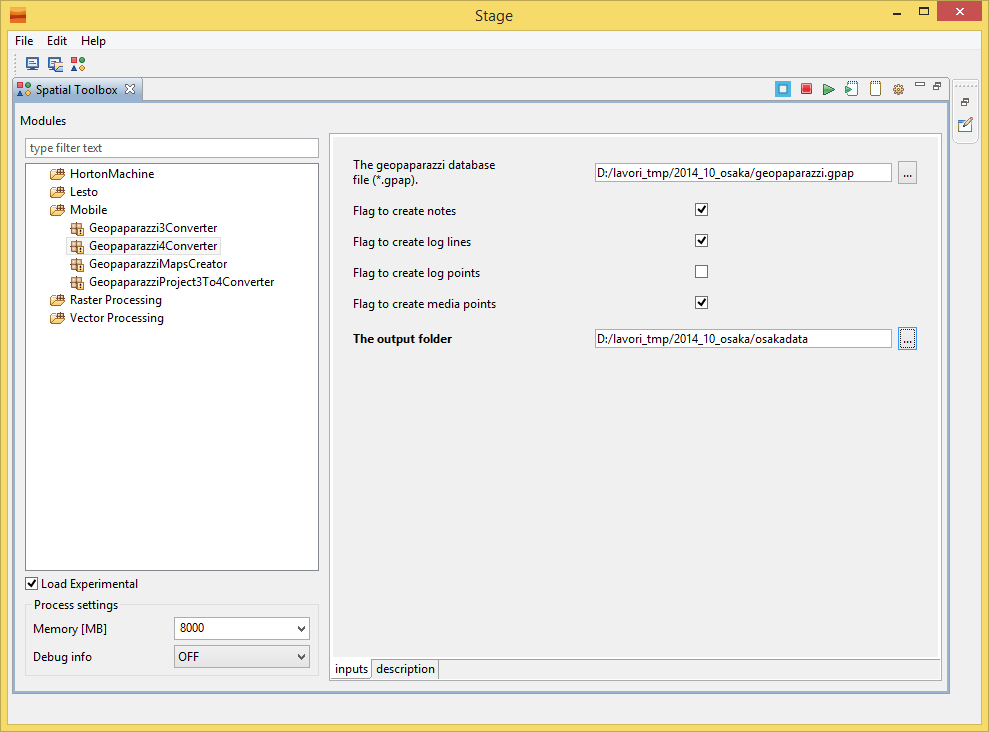
The only parameter to set are the input Geopaparazzi database path and the output folder. It is also possible to toggle the creation of some of the data contained in the database.
To run the module, refer to the mbtiles section.
How are the data are exported from the Geopaparazzi database? The following is created:
-
point shapefiles for each type of note also complex forms
-
point shapefiles with reference to pictures taken and sketches
-
all pictures are exported to a media folder
-
line and points shapefiles for log lines and points
-
profile charts and csv of log data
-
a simple text project metadata file
10.2. QGIS
QGIS works very well with Geopaparazzi. It can also be used to prepare data for Geopaparazzi including spatialite data and mbtile base maps. Using plugins, QGIS can be used to import Geopaparazzi databases.
10.2.1. Viewing Data in QGIS 3
QGIS 3 has a plugin called IO Geopaparazzi that will automate the importation of bookmarks, notes, form data and GPS trails into QGIS. Once installed, the plugin can be found by searching the Processing Toolbox for Geoparazzi.
A more manual method of importing data from gpap files is to change the extension of the gpap file to sqlite3. The sqlite file can then be dragged and dropped onto the map window. The ‘Select Vector Layers to Add’ dialog will appear and all of the data tables will be displayed, including tables that are irrelevant from a GIS perspective such as the raw photo data table. Only the bookmarks, gpslogsdata, images and notes table contain data with coordinates. Select these tables and OK the dialog to add them to the Layers pane as non-spatial tables. Non-spatial tables can only be viewed as attribute tables and cannot be used as map layers.
Importing the data manually is mainly of use for recovering from user errors in the field such as forgetting to use a form to record key points and therefore needing to recover location and time data from the track points. It can also be useful for managing and symbolising data in ways not supported by IO Geopaparazzi.
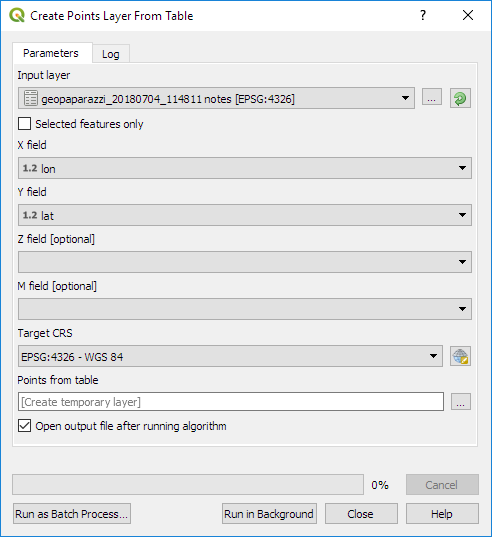
To convert non-spatial tables to GIS layers, use the Create Points Layer from Table tool in the processing toolbox. Even the gpslogsdata must first be converted to points. To create a gps trail, the point layer created from the gpslogsdata can be processed with the Points to Paths algorithm. Currently, there are no tools for creating separate layers for each form type. Form data, is encoded in json format in the Forms field and there is no way to format the data to make it easily readable. However the various types of form can be symbolised differently using the form name, which is stored in the ‘text’ field. This method is useful for seeing gps trails and where various form notes were created.
QGIS 3 can also be used as viewer for kmz files produced by Geopaparazzi although is it not quite as good as GoogleEarth. Add the kmz file to QGIS 3 and use map tips to display the data associated with each point in a popup. If the map tips are based on the description field, which contains html, then the map tips will render the html and present a formatted report for the current data point.
10.2.2. Other Alternative Import Methods
QGIS users can also install GV-SIG and use the Horton Machine spatial toolbox to convert gpap files to shapefiles which can be used in QGIS.
10.2.3. Making Base Maps in QGIS
QGIS 3.10 has a multi-threading tile generator which is many times faster than previous versions. The tile generator is built in and is called generate xyz tiles and is located in the Processing Toolbox. Versions of QGIS older than 3.8 require a plugin to create mbtiles. Base maps with as many as 30 000 tiles (~3 GB file size) work well in Geopaparazzi.
Scale dependent visibility can be used in QGIS to turn on detailed layers only when the map is zoomed in. When tiles are made from a GIS project that uses layers which appear only as certain scales, the tiles that are generated will also show different layers at different scales. Any vector data that is displayed when the tile is created will be included in the tiles. An example of using image and vector data with scale dependent visibility to package a lot of information in one mbtiles file is as follows: a topographic map can be displayed for scales less than 1:100 000 and to an aerial photo overlaid with contour lines can be displayed larger scales.
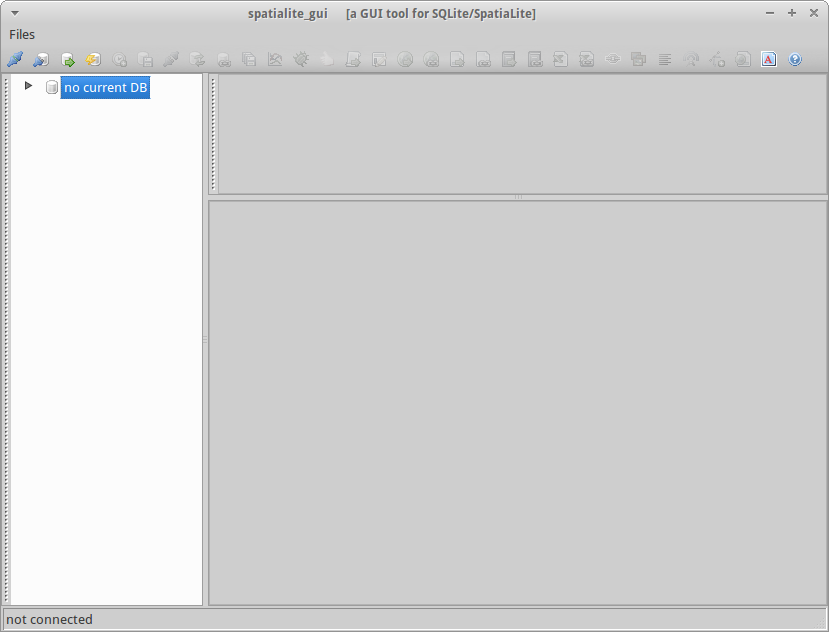
10.3. Spatialite GUI
The Spatialite GUI can be used to create spatialite databases from shapefiles.
You can find the application on the spatialite homepage, at the time of writing a good version for windows is version 1.7.1 available in this download area.
Open it and find yourself with:
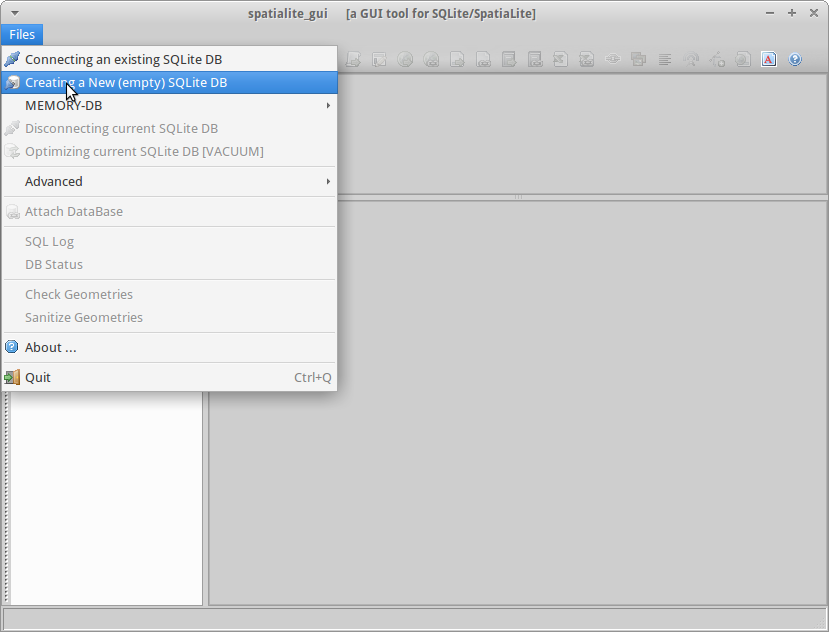
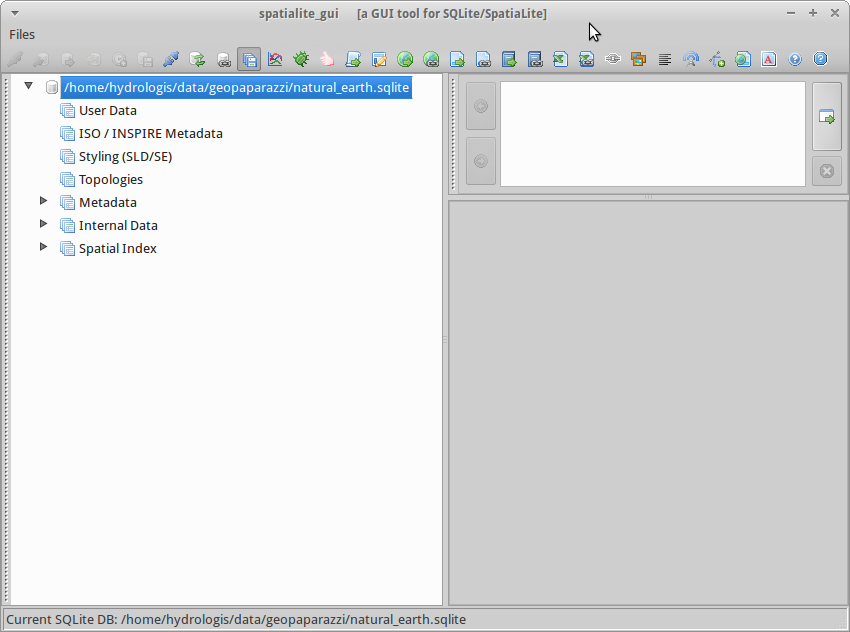
We now create a new empty database in which to load the shapefile data:
You will be asked to save the database somewhere on disk. Once done, you should find yourself with something like this, but with different path:
To then load a shapefil, locate the Load Shapefile icon:
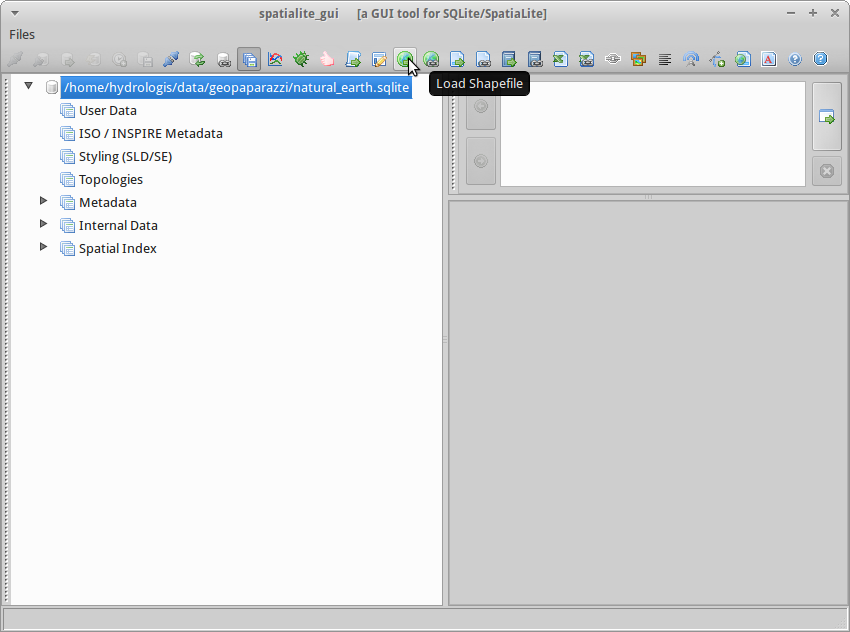
In this example I will import a set of shapefiles from the Natural Earth dataset, in particular the following ones:
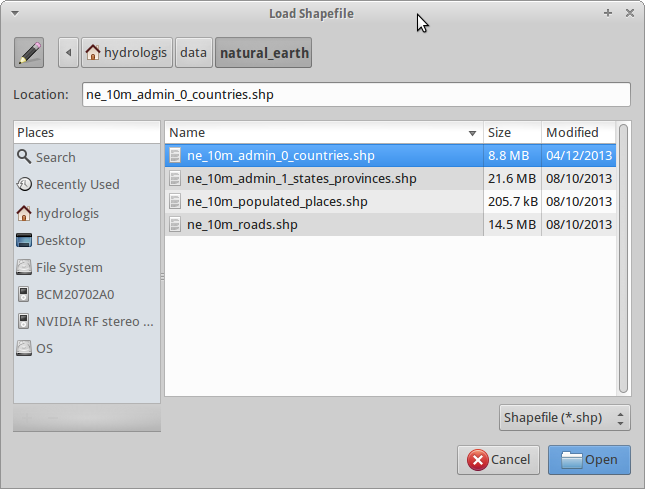
that can be found here.
The import dialog is the important one to fill the right way:
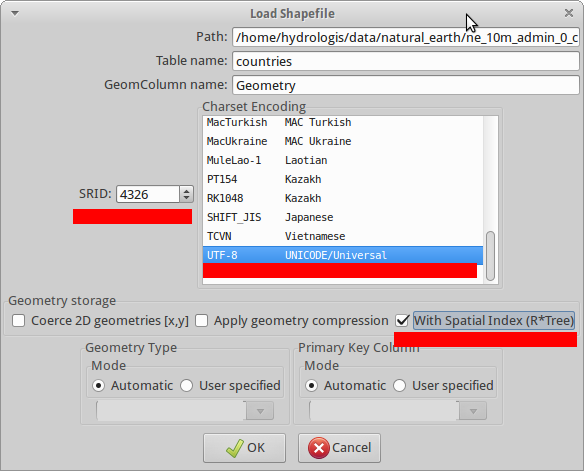
The really important things to take care of, are underlined in red:
-
the SRID, i.e. the EPSG code of the data projection. If that one is not right, then you will not be able to see the data in Geopaparazzi. Don’t even hope in miracles!
-
the Charset Encoding. Make sure to choose the right one. For example Japanese people might want to choose SHIFT_JIS if they want to see the labels rendered properly
-
force the creation of the spatial index
If you then the push the ok button, you should find yourself with an ok message like this after the import:
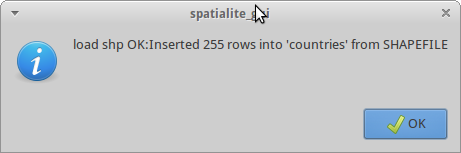
You are almost there, one last step to go.
Right-click on the database name and select the Update Layer Statistics command.
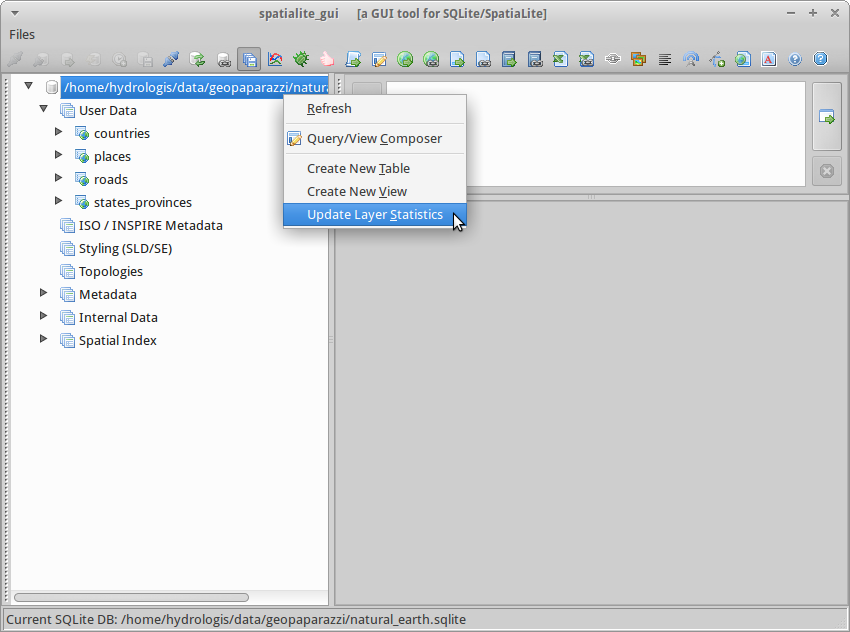
Depending on the amount of data it should keep your hard disk working for a bit. Don’t think it finished unless you see a result like the following:
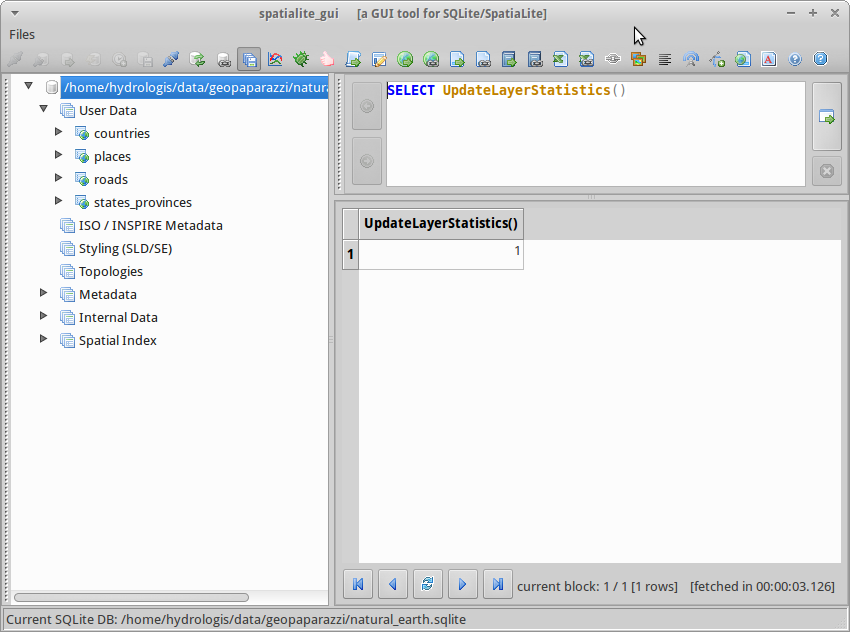
Once this result appears to you, you are good to go.
Move the spatialite database to your device, fire up Geopaparazzi and go directly to the spatialite data view and load the database.
10.4. OGR
OGR2OGR can be used to create Spatialite databases supported by geopaparazzi using different datasources.
The command that can be used is similar to:
ogr2ogr -f "SQLite" -t_srs "EPSG:3857" -dsco SPATIALITE=YES output_ortrans.sqlite ORTrans_public.gdb| More info available here |
10.5. GDAL
Geopaparazzi does not support reprojecting raster data sources on-the-fly, so the file must be warped to the proper projection before using it. To do it you can use gdalwarp command.
The target projection must be Google Web Mercator (EPSG code 3857); you must know also the source projection of the raster you are converting. As an example, if you have a WGS 84 projected (EPSG code 4326) input file, you will run this kind of command:
gdalwarp -s_srs EPSG:4326 -t_srs EPSG:3857 -r bilinear input.tif output.tif- To create the tiles you can use gdal2tiles.py script, using as input your Google Web Mercator projected raster file
gdal2tiles.py output.tifIt generates directory with TMS tiles, that you can use in Geopaparazzi. In the root of the this directory you will find "tilemapresource.xml" file which contains all the information to build the .mapurl file:
    <?xml version="1.0" encoding="utf-8"?>
    <TileMap version="1.0.0" tilemapservice="http://tms.osgeo.org/1.0.0">
      <Title>temp3.vrt</Title>
      <Abstract></Abstract>
      <SRS>EPSG:900913</SRS>
      <BoundingBox minx="46.39742402665929" miny="11.28858223249814" maxx="46.45081836101696" maxy="11.37616698902041"/>
      <Origin x="46.39742402665929" y="11.28858223249814"/>
      <TileFormat width="256" height="256" mime-type="image/png" extension="png"/>
      <TileSets profile="mercator">
        <TileSet href="12" units-per-pixel="38.21851413574219" order="12"/>
        <TileSet href="13" units-per-pixel="19.10925706787109" order="13"/>
        <TileSet href="14" units-per-pixel="9.55462853393555" order="14"/>
        <TileSet href="15" units-per-pixel="4.77731426696777" order="15"/>
        <TileSet href="16" units-per-pixel="2.38865713348389" order="16"/>
        <TileSet href="17" units-per-pixel="1.19432856674194" order="17"/>
        <TileSet href="18" units-per-pixel="0.59716428337097" order="18"/>
      </TileSets>
    </TileMap>
Note that the BoundingBox and Origin values created by gdal2tiles are have x and y values switched against how we need them:
minx="11.28858223249814"
miny="46.39742402665929"
maxx="11.37616698902041"
maxy="46.45081836101696"
x="11.28858223249814"
y="46.39742402665929"
11. Synchronization of Geopaparazzi datasets in the cloud
This section is dedicated to workflows/methodologies and applications that allow to synchronize geopaparazzi data in the cloud.
Only free and open source applications are listed here with a description on how to install and configure them.
If you know of any applications that is not yet listed, please let us know.
11.1. Cloud Profiles
Cloud Profiles are a great way of easing Geopaparazzi’s data handling tasks. When a web server is configured to serve Cloud Profiles, Geopaparazzi can automatically download Projects, Basemaps, Spatialite Overlays, forms for Notes, and other files. When a user activates a downloaded Profile, Basemaps are made available, Overlays are attached to the Map View and layers are set to display.
The Geopaparazzi workflow is:
-
Restart Geopaparazzi
-
Start using Notes and the Map View!
11.1.1. Cloud Profile JSON
Shown below is a sample Cloud Profile JSON file containing two Profiles: Vienna and Bolzano.
{"formatVersion": 1.1,
  "profiles": [
    {
      "name": "Vienna",
      "description": "Map Demo",
      "creationdate": "2017-07-24 14:16:28",
      "modifieddate": "2018-04-09 13:00:00",
      "color": "#FBC02D",
      "active": true,
      "sdcardPath": "MAINSTORAGE",
      "mapView": "48.2129,16.3663,15.0",
      "project": {
        "path": "/geopaparazzi/data/demo/vienna/geopaparazzi_trip_vienna.gpap",
        "modifieddate": "2018-01-24 13:00:00",
        "url":       "http://MyServer/download/geopaparazzi/data/demo/vienna/geopaparazzi_trip_vienna.gpap",
      },
      "basemaps": [
        {
          "path": "/geopaparazzi/data/demo/vienna/orthofoto_vienna.mapurl",
          "modifieddate": "2018-01-24 13:00:00",
          "size": "267"
        }
      ],
      "spatialitedbs": [
        {
          "path": "/geopaparazzi/data/demo/vienna/wfs_vienna_db_3857.sqlite",
          "modifieddate": "2018-04-09 13:00:00",
          "url":       "http://MyServer/download/geopaparazzi/data/demo/vienna/wfs_vienna_db_3857.sqlite",
          "size": "9797632",
          "visible": ["monumfountain"]
        }
      ],
      "otherfiles": [
        {
          "path": "/geopaparazzi/data/demo/vienna/Josefstadt_isis_brunnen.JPG",
          "modifieddate": "2018-01-24 13:00:00",
          "url": "http://MyServer/download/geopaparazzi/data/demo/vienna/Josefstadt_isis_brunnen.JPG"
        }
      ]
    },
    {
      "name": "Bolzano",
      "description": "Notes Demo",
      "creationdate": "2017-07-24 14:16:28",
      "modifieddate": "2018-04-09 13:00:00",
      "color": "#296139",
      "active": false,
      "sdcardPath": "MAINSTORAGE",
      "mapView": "46.661,11.437,9.0",
      "project": {
        "path": "/geopaparazzi/data/demo/bolzano/geopaparazzi_trip_bolzano.gpap",
        "modifieddate": "2018-01-24 13:00:00",
        "url":       "http://MyServer/download/geopaparazzi/data/demo/bolzano/geopaparazzi_trip_bolzano.gpap",
      },
      "tags": {
        "path": "/geopaparazzi/data/demo/bolzano/bolzano_field_survey_en.json",
        "modifieddate": "2018-01-24 13:00:00",
        "url": "http://MyServer/download/geopaparazzi/data/demo/bolzano/bolzano_field_survey_en.json"
      },
      "basemaps": [
        {
          "path": "/geopaparazzi/data/demo/bolzano/mapnik.mapurl",
          "modifieddate": "2018-01-24 13:00:00",
          "url": "http://MyServer/download/geopaparazzi/data/demo/bolzano/mapnik.mapurl"
        }
      ],
      "spatialitedbs": [
        {
          "path": "/geopaparazzi/data/demo/bolzano/wfs_bz_db.sqlite",
          "modifieddate": "2018-01-24 13:00:00",
          "url": "http://MyServer/download/geopaparazzi/data/demo/bolzano/wfs_bz_db.sqlite",
          "visible": ["administrativeunit"]
        }
      ]
    }
  ]
}
11.1.2. Cloud Profile Server
If you look at the sample Cloud Profiles in the previous section, you will see that the URLs for the files are fairly simple. This allow the Cloud Profile server to a generic files server or your own web server with more sophisticated features such as username/pasword access, URL re-writing, spatial database creation and more.
Using Generic Cloud Servers
You can set up your own Cloud Profile server by putting your files on a generic cloud file server like Dropbox or Google Drive, and editing a Cloud Profiles list like the one above and putting it on the cloud file server as well.
Geopaparazzi Cloud Server
A pre-configured Open Source Geopaparazzi Cloud Server is available. Have a look at A reference server for geopaparazzi cloud profiles
11.2. The Geopaparazzi Survey Server
The Geopaparazzi Survey Server (GSS) is a web application with a companion Android/Desktop utility application that allows users to synchronize geopaparazzi survey projects. Notes, GPS Logs and Media are sent to a central server using the ID of the device.
Read more about GSS in this section of the documentation.
12. Geopaparazzi & gvSIG
The most updated tools for Geopaparazzi inside a GIS are the ones that are found in the open source GIS gvSIG, since they are maintained by the same team that develops geopaparazzi.
A quickstart guide about the installation of the right plugins and the available functionalities can be found on the plugin’s website.
13. Using form based notes
Geopaparazzi supports collecting complex notes called form based notes. To use them, you need to create a tags.json file and place it inside the geopaparazzi folder. That file contains a json format of your forms. Geopaparazzi will use that form definition to render a form in Geopaparazzi allowing the user to take specific Notes. Those Notes are saved in the Geopaparazzi project file in the notes table.
By default, to help the user to start, a sample tags.json is created in the Geopaparazzi installation. It contains form samples and examples to show all supported form widgets.
Currently no tool is available to create forms in an interactive way, they have to be created manually in a text editor.
A good online tool to at least validate your json tags file is the Json Lint Validator. Make sure it passes that test before putting it on the device and test it in Geopaparazzi.
13.1. Supported tags (via the example form)
The example form that is available by default shows all the possible options available.
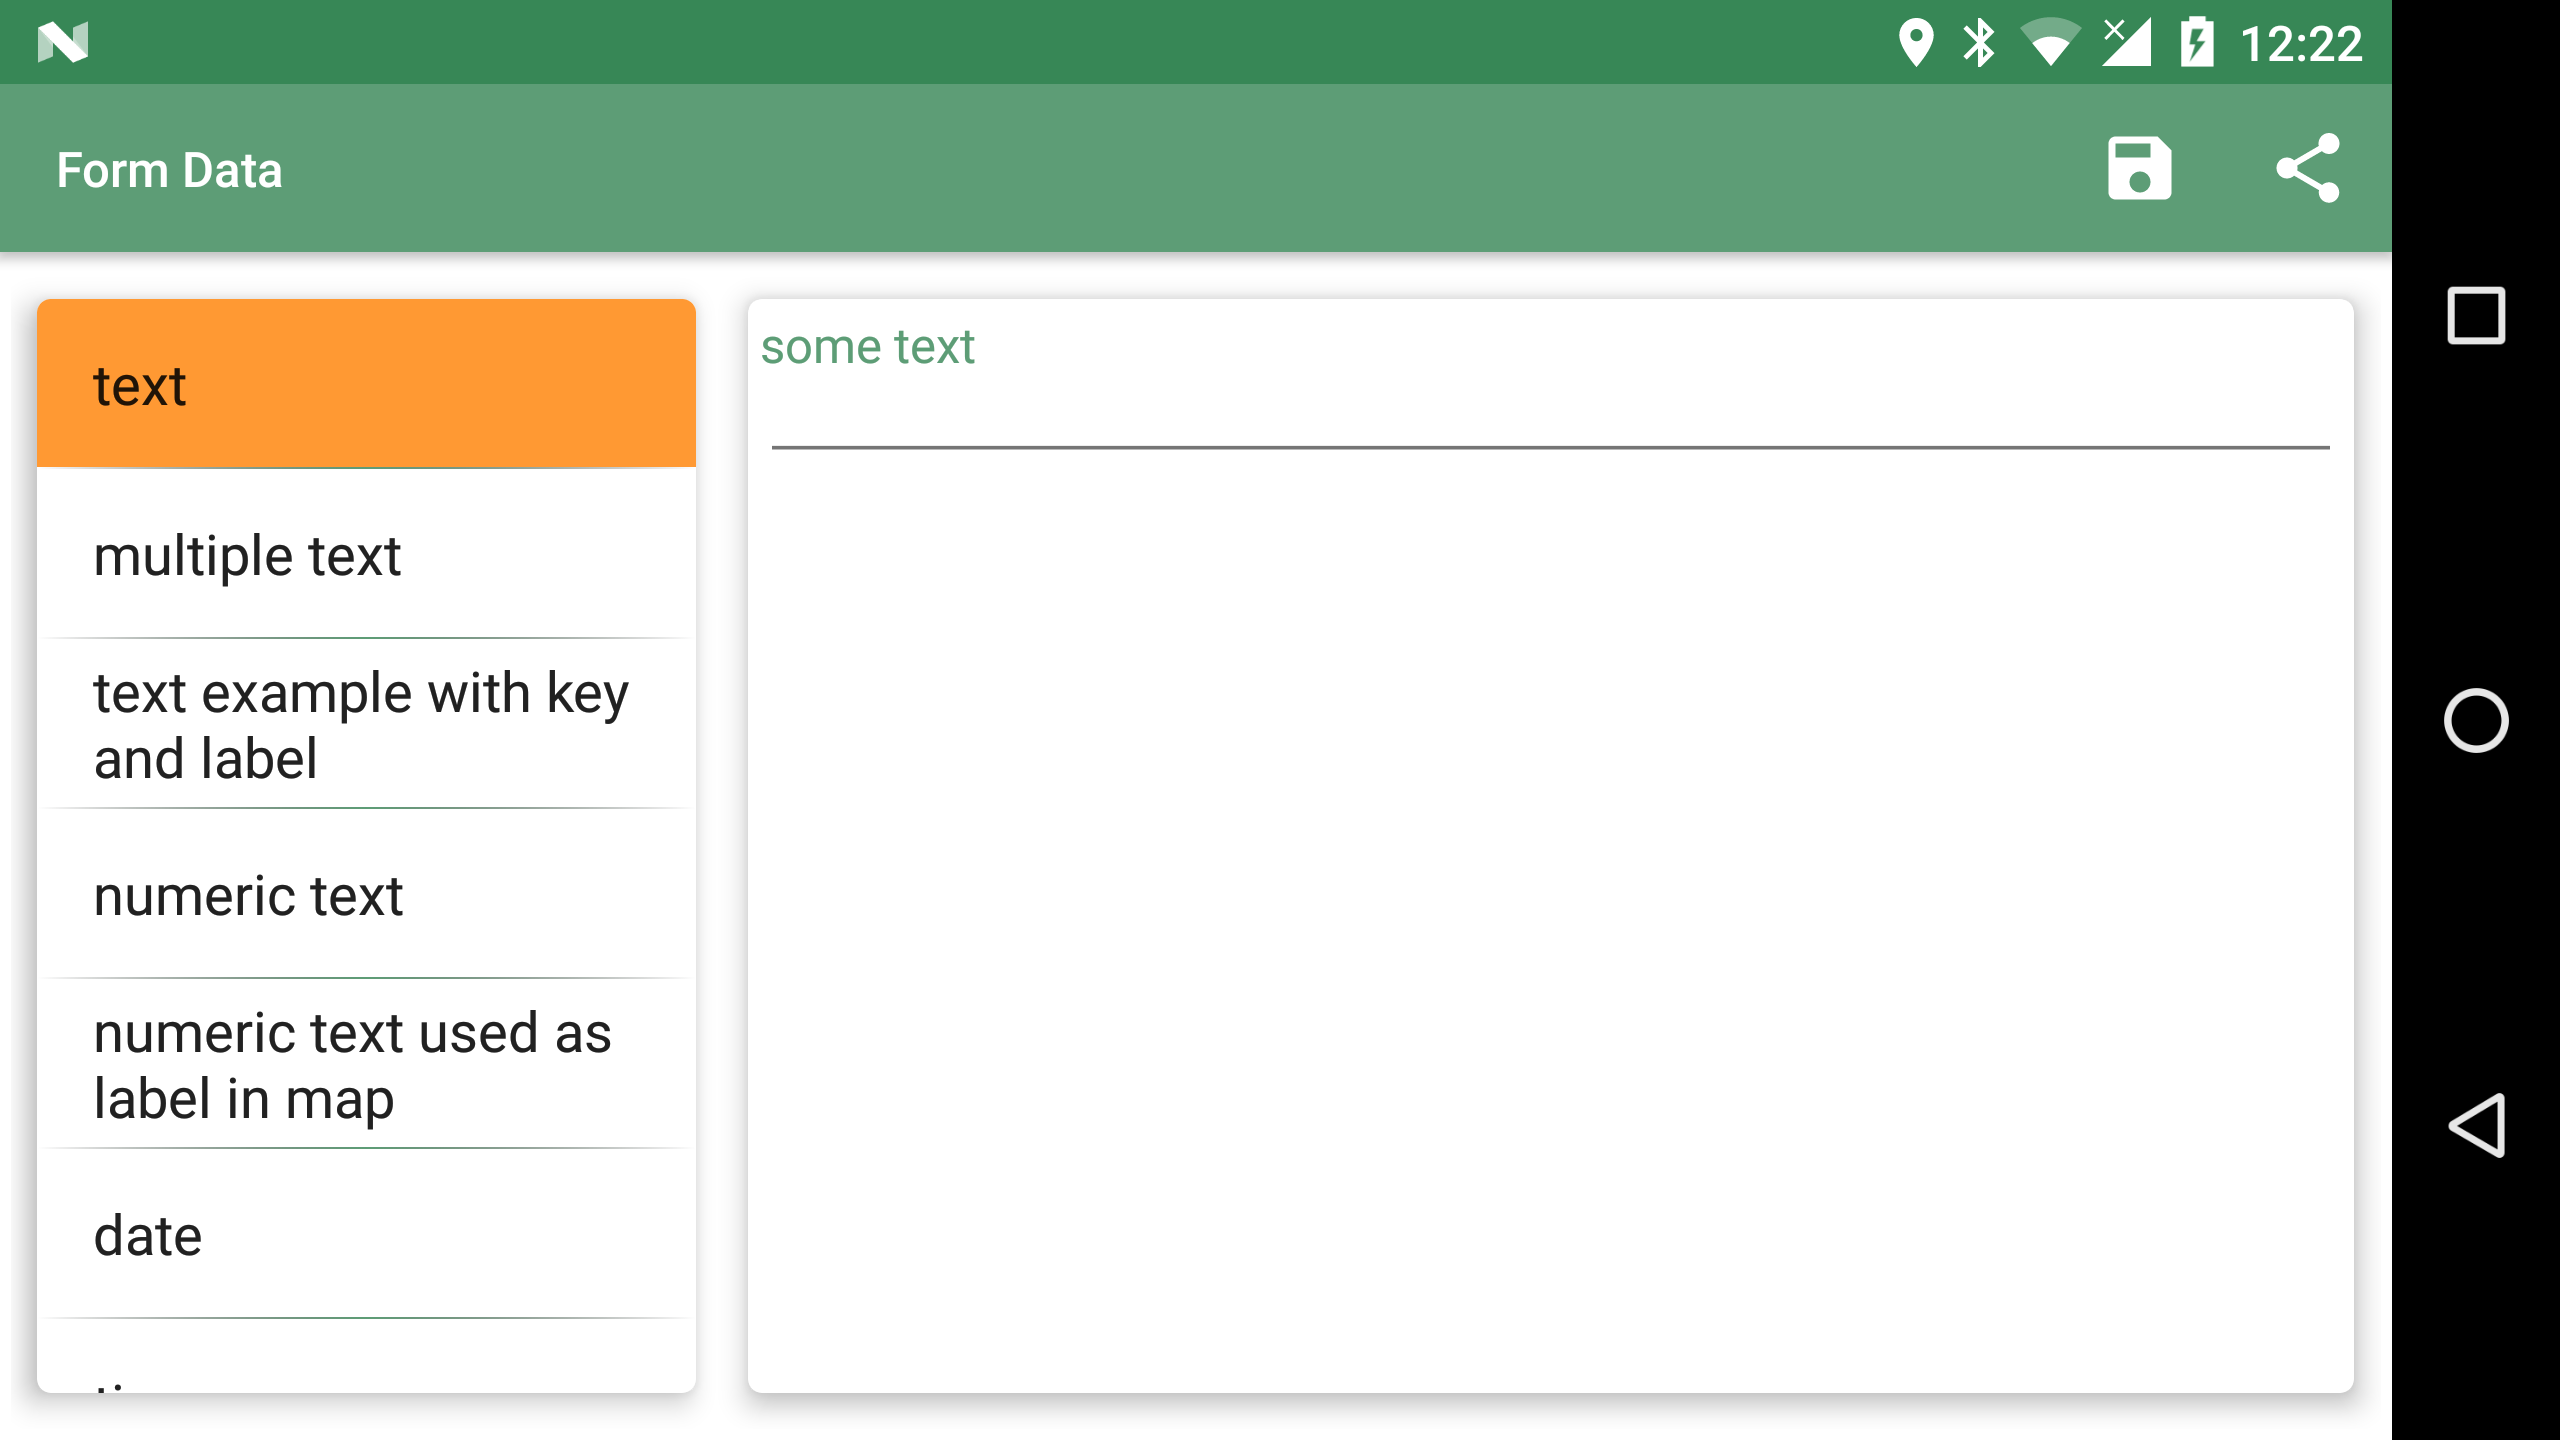
13.1.1. Text
      "formname": "text",
      "formitems": [
          {
              "key": "some text",
              "value": "",
              "type": "string"
          }
      ]
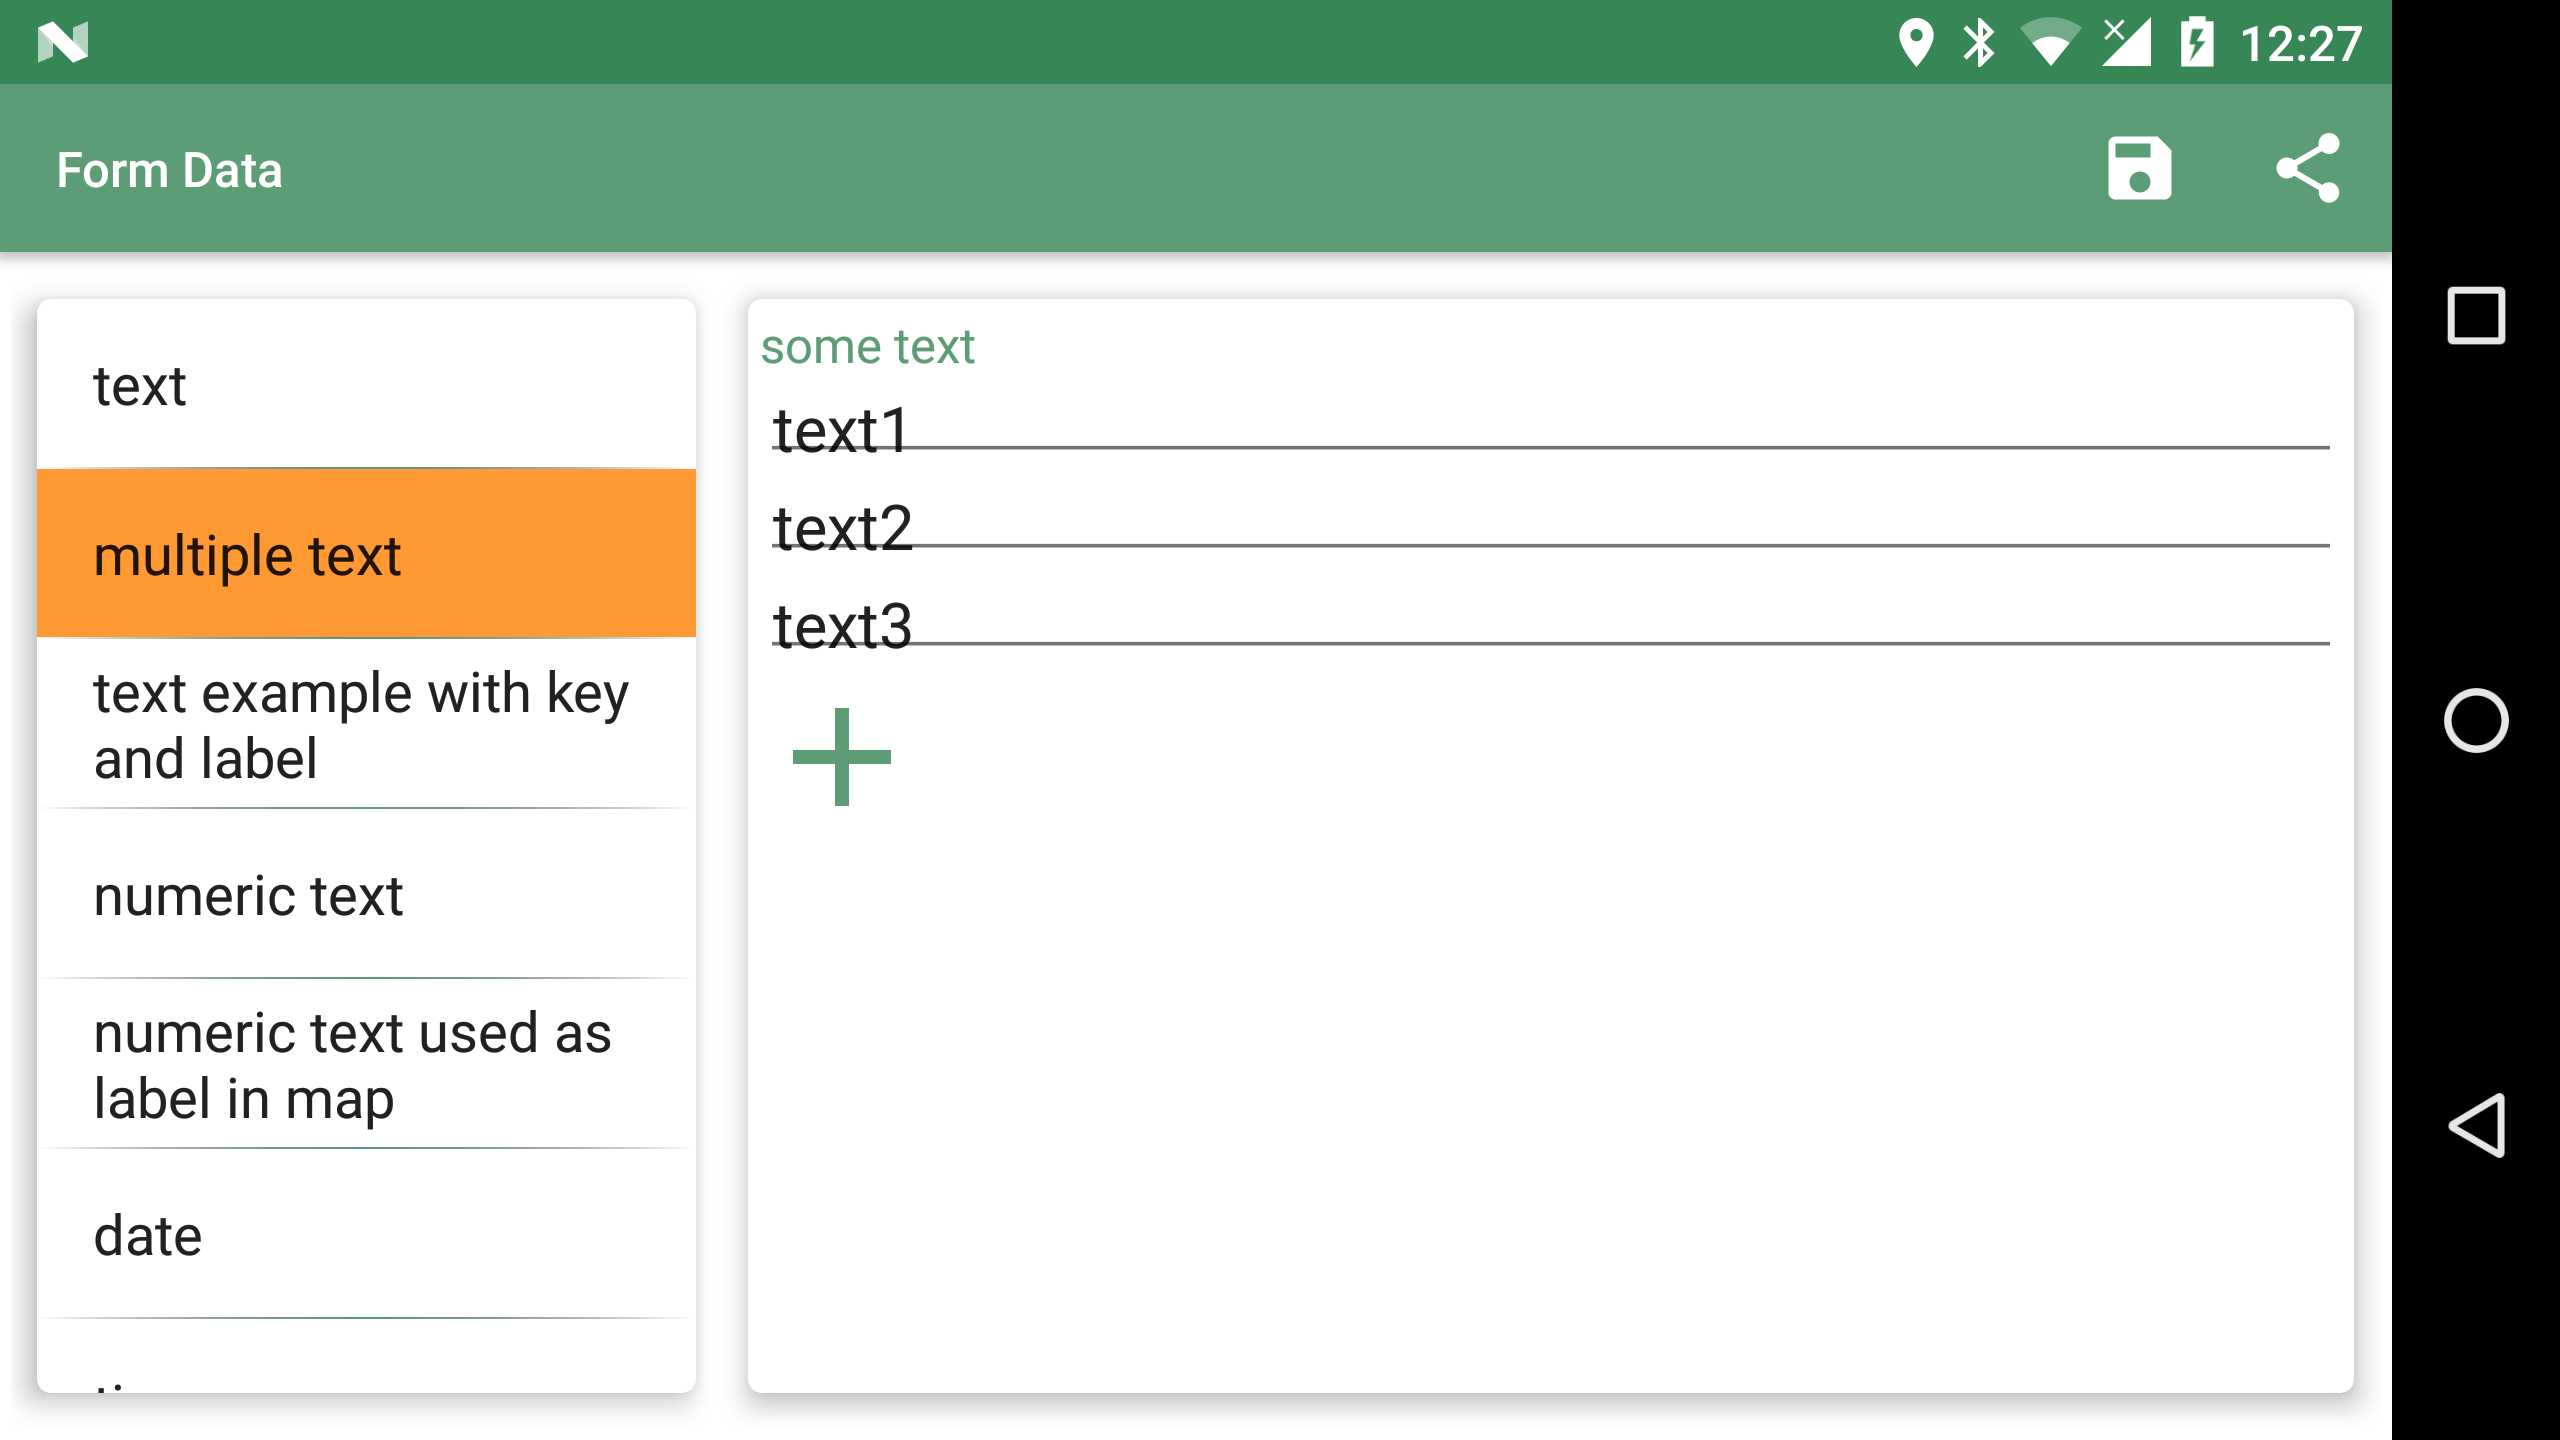
13.1.2. Multiple Text
      "formname": "multiple text",
      "formitems": [
          {
              "key": "some text",
              "value": "text1; text2; text3",
              "type": "dynamicstring"
          }
      ]
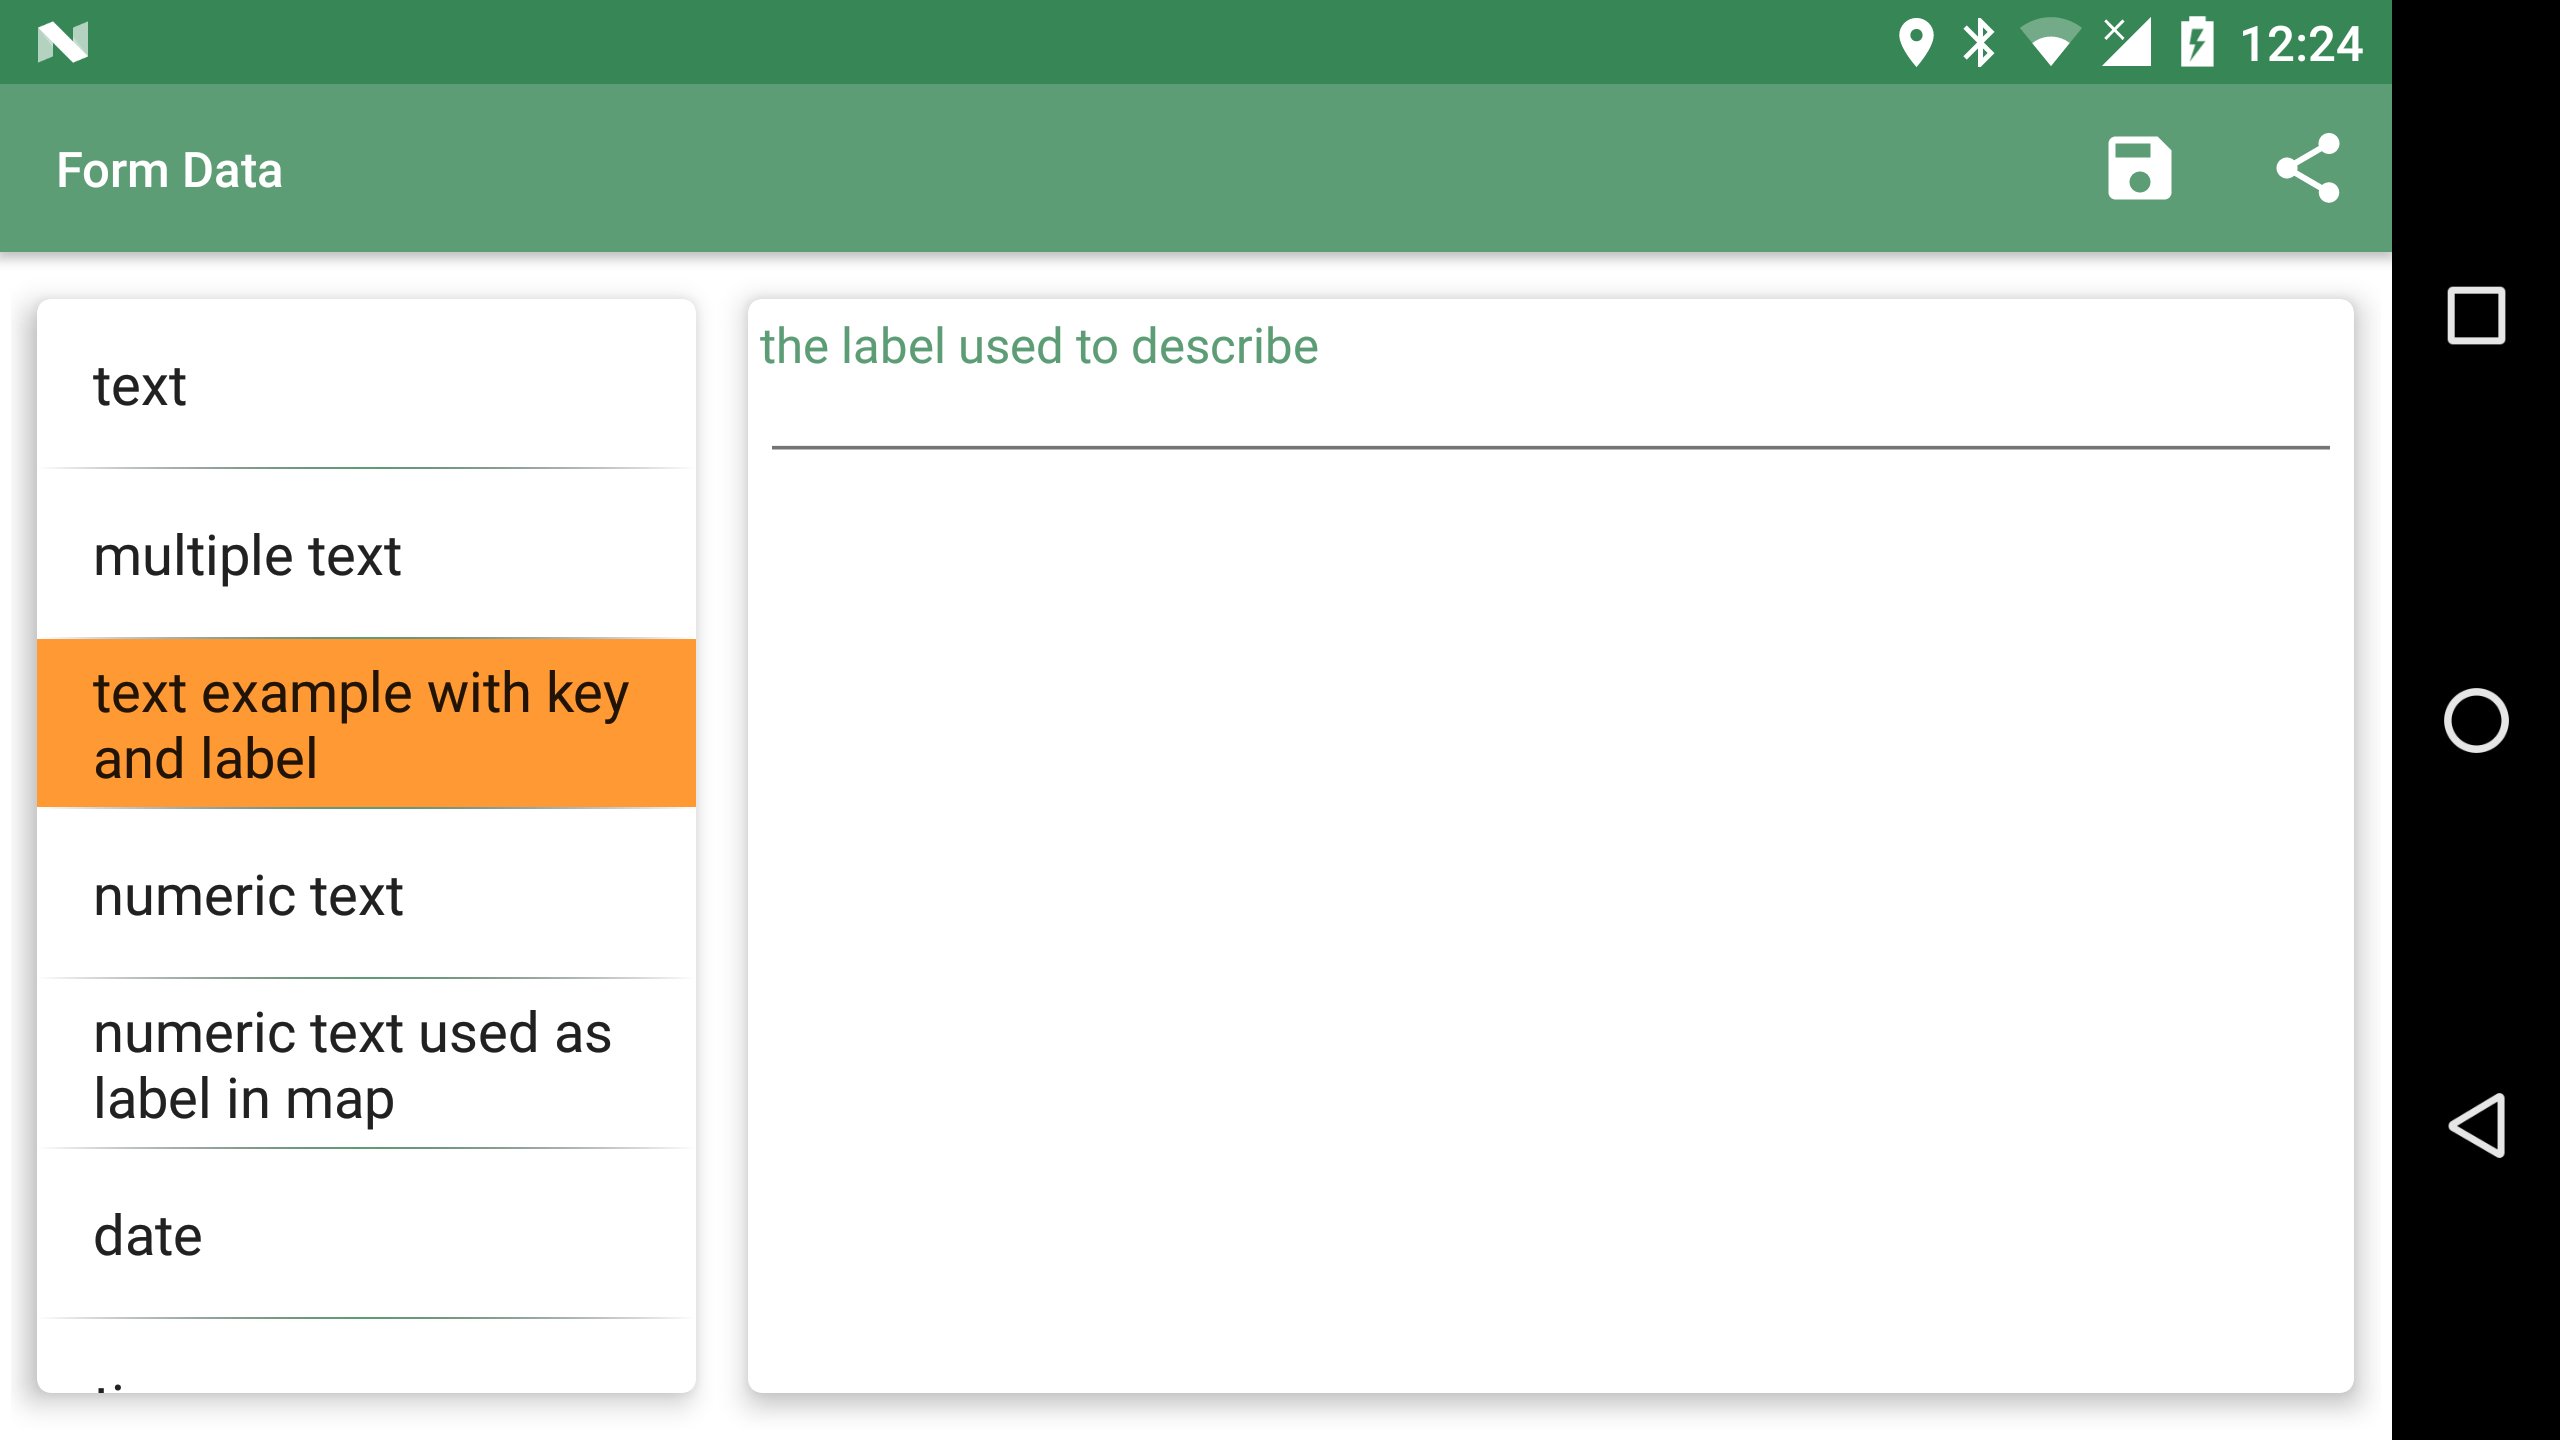
13.1.3. Text with key and label
In simple forms the key element is also used as form label text for the widget (ex. some text in the text note). Some character sets are not suitable to be used as keys for a database, so in that cases the user should consider to define both the key (ex. in English) and the label (in the own language). Here an example:
"formname": "text example with key and label",
"formitems": [
    {
        "key": "the_key_used_to_index",
        "label": "the label used to describe",
        "value": "",
        "type": "string"
    }
]
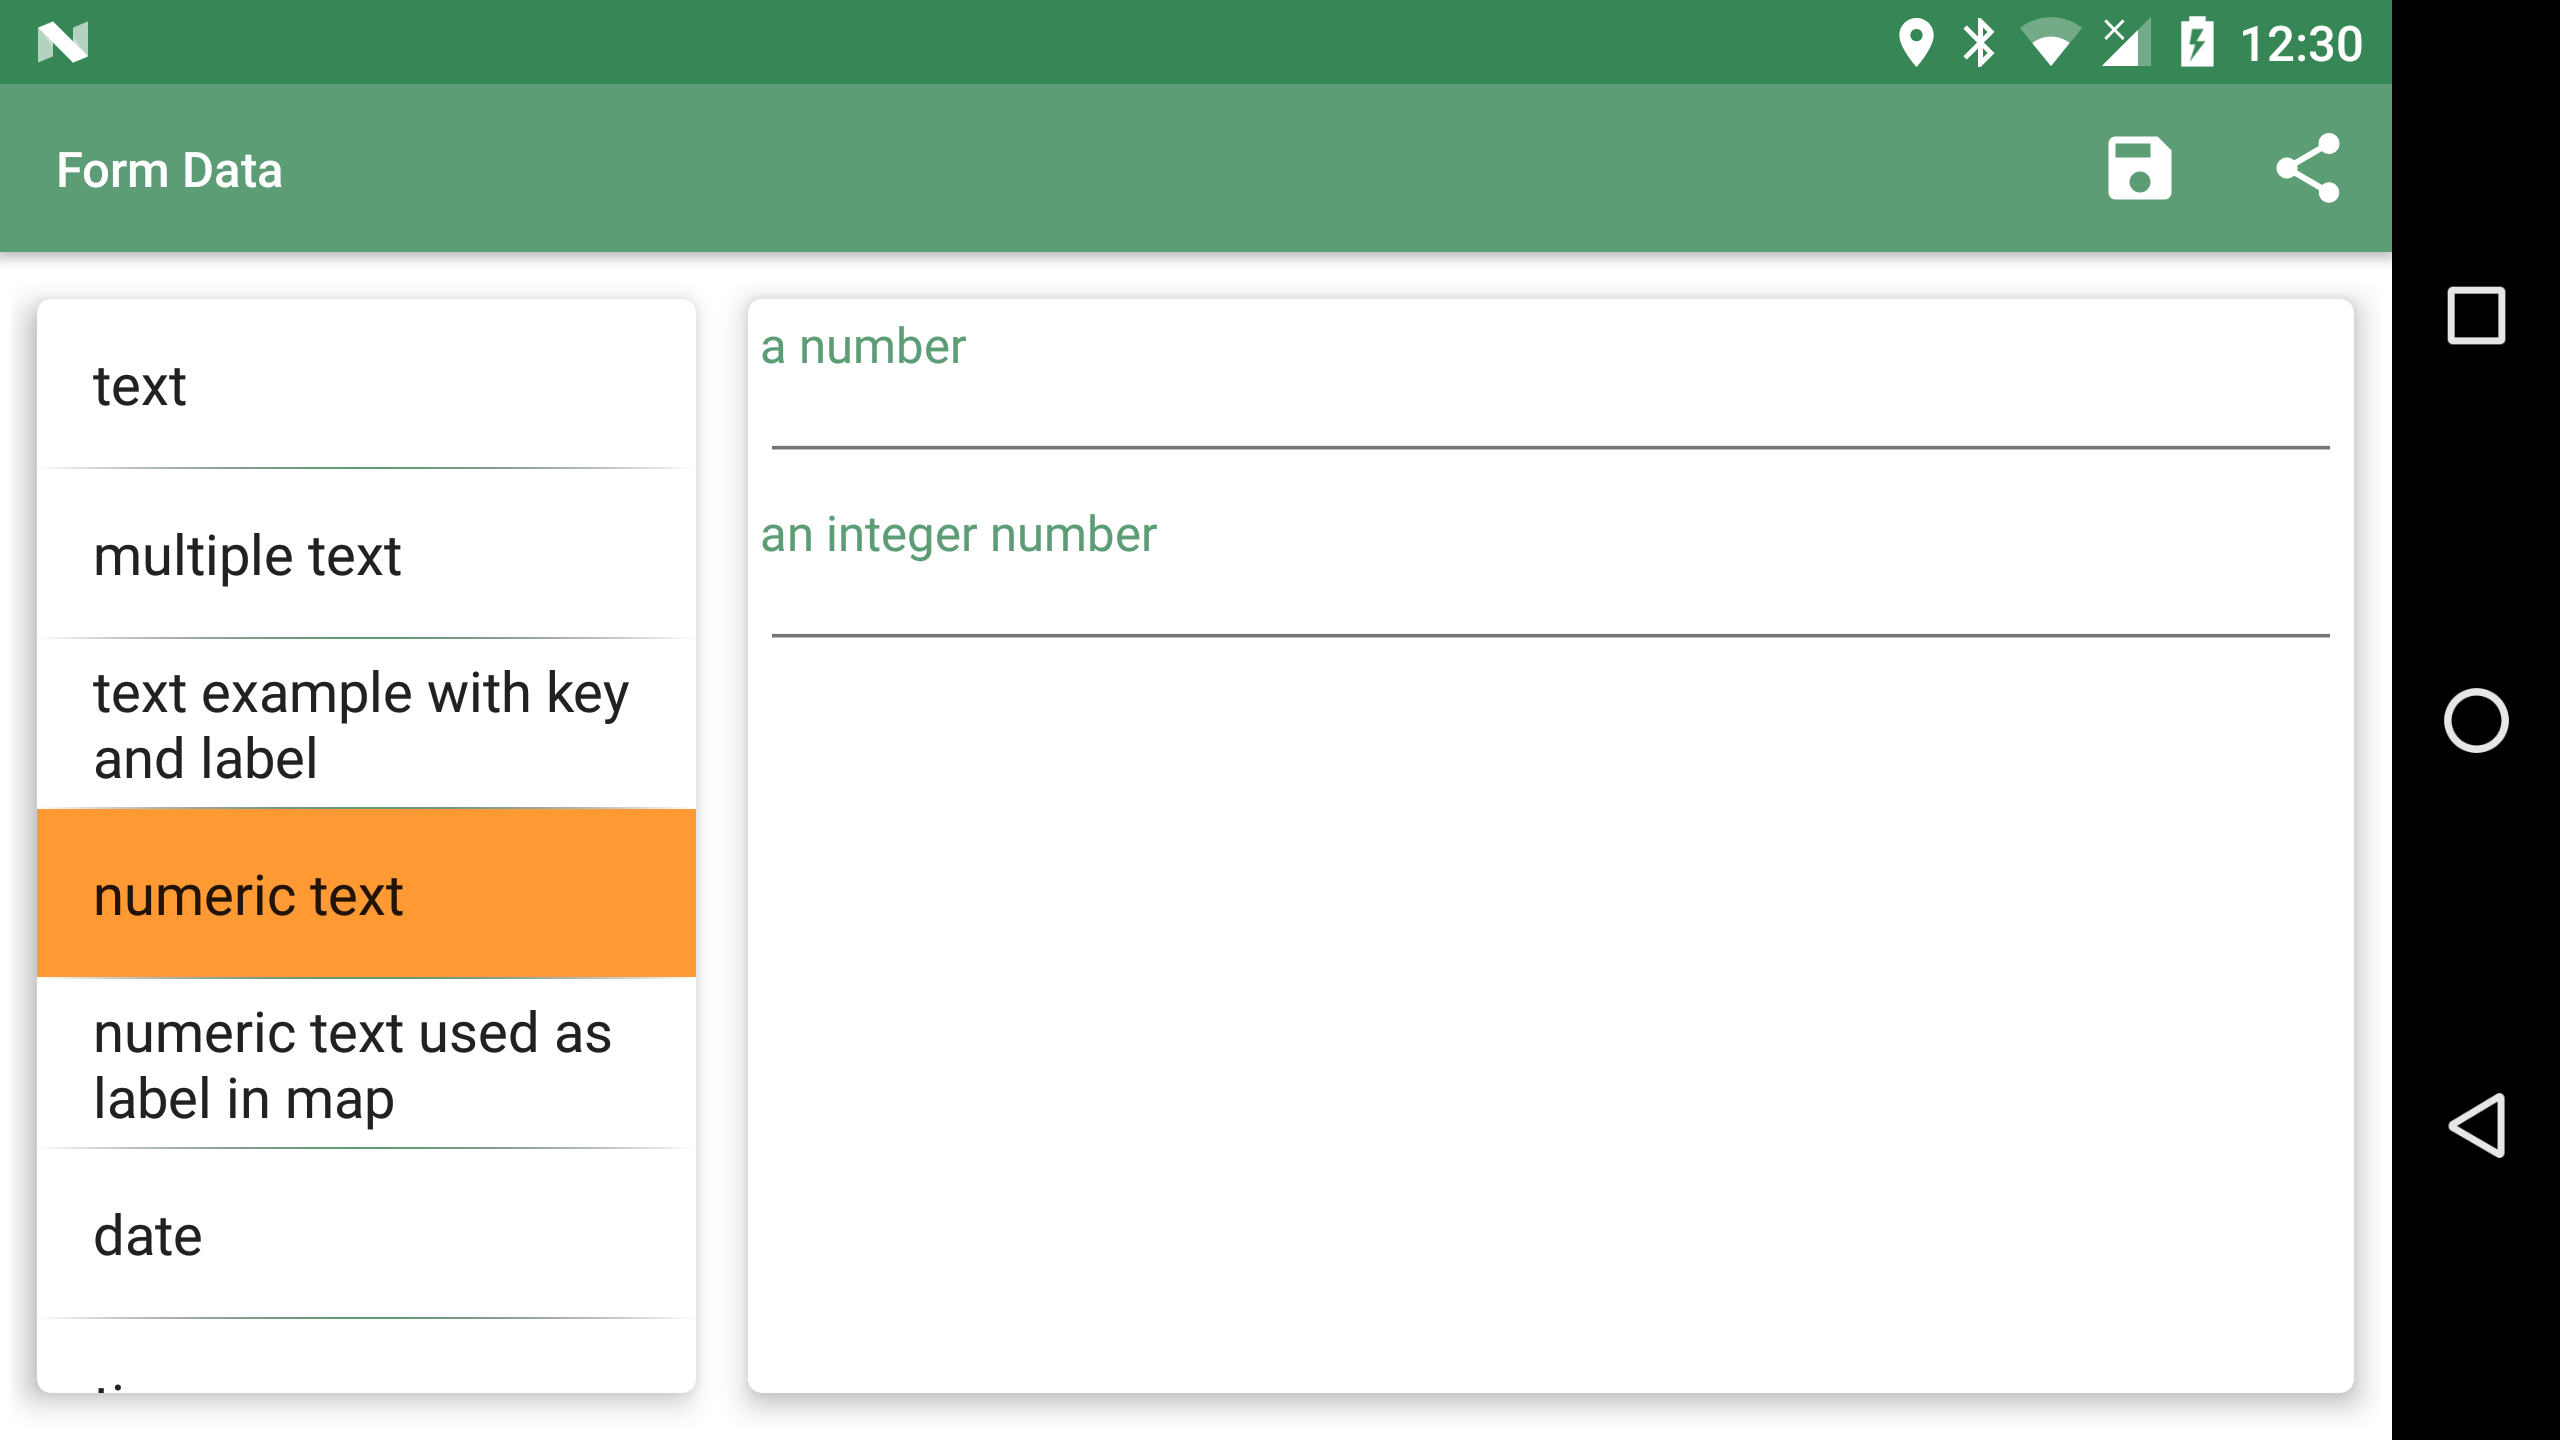
13.1.4. Numbers
"formname": "numeric text",
"formitems": [
    {
        "key": "a number",
        "value": "",
        "type": "double"
    },{
        "key": "an integer number",
        "value": "",
        "type": "integer"
    }
]
To use one of the values as a map label in the map view add the islabel tag:
"formname": "numeric text used as label in map",
"formitems": [
{
"key": "a number",
"value": "",
"islabel": "true",
"type": "double"
},{
"key": "an integer number",
"value": "",
"type": "integer"
}
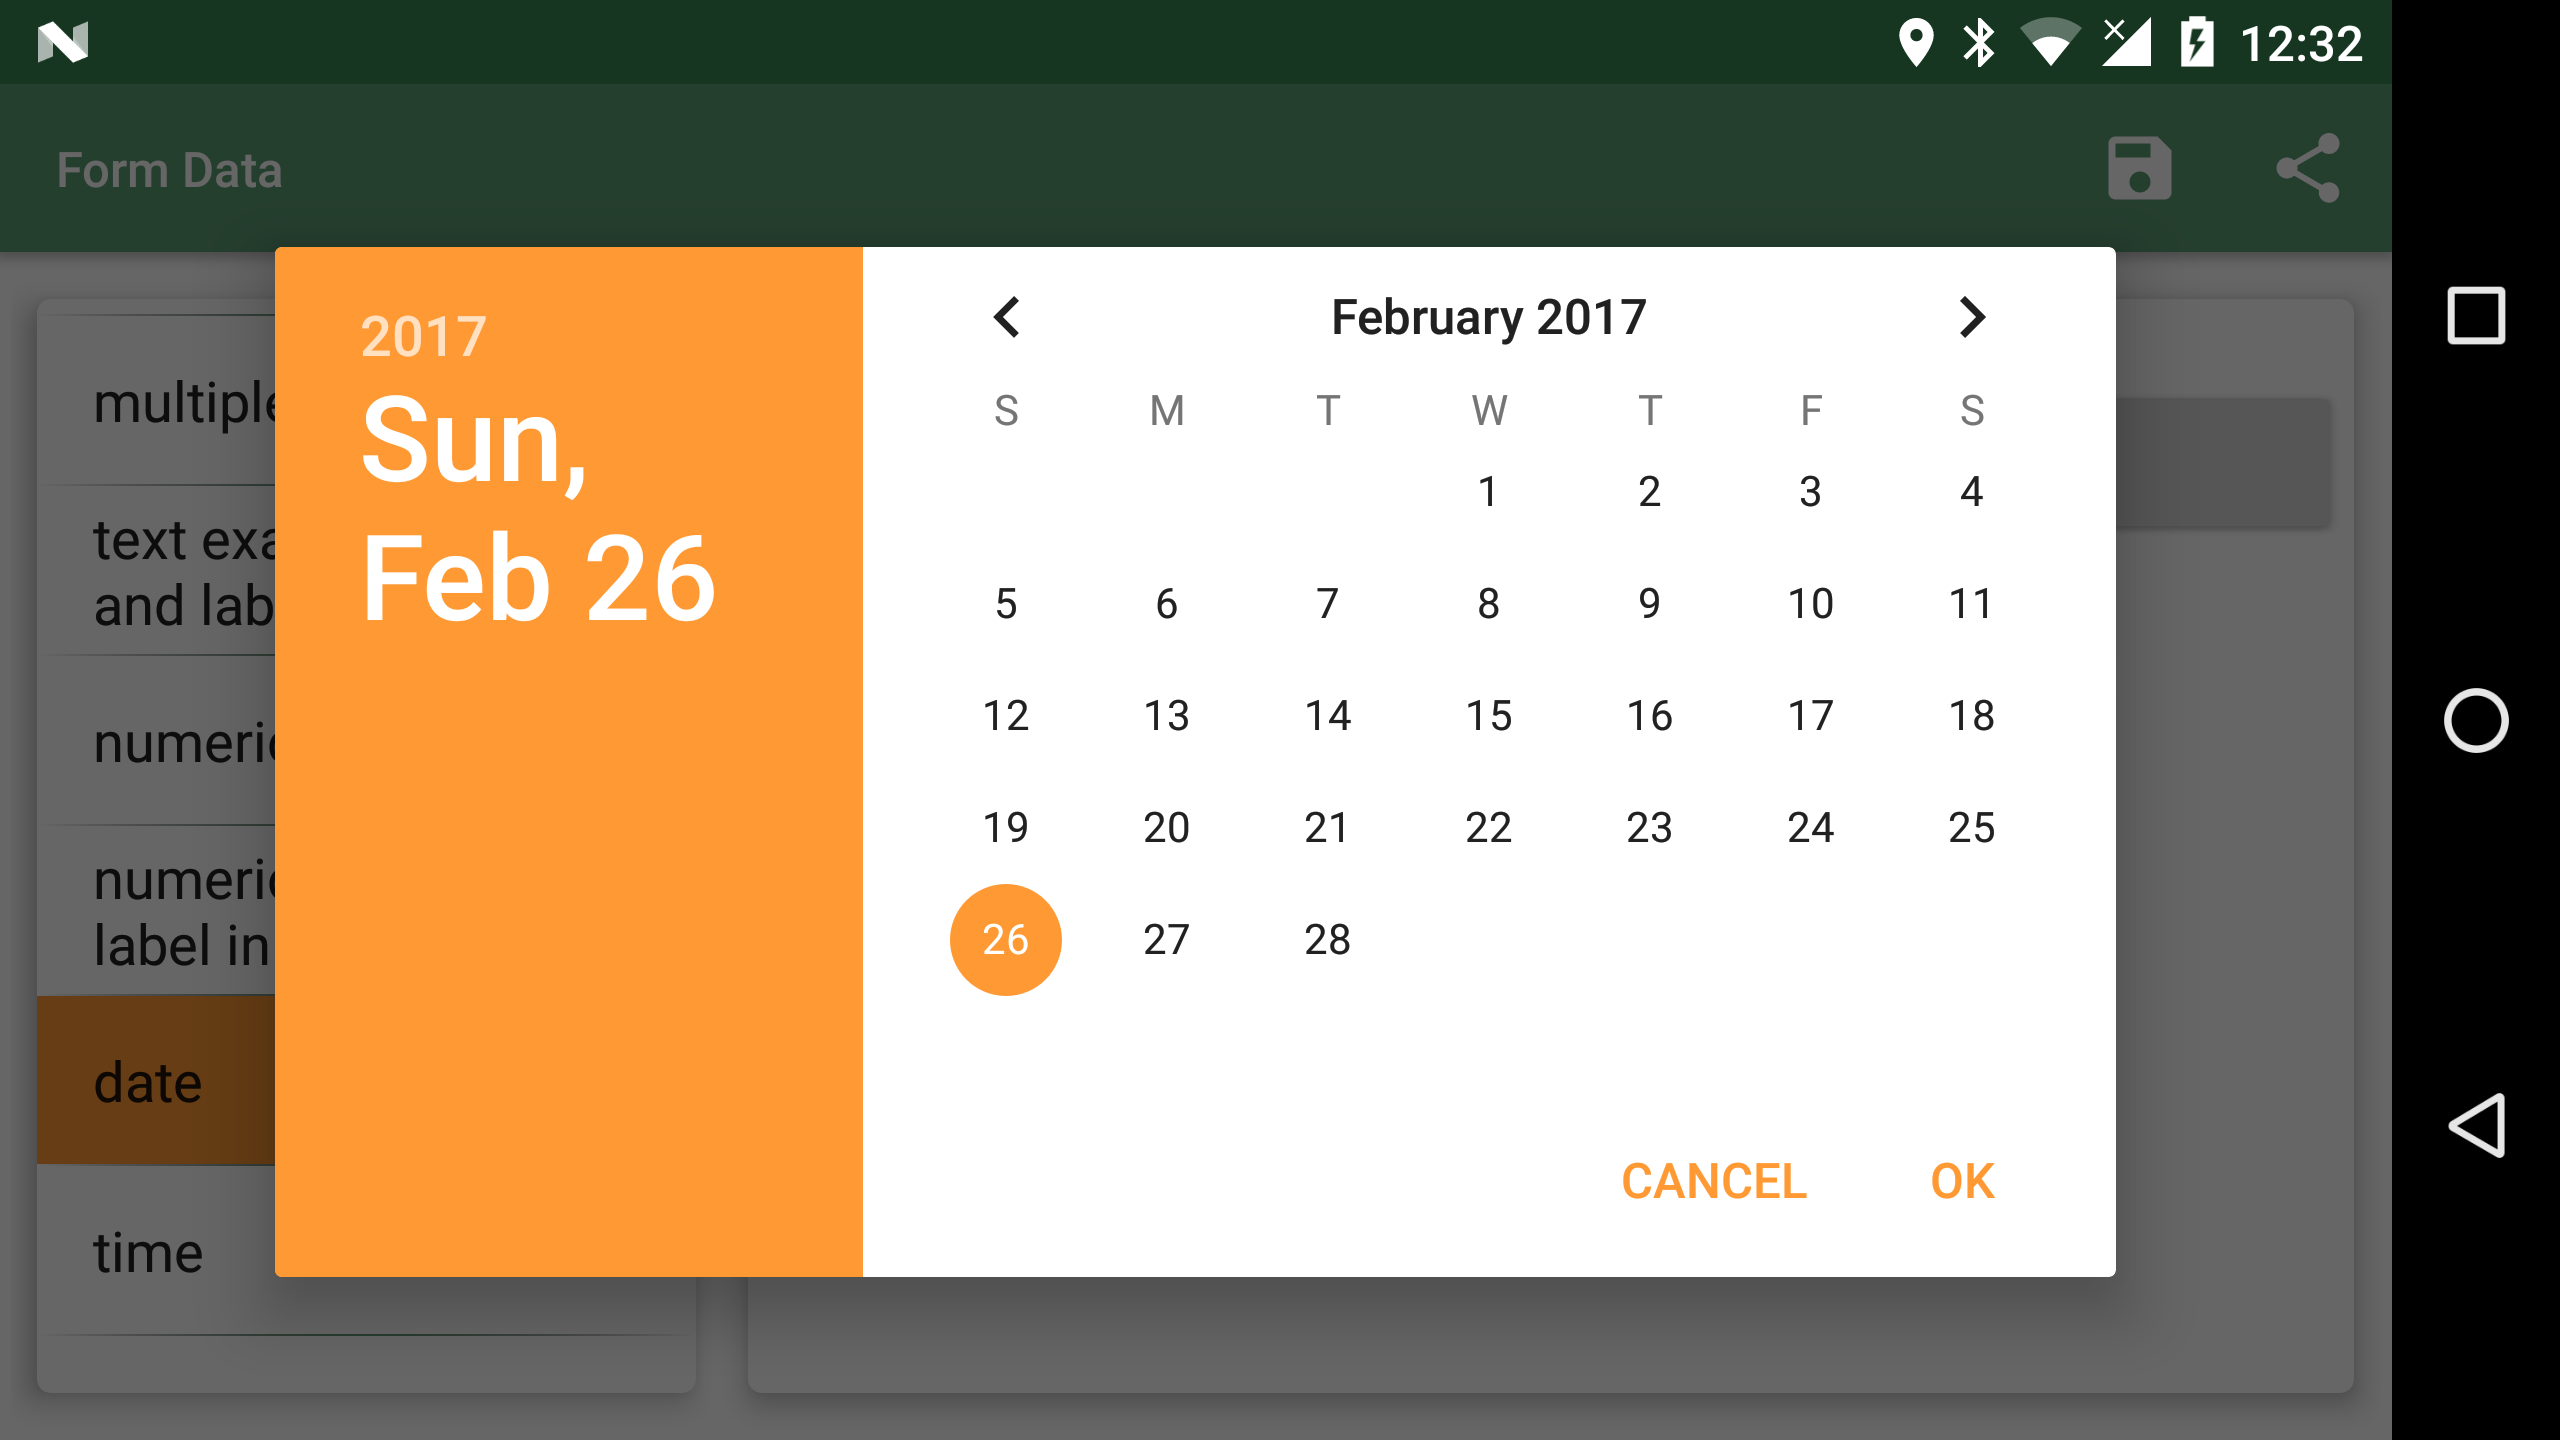
]13.1.5. Date
"formname": "date",
"formitems": [
    {
        "key": "a date",
        "value": "",
        "type": "date"
    }
]
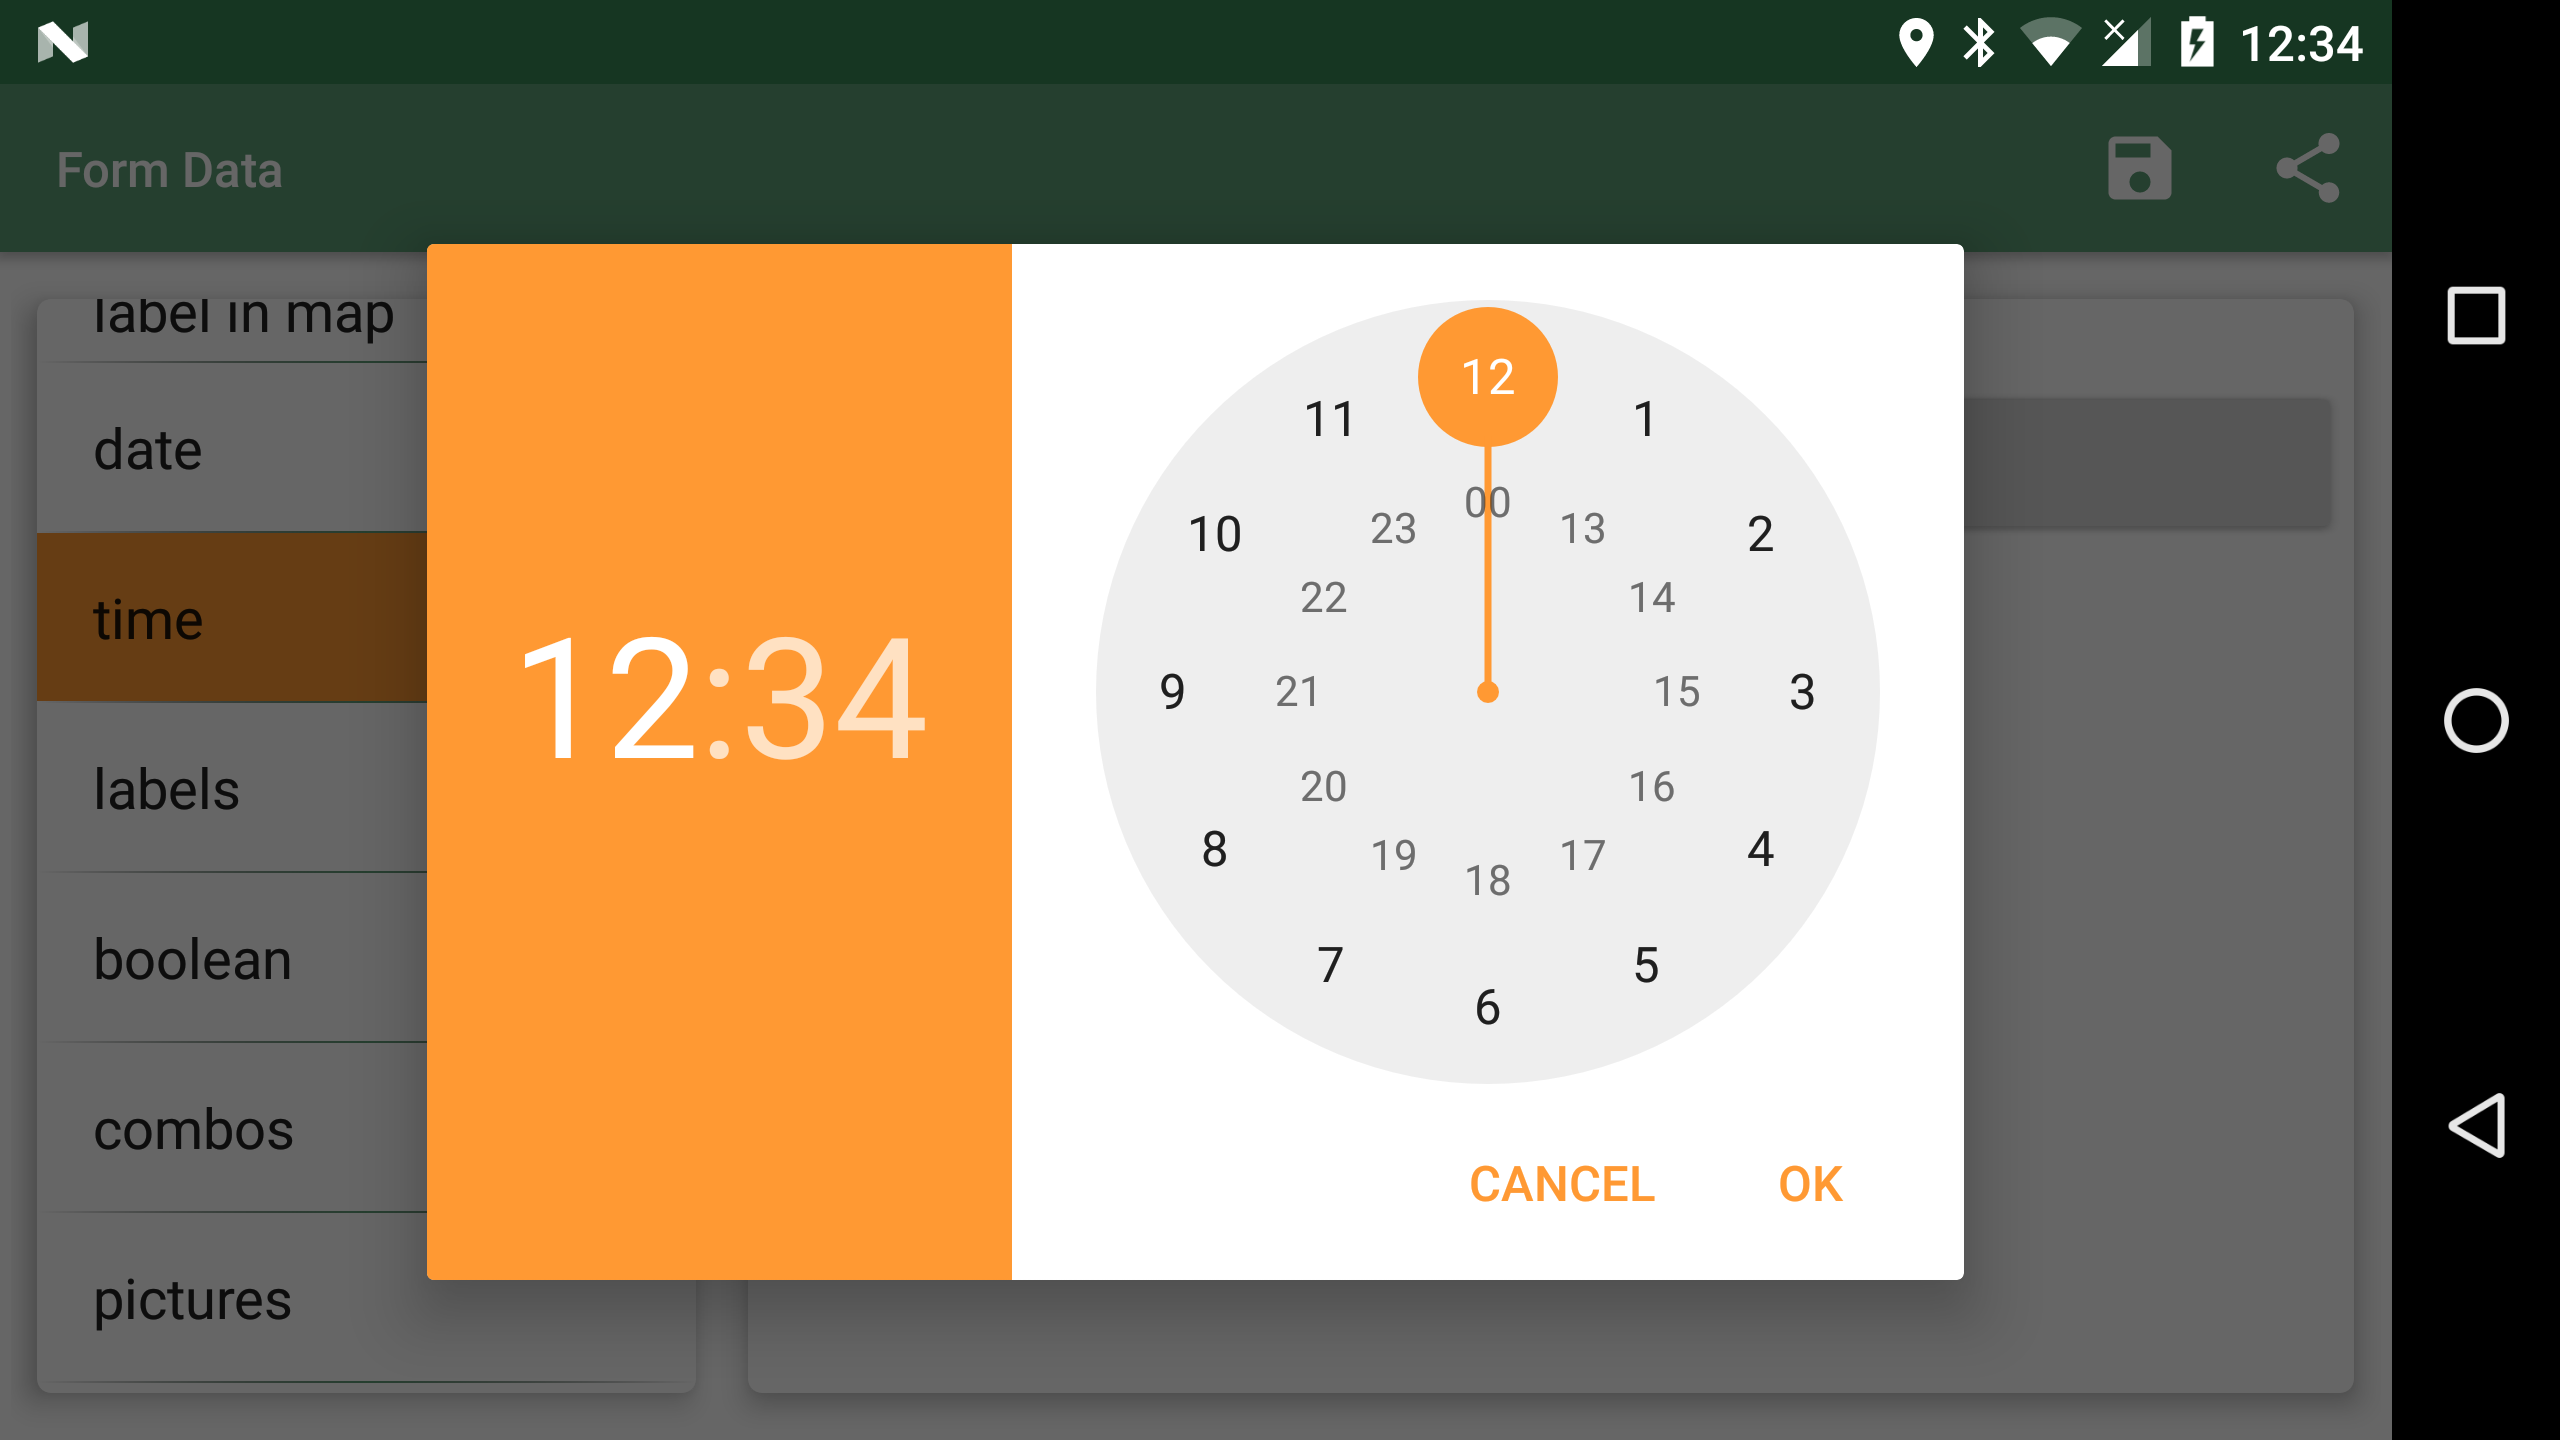
13.1.6. Time
"formname": "time",
"formitems": [
    {
        "key": "a time",
        "value": "",
        "type": "time"
    }
]
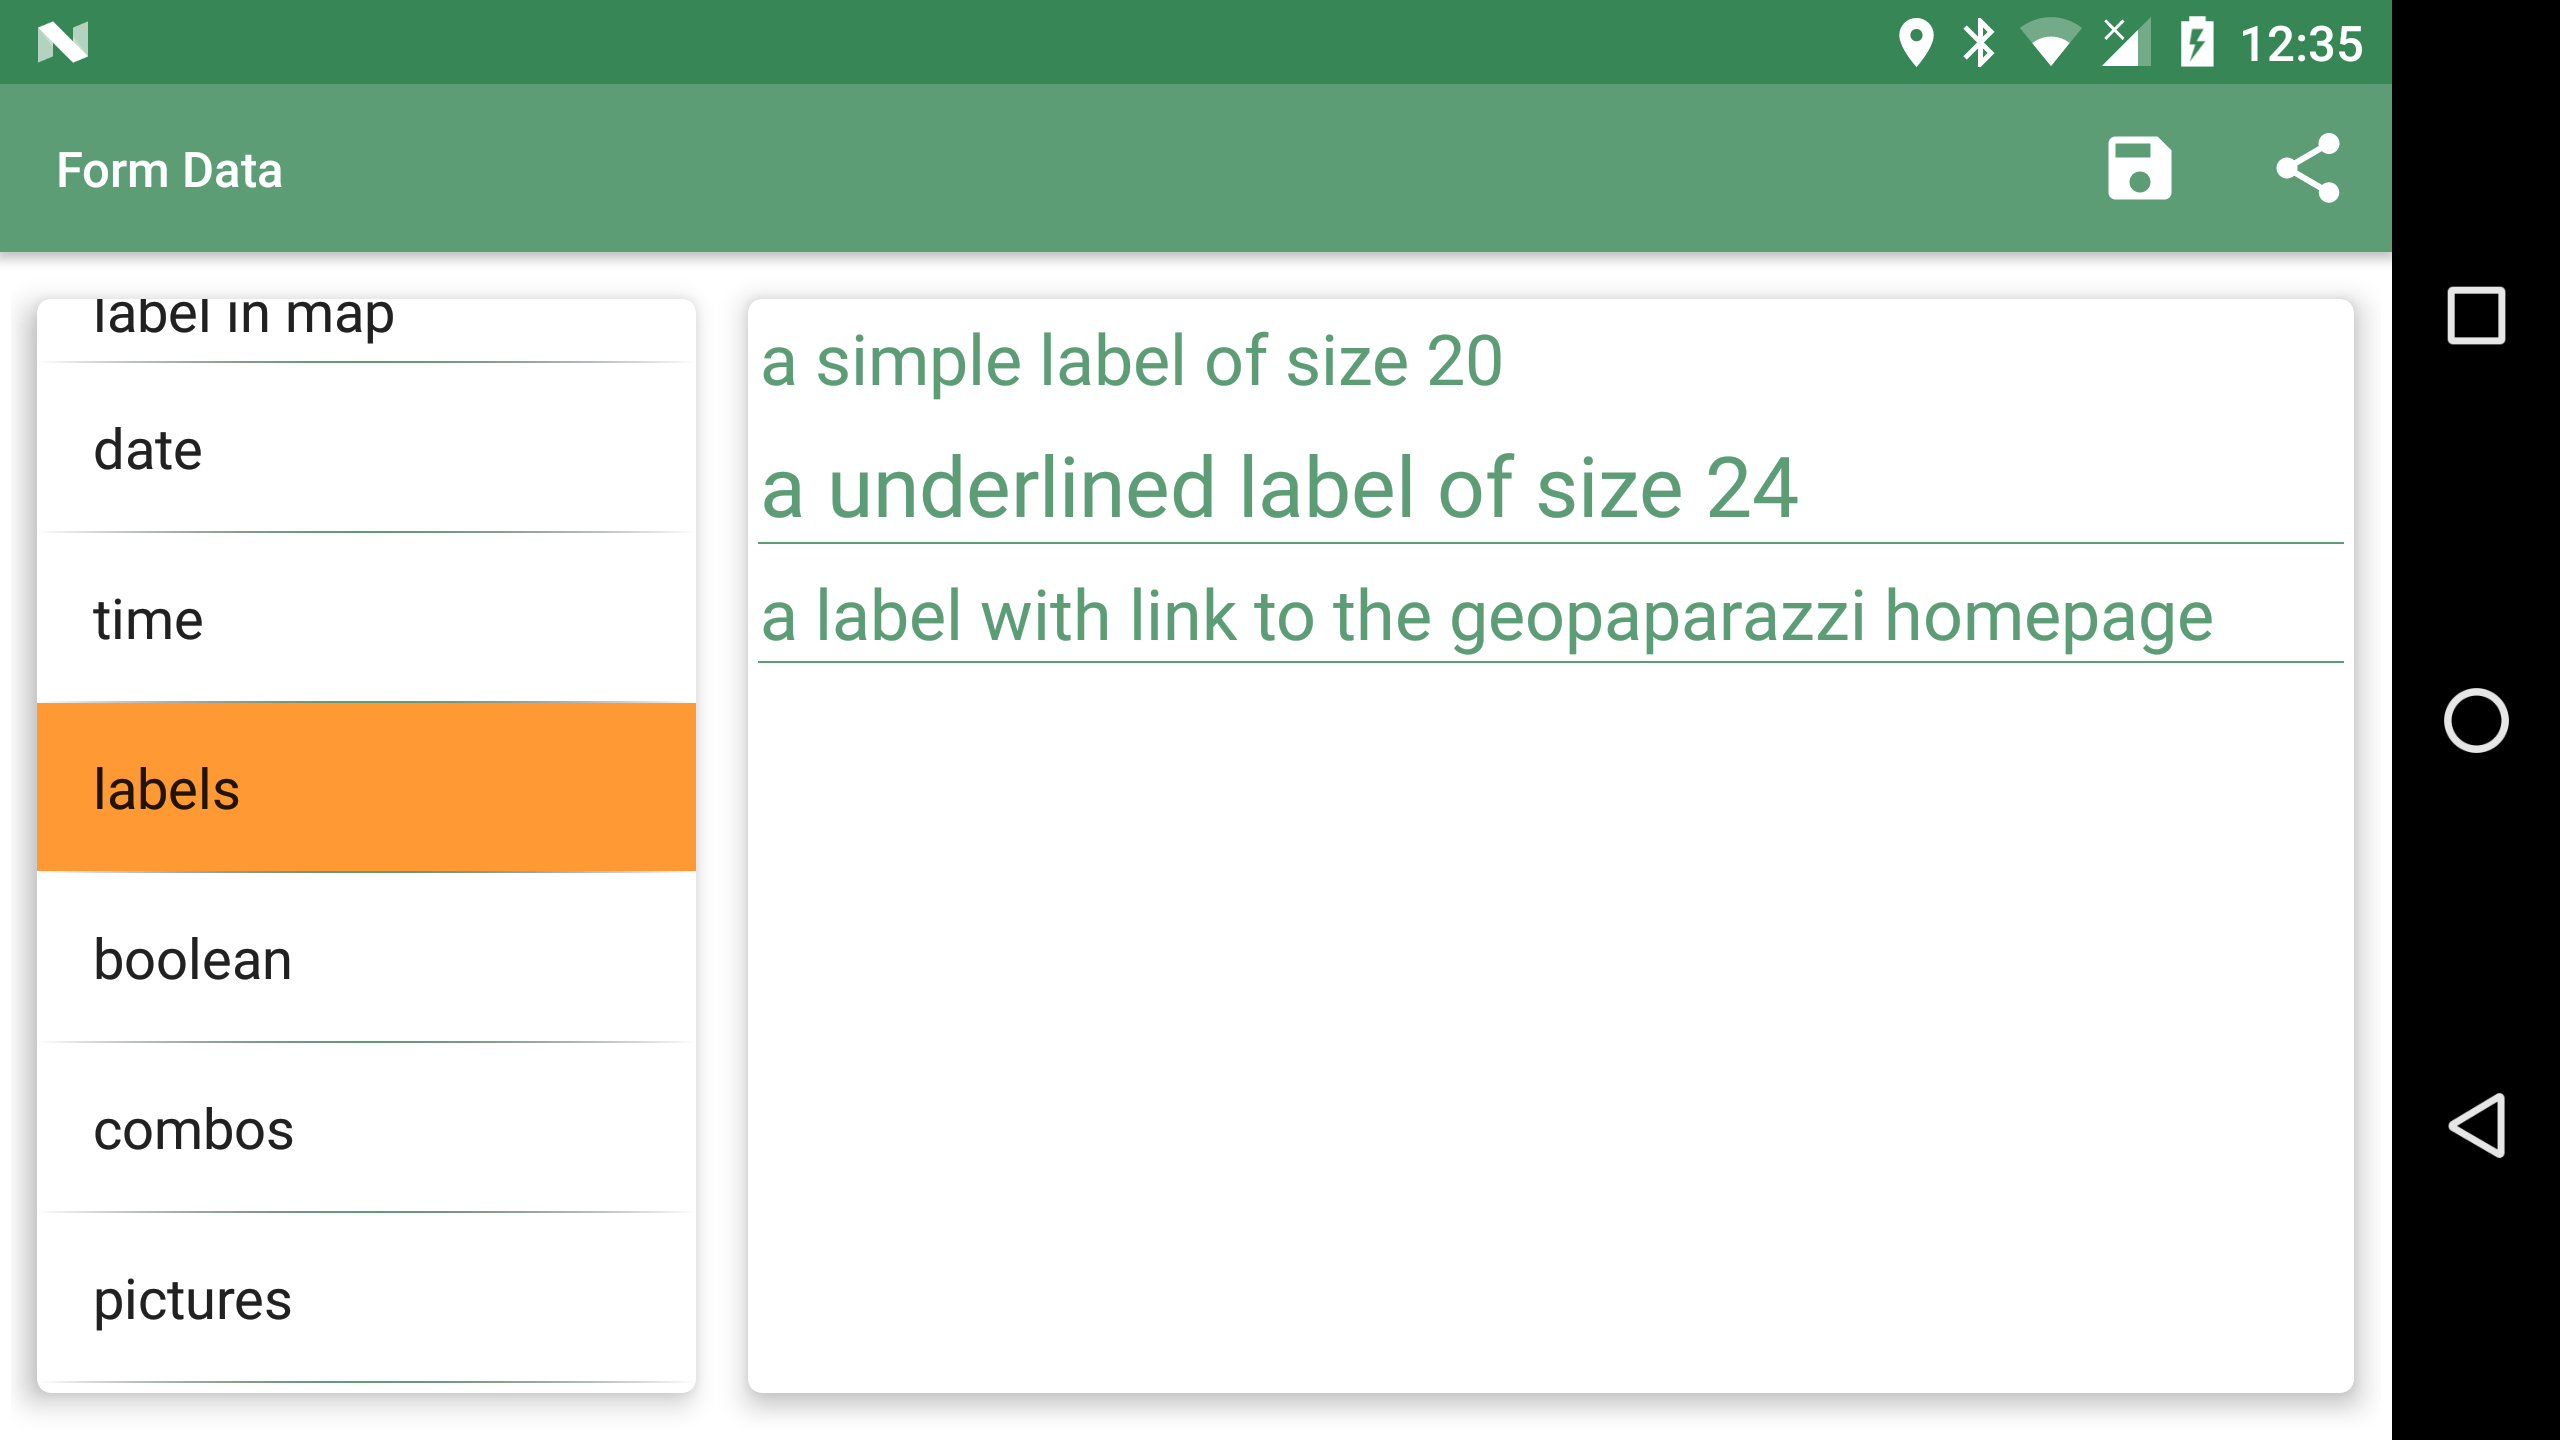
13.1.7. Labels
A formitem with a of type = label is useful for showing some extra text on your form. It has no input field.
"formname": "labels",
"formitems": [
    {
        "value": "a simple label of size 20",
        "size": "20",
        "type": "label"
    },{
        "value": "a underlined label of size 24",
        "size": "24",
        "type": "labelwithline"
    },{
        "value": "a label with link to the geopaparazzi homepage",
        "url": "http://www.geopaparazzi.eu",
        "size": "20",
        "type": "labelwithline"
    }
]
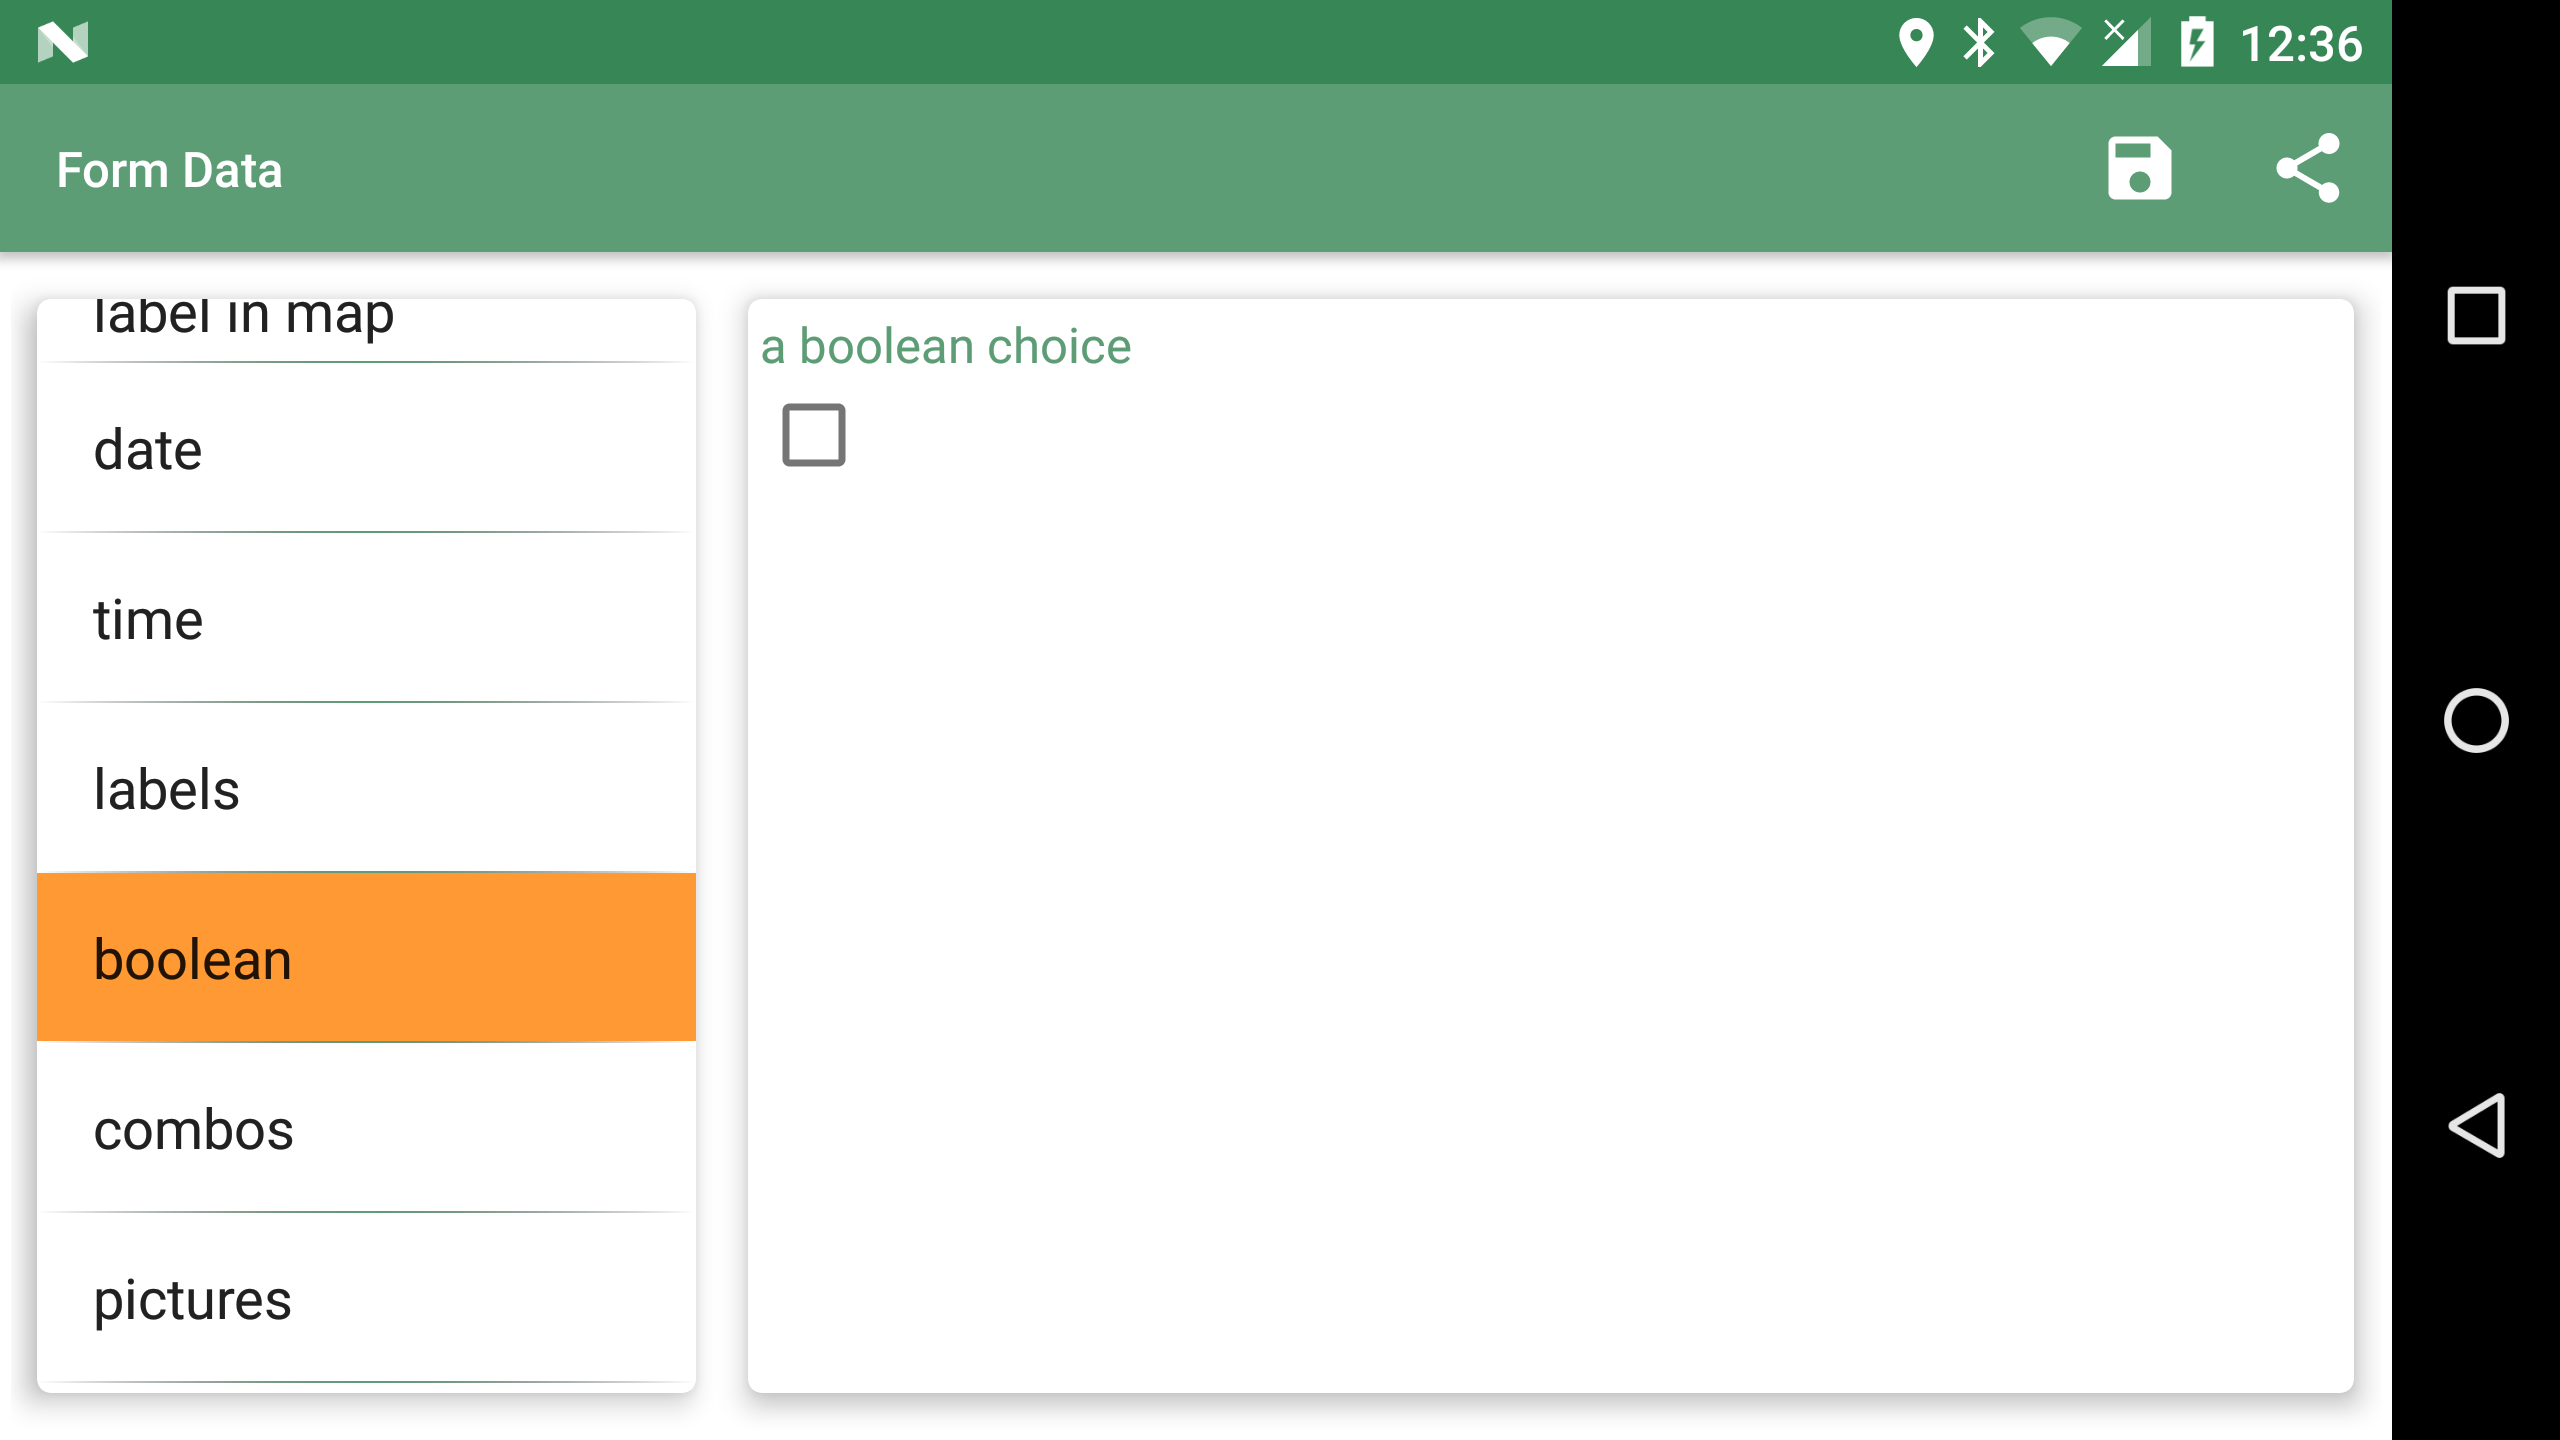
13.1.8. Checkbox
"formname": "boolean",
"formitems": [
    {
        "key": "a boolean choice",
        "value": "",
        "type": "boolean"
    }
]
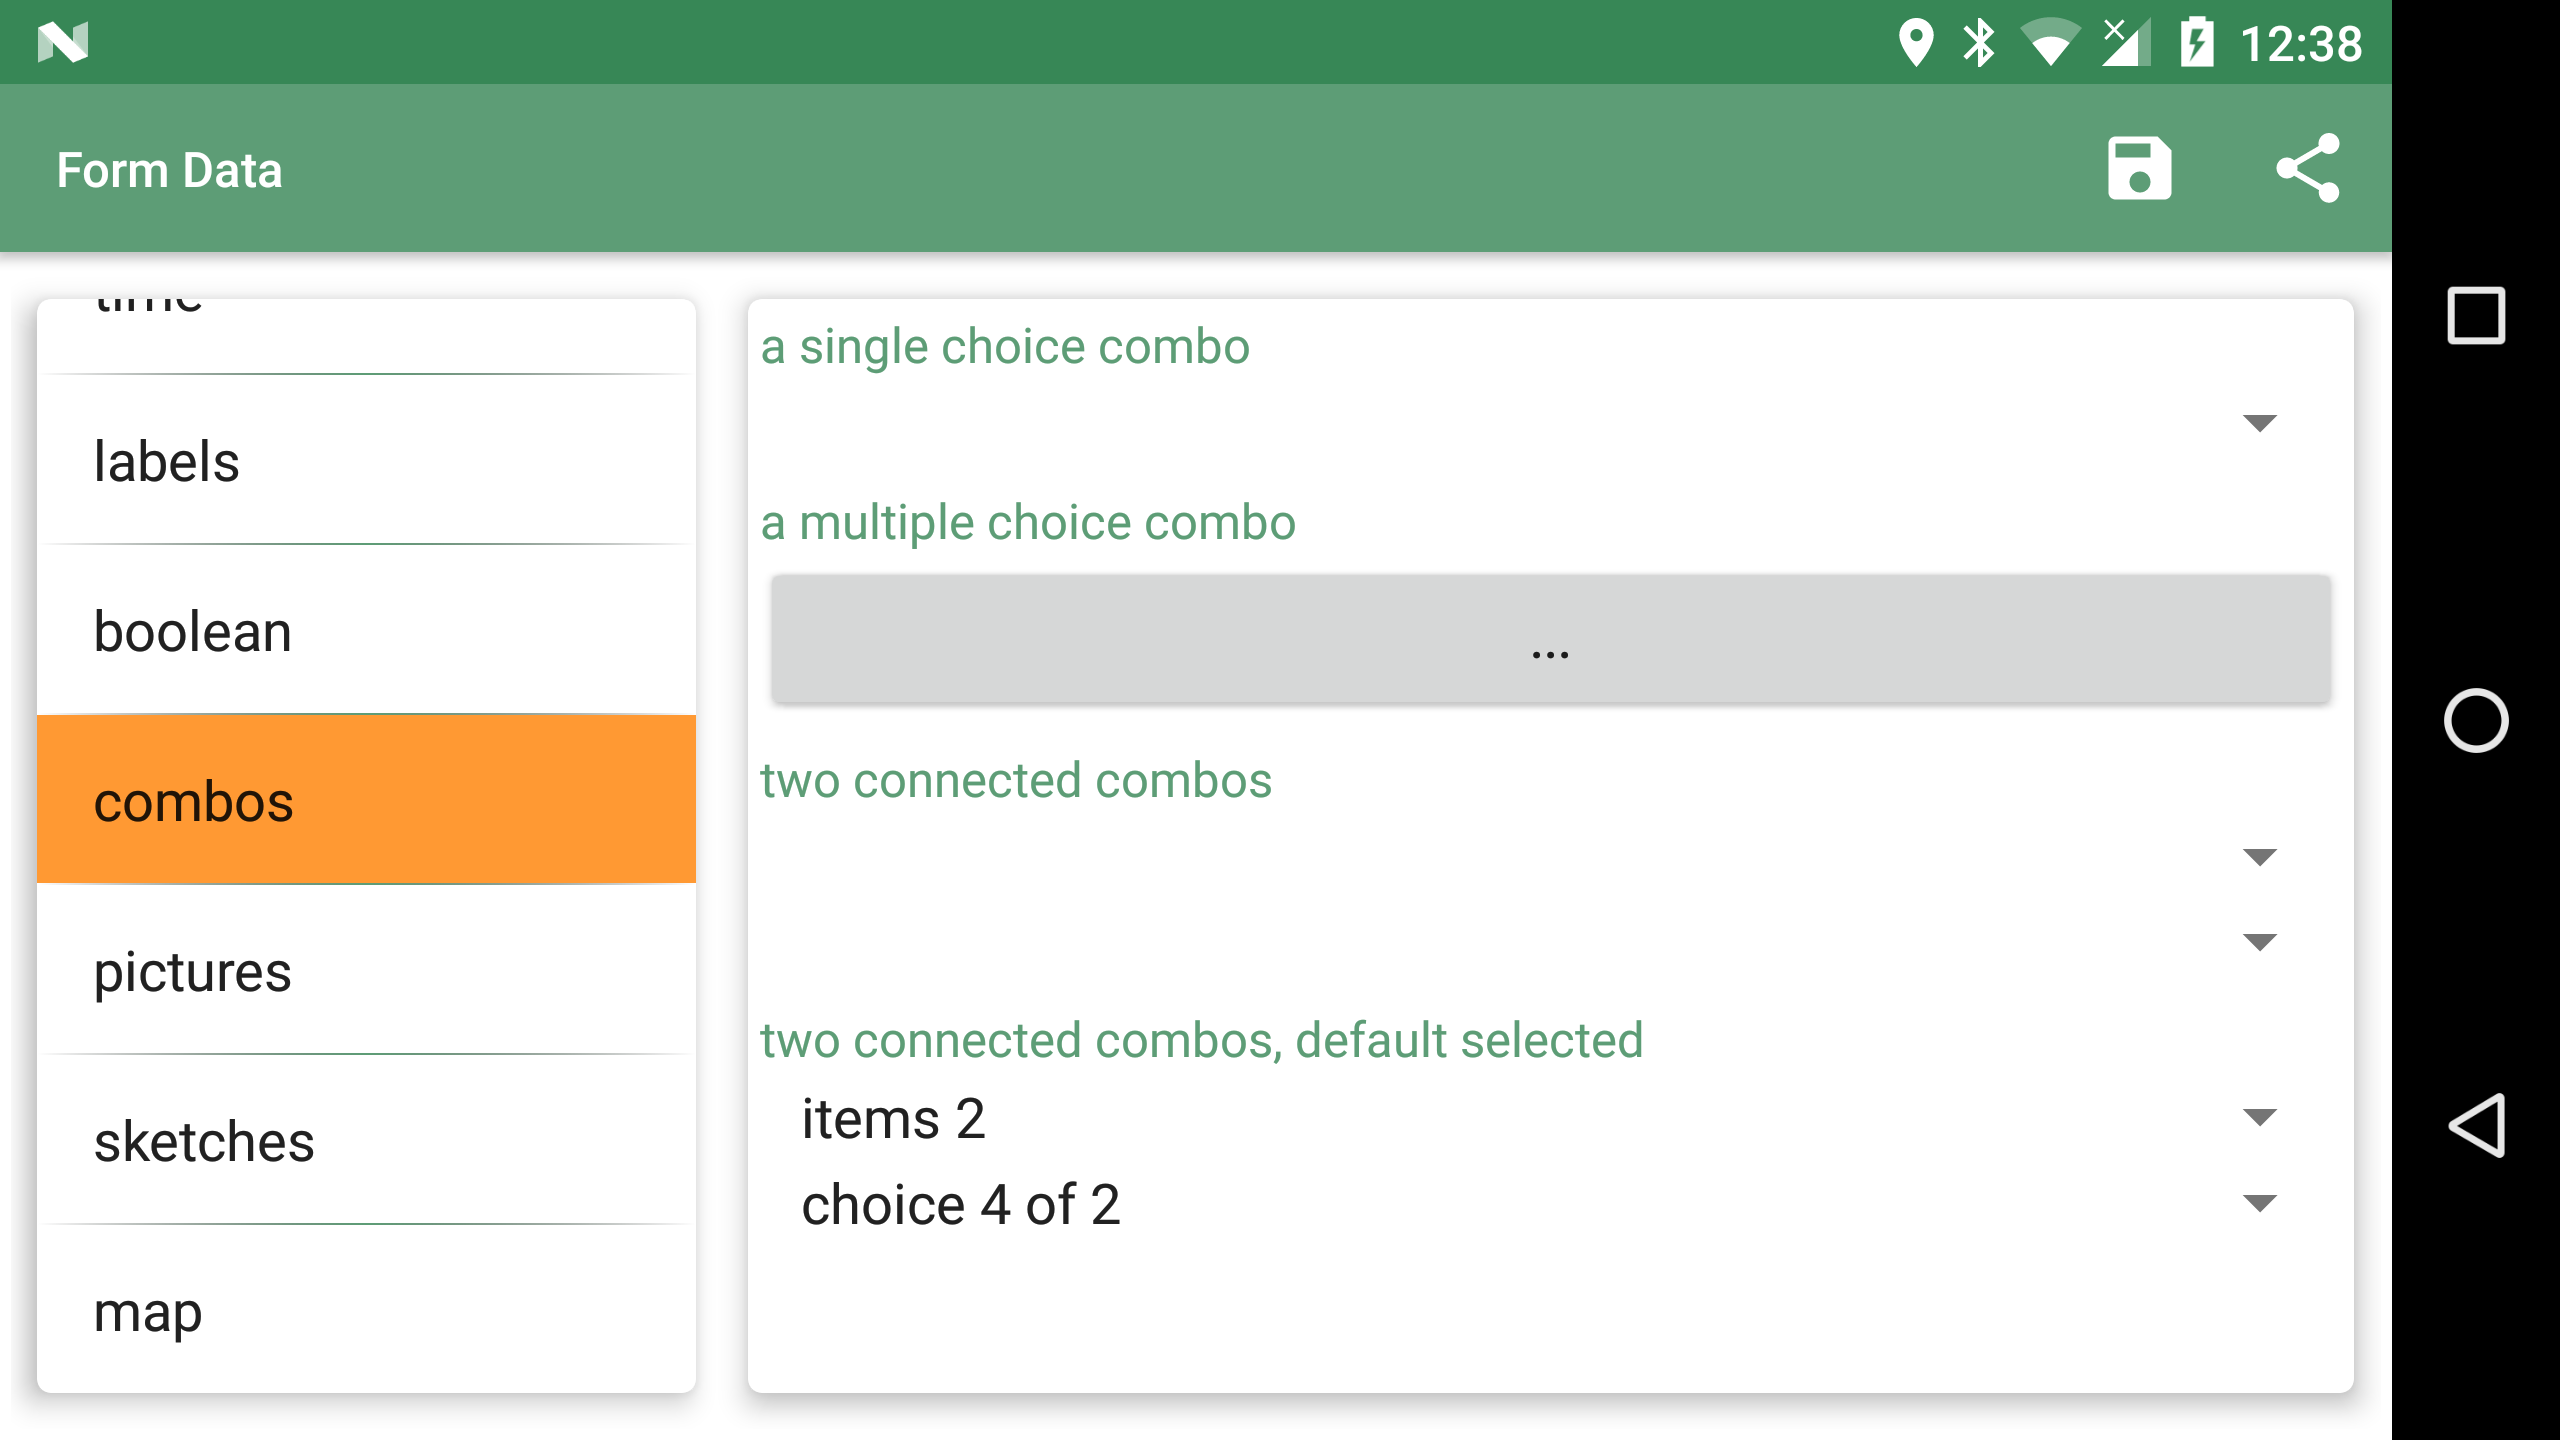
13.1.9. Combos
Combos are useful for having the user select from a fixed set of preset values. There are different types of combos: * stringcombo - select a single value * multistringcombo - select one or more values
"formname": "combos",
"formitems": [
    {
        "key": "a single choice combo",
        "values": {
            "items": [
                {"item": ""},
                {"item": "choice 1"},
                {"item": "choice 2"},
                {"item": "choice 3"},
                {"item": "choice 4"},
                {"item": "choice 5"}
            ]
        },
        "value": "",
        "type": "stringcombo"
    },{
        "key": "a multiple choice combo",
        "values": {
            "items": [
                {"item": ""},
                {"item": "choice 1"},
                {"item": "choice 2"},
                {"item": "choice 3"},
                {"item": "choice 4"},
                {"item": "choice 5"}
            ]
        },
        "value": "",
        "type": "multistringcombo"
    },{
        "key": "two connected combos",
        "values": {
            "items 1": [
                {"item": ""},
                {"item": "choice 1 of 1"},
                {"item": "choice 2 of 1"},
                {"item": "choice 3 of 1"},
                {"item": "choice 4 of 1"},
                {"item": "choice 5 of 1"}
            ],
            "items 2": [
                {"item": ""},
                {"item": "choice 1 of 2"},
                {"item": "choice 2 of 2"},
                {"item": "choice 3 of 2"},
                {"item": "choice 4 of 2"},
                {"item": "choice 5 of 2"}
            ]
        },
        "value": "",
        "type": "connectedstringcombo"
    },{
        "key": "two connected combos, default selected",
        "values": {
            "items 1": [
                {"item": ""},
                {"item": "choice 1 of 1"},
                {"item": "choice 2 of 1"},
                {"item": "choice 3 of 1"},
                {"item": "choice 4 of 1"},
                {"item": "choice 5 of 1"}
            ],
            "items 2": [
                {"item": ""},
                {"item": "choice 1 of 2"},
                {"item": "choice 2 of 2"},
                {"item": "choice 3 of 2"},
                {"item": "choice 4 of 2"},
                {"item": "choice 5 of 2"}
            ]
        },
        "value": "items 2#choice 4 of 2",
        "type": "connectedstringcombo"
    }
]
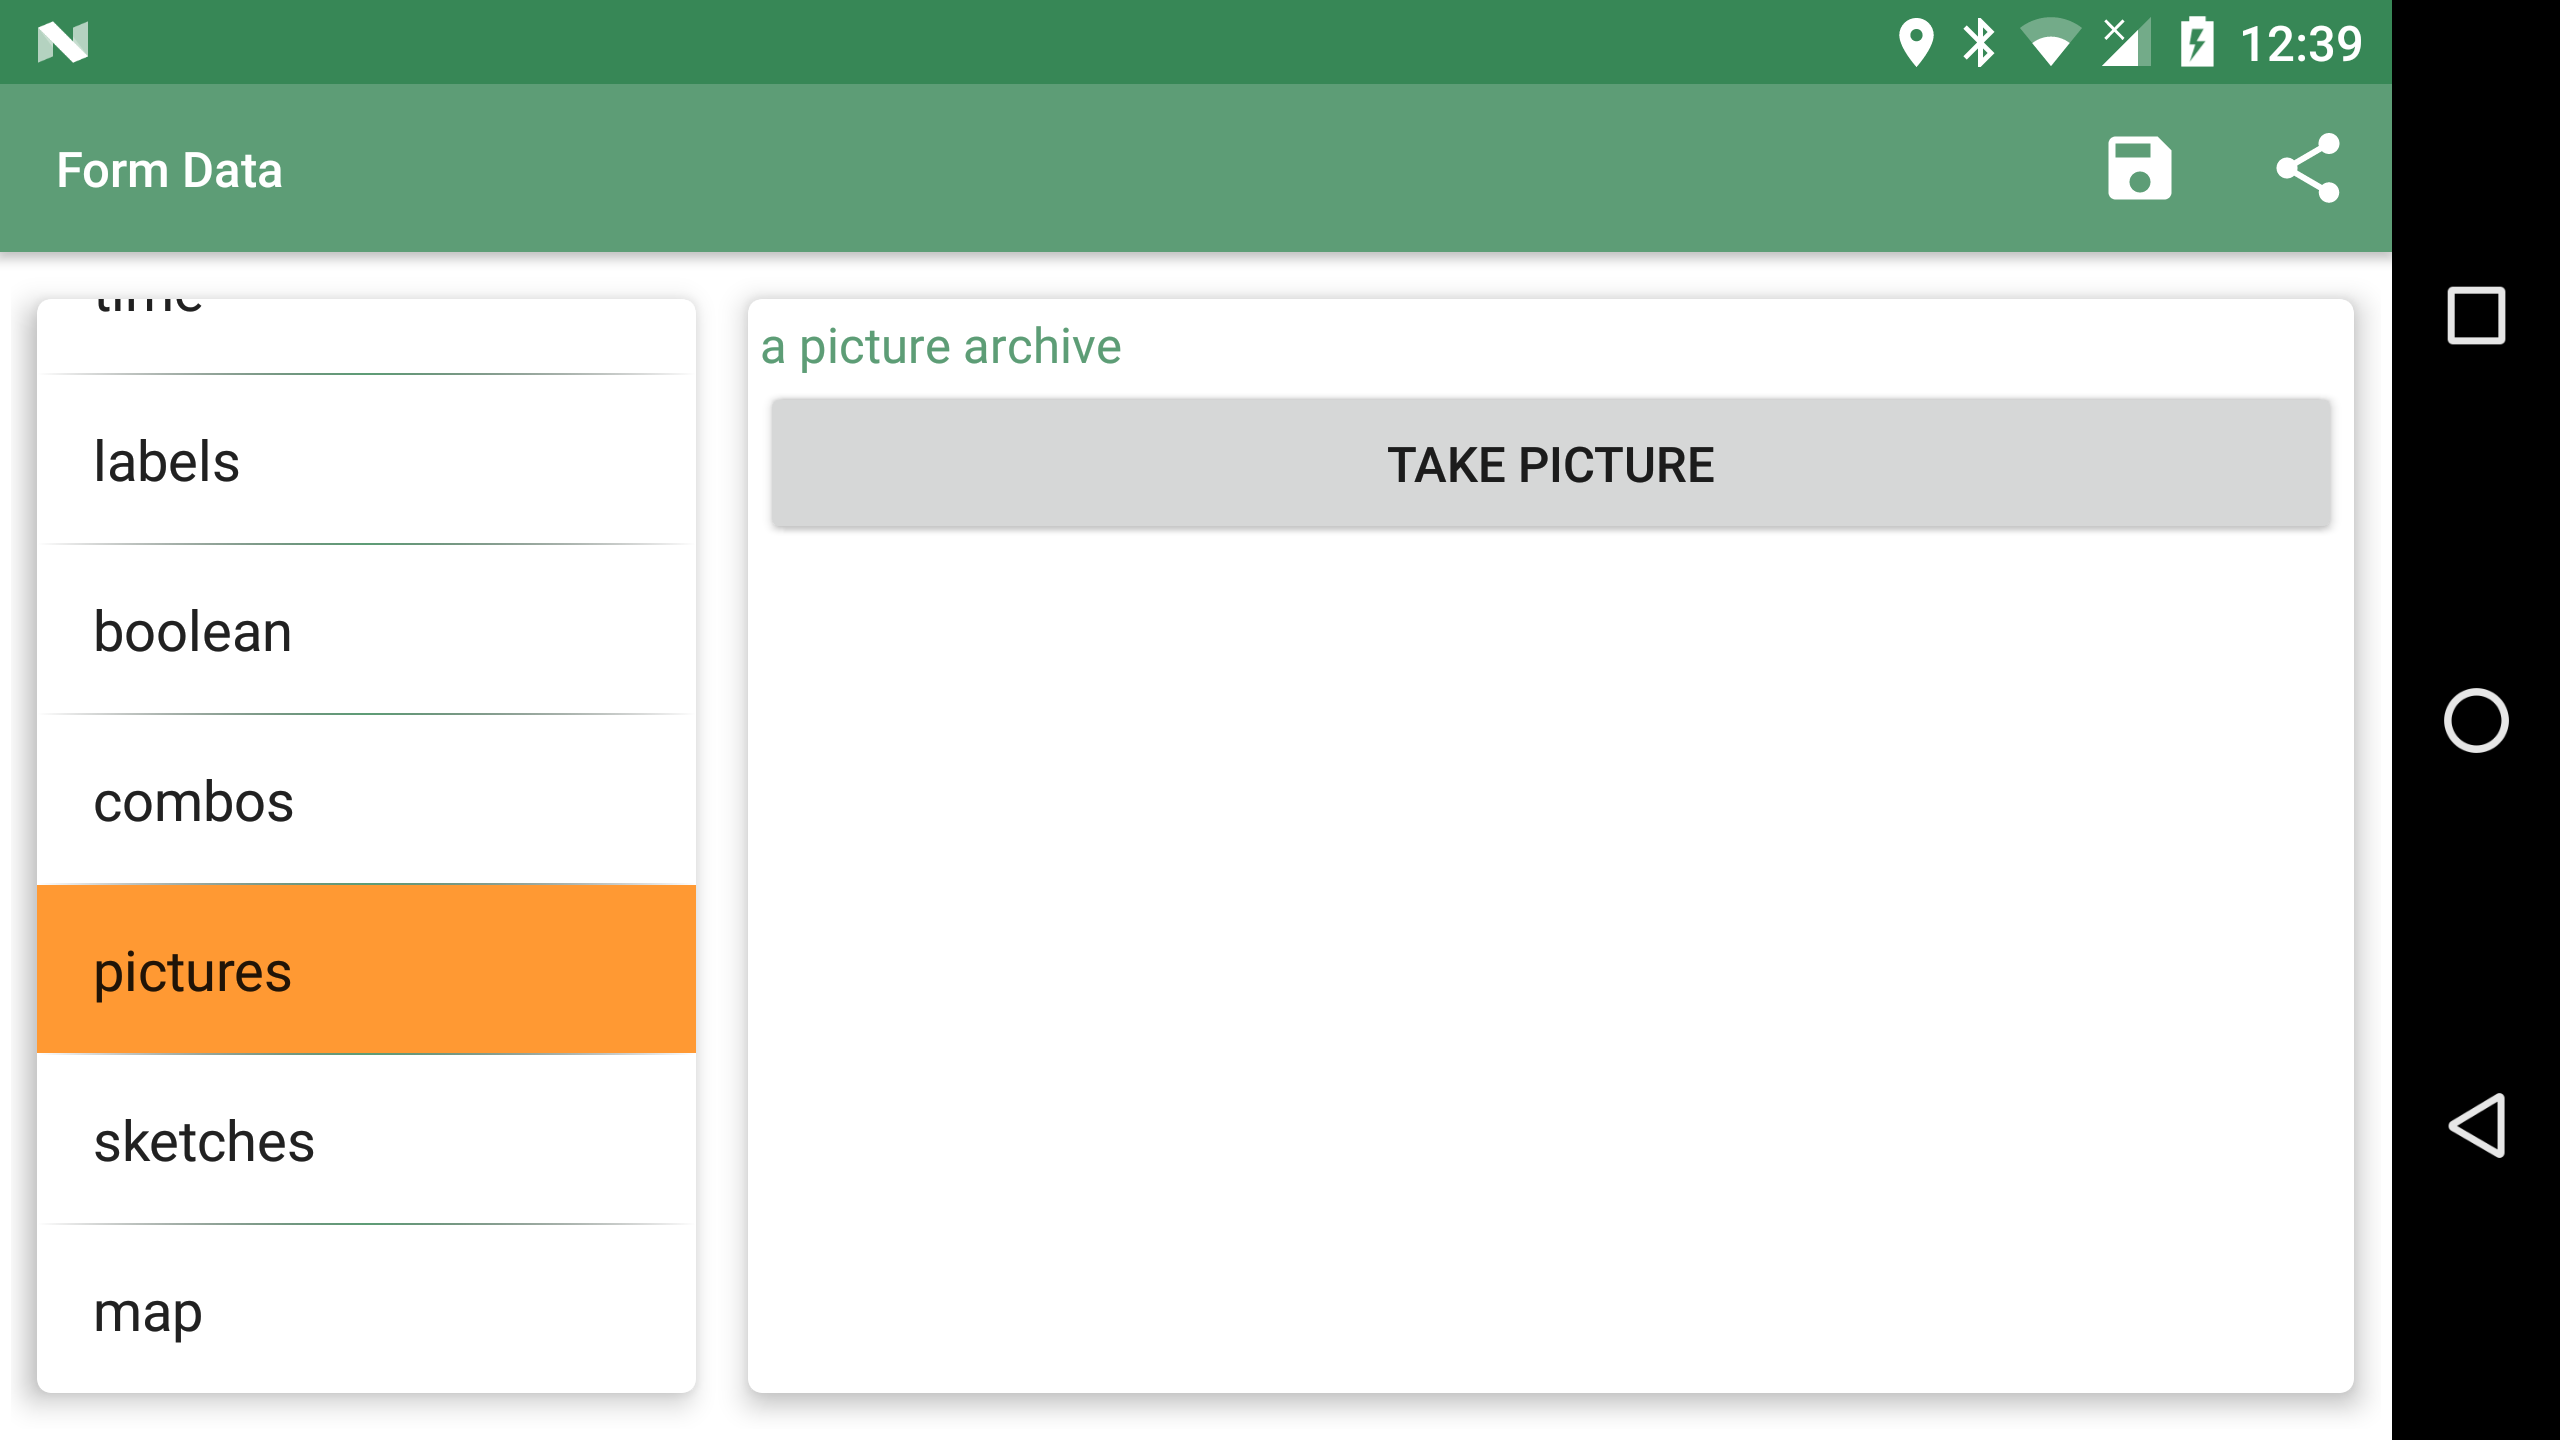
13.1.10. Pictures
"formname": "pictures",
"formitems": [
    {
        "key": "a picture archive",
        "value": "",
        "type": "pictures"
    }
]
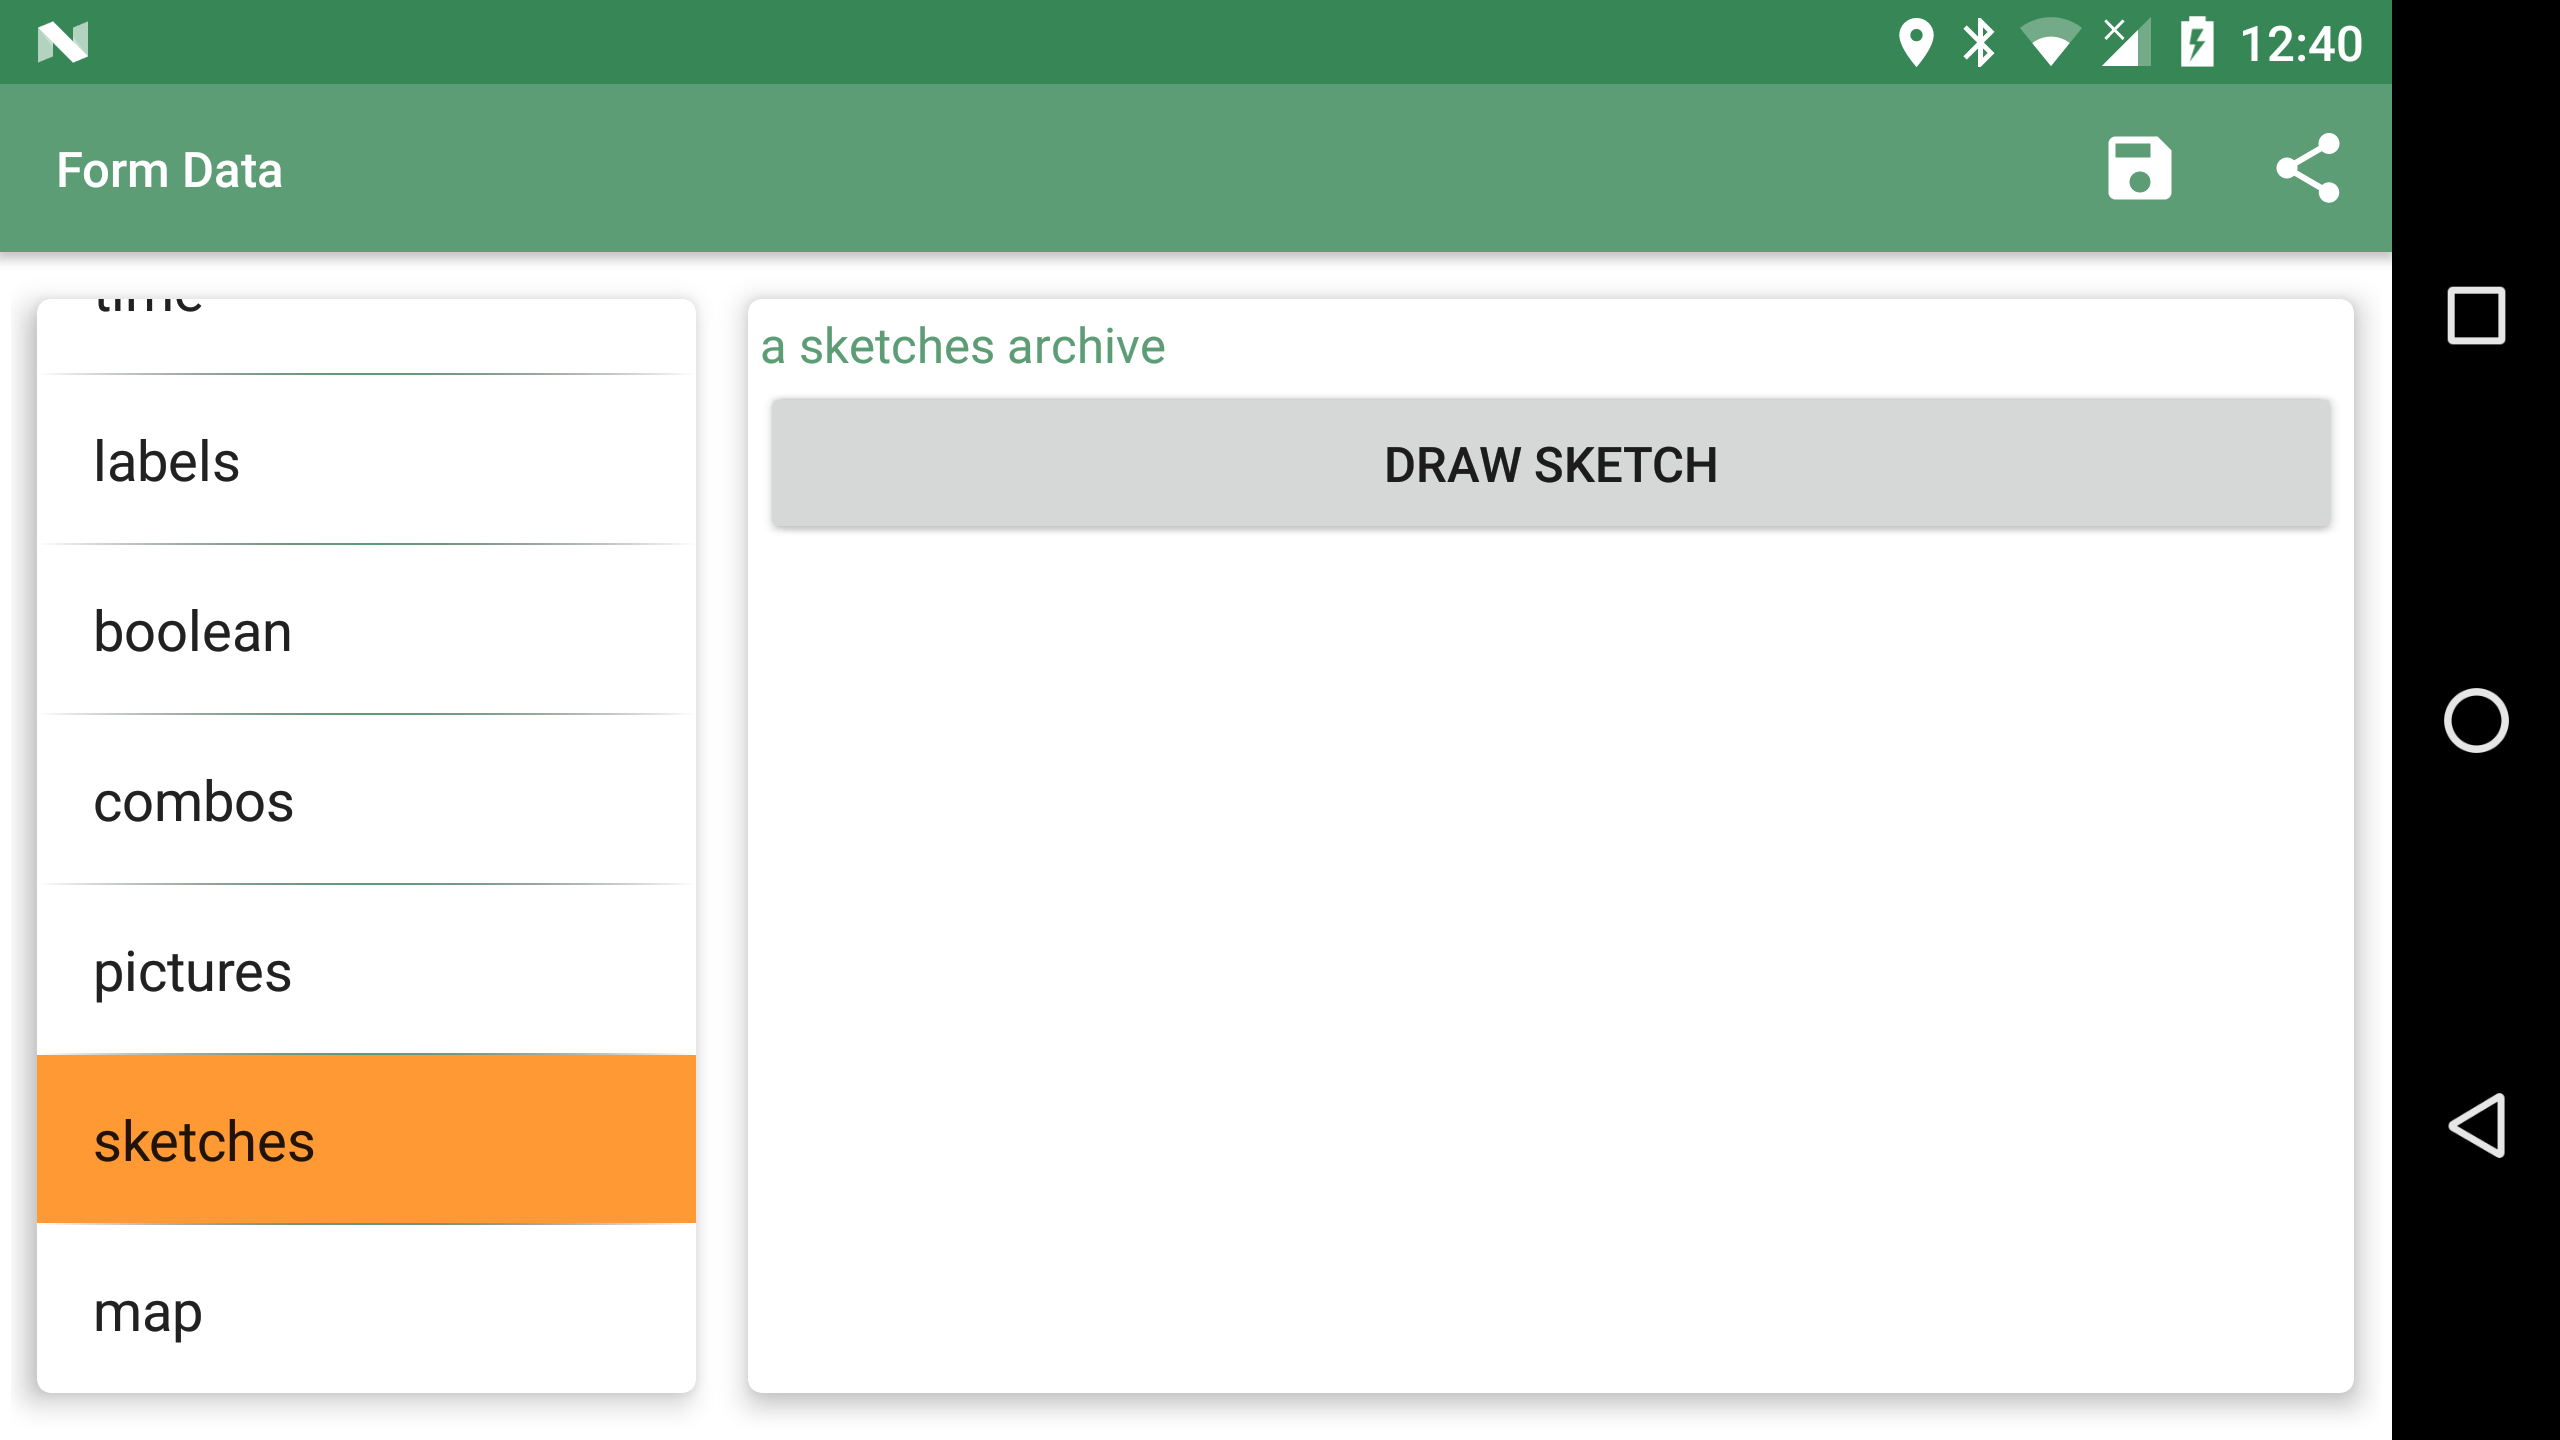
13.1.11. Sketches
"formname": "sketches",
"formitems": [
    {
        "key": "a sketches archive",
        "value": "",
        "type": "sketch"
    }
]
13.1.12. Map screenshot
"formname": "map",
"formitems": [
    {
        "key": "an image of the last seen map",
        "value": "",
        "type": "map"
    }
]
13.2. Other supported tags
13.2.1. hidden
Not shown in the gui, but useful for the application to fill in info like the GPS position:
{"key":"LONGITUDE", "value":"", "type":"hidden"}13.2.2. primary_key
An item of particular importance, can be used by the application to link to particular info:
{"key":"tourism", "value":"", "type":"primary_key"}13.2.3. Constraints
Constraints are conditions that are checked when the OK button of the form is pushed.
mandatory
To make an item mandatory, just add:
"mandatory": "yes"range
To peform a range check on a numeric field you can add something like:
"range":"[0,10)"which would check that the inserted number is between 0 (inclusive) and 10 (exclusive).
13.3. Create a simple form to map fountains
As an exercise we will now create a simple form to map fountains.
13.3.1. Sections
Every form is composed of sections, each of which create a button in the add notes view. We want to create a form for a fountain, so one section is enough. The blueprint for such a form, i.e. the empty button shell starts with:
[
    {
        "sectionname": "fountain",
        "sectiondescription": "fountain",
        "forms": [
and ends with:
        ]
    }
]
13.3.2. Form subsections
Each section can contain several sub-forms, that will create a tab each.
A sub-form starts with:
            {
                "formname": "General data",
                "formitems": [
and ends with:
                ]
            },
Note that the comma at the end is only needed if more than one sub-form is added.
13.3.3. Form elements
To add content to the sub-forms, any of the tags described in the supported tags section can be used.
For example lets add two text fields to prompt the user for a name and street. Also the name should then be the label rendered in the map view.
                    {
                        "key": "name",
                        "value": "",
                        "islabel": "true",
                        "type": "string",
                        "mandatory": "yes"
                    },
                    {
                        "key": "street",
                        "value": "",
                        "type": "string",
                        "mandatory": "no"
                    }
13.3.4. Finalize the form
This is everything that needs to be done. Let’s also add some technical data in a dedicated tab and also a tab for media, inside which it is possible to take pictures.
We leave the exercise to the reader.
The complete tags.json file can be found in the appendix section.
14. Geopaparazzi Tables
14.1. Geopaparazzi Project Database Tables
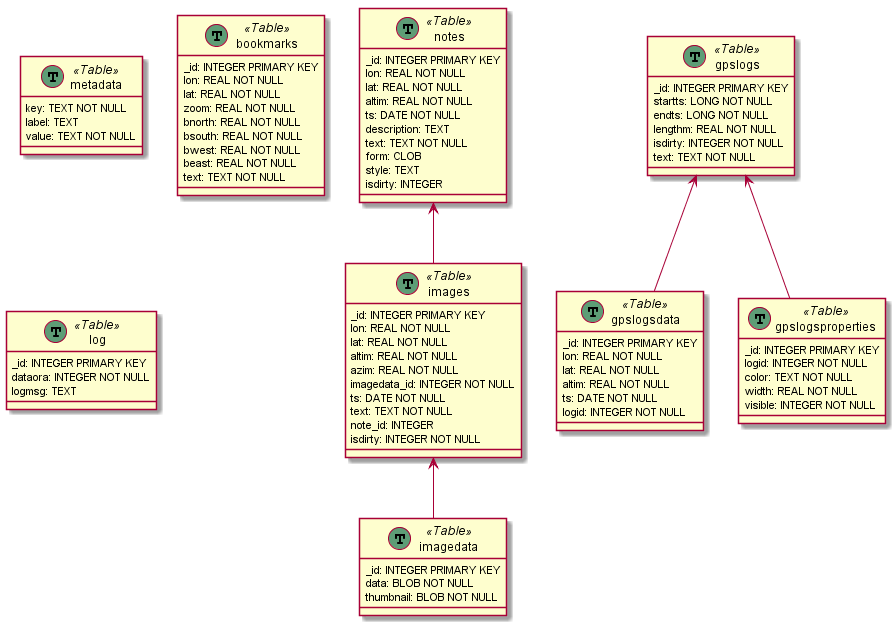
The Geopaparazzi Project Database is a plain SQLite v3 database with the extension .gpap. It contains all the data collected during a Geopaparazzi session, such as GPS logs, notes (including images), and bookmarks.
All coordinate data are saved in WGS84 horizontal spatial reference system. The elevation data saved by Geopaparazzi is as reported by the GPS for the device and is likely the height relative to the WGS84 ellipsoid and not a vertical datum or some other spatially varying surface like Mean Sea Level.
14.1.1. Using Geopaparazzi Timestamps
Geopaparazzi stores timestamps (e.g. columns named "ts" in the tables below) as long integers and represent Unix Epoch, but instead of seconds the value is in milliseconds.
To make the values more readable, they can be decoded in SQLite like so (note the dividing by 1000 to change the milliseconds into seconds):
SELECT _id, ts, datetime("ts"/1000, "unixepoch") timestamp FROM notes;
results in:
_id |
ts |
timestamp |
1 |
1419293026593 |
2014-12-23 00:03:46 |
Typically the values must be decoded into a standard format like ISO 8601 to be used in other applications. The values can be decoded in SQLite like so (note the dividing by 1000 to change the milliseconds into seconds):
SELECT ROWID, ts, strftime( '%Y-%m-%dT%H:%M:%SZ',datetime("ts"/1000, 'unixepoch')) timestamp FROM notes;
results in:
_id |
ts |
timestamp |
1 |
1419293026593 |
2014-12-23T00:03:46Z |
You can also create SQL Views to persist the above query in the database.
CREATE VIEW v_notes AS
  SELECT *, strftime( '%Y-%m-%dT%H:%M:%SZ',datetime("ts"/1000, 'unixepoch')) timestamp FROM notes;

SELECT * FROM v_notes;
14.1.2. Geopaparazzi Table Descriptions
key |
key for the record |
label |
text for dialog label |
value |
value for the record |
This table holds 7 standard rows of the various Project information such as the Project name. You can add your own metadata rows using the Project Info dialog in Geopaparazzi or using SQL.
_id |
unique id |
lon |
longitude of the note, decimal degrees |
lat |
latitude of the note, decimal degrees |
altim |
elevation, meters |
ts |
timestamp, "unixepoch" in milliseconds |
description |
description of the note |
text |
text/type of the note |
form |
the form notes data, JSON |
isdirty |
is dirty field (0 = false, 1 = true) (not used) |
style |
style of the note (not used) |
| Style and isdirty are currently unused. |
_id |
unique id |
lon |
longitude of the image, decimal degrees |
lat |
latitude of the image, decimal degrees |
altim |
elevation, meters |
azim |
azimuth, decimal degrees |
imagedata_id |
foreign key to _id of the imagedata table |
ts |
timestamp, "unixepoch" in milliseconds |
text |
file name of the image |
note_id |
optional foreign key to _id of the notes table |
isdirty |
is dirty field (0 = false, 1 = true) |
_id |
unique id |
data |
the image data as a BLOB containing an JPEG image |
thumbnail |
the image thumbnail data as a BLOB containing an JPEG image |
_id |
unique id |
lon |
longitude of the bookmark, decimal degrees |
lat |
latitude of the bookmark, decimal degrees |
zoom |
the zoom of the bookmark, Tile zoom levels |
north |
the north bound of the bookmark, decimal degrees |
south |
the south bound of the bookmark, decimal degrees |
west |
the west bound of the bookmark, decimal degrees |
east |
the east bound of the bookmark, decimal degrees |
text |
the name of the bookmark |
_id |
unique id |
startts |
log start timestamp, "unixepoch" in milliseconds |
endts |
log end timestamp , "unixepoch" in milliseconds |
lengthm |
the length in meters |
isdirty |
is dirty field (0 = false, 1 = true) |
text |
name of the log |
_id |
unique id |
lon |
longitude of the log point, decimal degrees |
lat |
latitude of the log point, decimal degrees |
altim |
elevation of the log point, meters |
ts |
timestamp of the log point, "unixepoch" in milliseconds |
logid |
foreign key to _id of the gpslogs table |
_id |
unique id |
logid |
foreign key to _id of the gpslogs table |
color |
the color to use to draw the log, text like "red", etc |
width |
the width to use to draw the log, in pixels |
visible |
flag that defines if the log is visible at the time given |
_id |
unique id |
dataora |
row timestamp in milliseconds |
logmsg |
log message |
The log table contains rows created by Geopaparazzi as you use its various functions, primarily for troubleshooting any problems. You can view the log table in Geopaparazzi by selecting the menu in the main dashboard view and selecting Advanced, the select "Analyze log". By default it shows the "Error" class messages.
14.2. Additional Geopaparazzi tables in Spatialite Databases
If these tables are present in a Spatialite database used as a map overlay, they can supply additional properties to the Spatialite data.
_id |
unique id |
name |
source of the geometry, format: |
size |
|
fillcolor |
fill color in HTML-friendly form: e.g. red, #FBC02D, etc |
strokecolor |
outline color |
fillalpha |
0.0 to 1.0 value of opacity (0=fully transparent, 1=not transparent) |
strokealpha |
0.0 to 1.0 value of opacity (0=fully transparent, 1=not transparent) |
shape |
allowed values: "square","cross",triangle","circle","star","X" |
width |
width of line |
labelsize |
size of label in scaled pixels |
labelfield |
field in feature table to get label text |
labelvisible |
is the label shown? 0=no, 1=yes |
enabled |
|
layerorder |
|
dashpattern |
dashWidth, dashGap, dashWidth2, dashGap2, … in scaled pixels, e.g. |
minzoom |
don’t show if current zoom level is less than this (see Tile zoom levels for values) |
maxzoom |
don’t show if current zoom level is greater than this |
decimationfactor |
|
theme |
The dataproperties table is useful for providing persistent styling of features stored in the Spatialite database.
An example of a "name" value in the dataproperties table:
/storage/emulated/0/rigstreet_v1.sqlite#sites_gate#geometry
id |
unique id |
restable |
feature table name containing the feature |
rowidfk |
foreign key value of the row in the feature table |
type |
Geopaparazzi data type of resource (e.g. BLOB_IMAGE, EXTERNAL_IMAGE, BLOB_PDF, EXTERNAL_PDF) |
resname |
file name of resource. For labeling if resource is "BLOB_*" |
respath |
path of resource file |
resblob |
if resource is "BLOB_*", contains the resource data as binary |
resthumb |
contains a BLOB of a thumbnail of the resource to use as an icon |
The geopap_resource table is used to relate resources like images, PDFs, etc to records in the Spatialite tables. See Viewing Feature Attributes
15. The Hortonmachine
The Hortonmachine is:
-
an Open Source geospatial library focused on hydro-geomorphological analysis and environmental modeling
-
development started in 2002 at the University of Trento, Department of Civil and Environmental Engineering
-
completely maintained by HydroloGIS
-
from 2015 integrated as Spatial Toolbox in gvSIG
-
from 2018 available as a set of stand alone modules
15.1. HM modules useful to Geopaparazzi
The used modules and a small description:
hortonmachine
|-- dbviewer.exe               -> spatialite viewer
|-- geopaparazzi_viewer.exe    -> project viewer
|-- gforms.exe                 -> form builder
|-- jre/
|-- libs/
|-- natives/
|-- quiet-logging.properties
|-- sld.exe                    -> style generator
|-- spatialtoolbox.exe         -> data preparation
`-- OTHER FILES
15.2. HM installation
You can download the latest Hortonmachine standalone version from the releases site.
To install just:
-
unzip the hortonmachine.zip archive
-
launch the executables of the module of choice
| Depending on the PC’s power, the application can take a little moment to startup. If it doesn’t, for windows OS, run the hm-MODULENAME.bat. It will give information about the problems occurring helping to solve them. One common issue might for example be that the RAM memory given to the module is larger than the one available on the pc. |
15.3. The data used
The data used in the following chapters can be found here.
You should find in there:
-
roi.shp: to define the region of interest
-
buildings_roi.shp: polygons of buildings
-
roads_roi.shp: lines of the road network
-
pois_roi.shp: points of interest
-
ortophoto_bucharest_georef.tif: aerial image of the region
15.4. Create an MBTiles database
We wan to create an MBTile database with multiple styled layere:
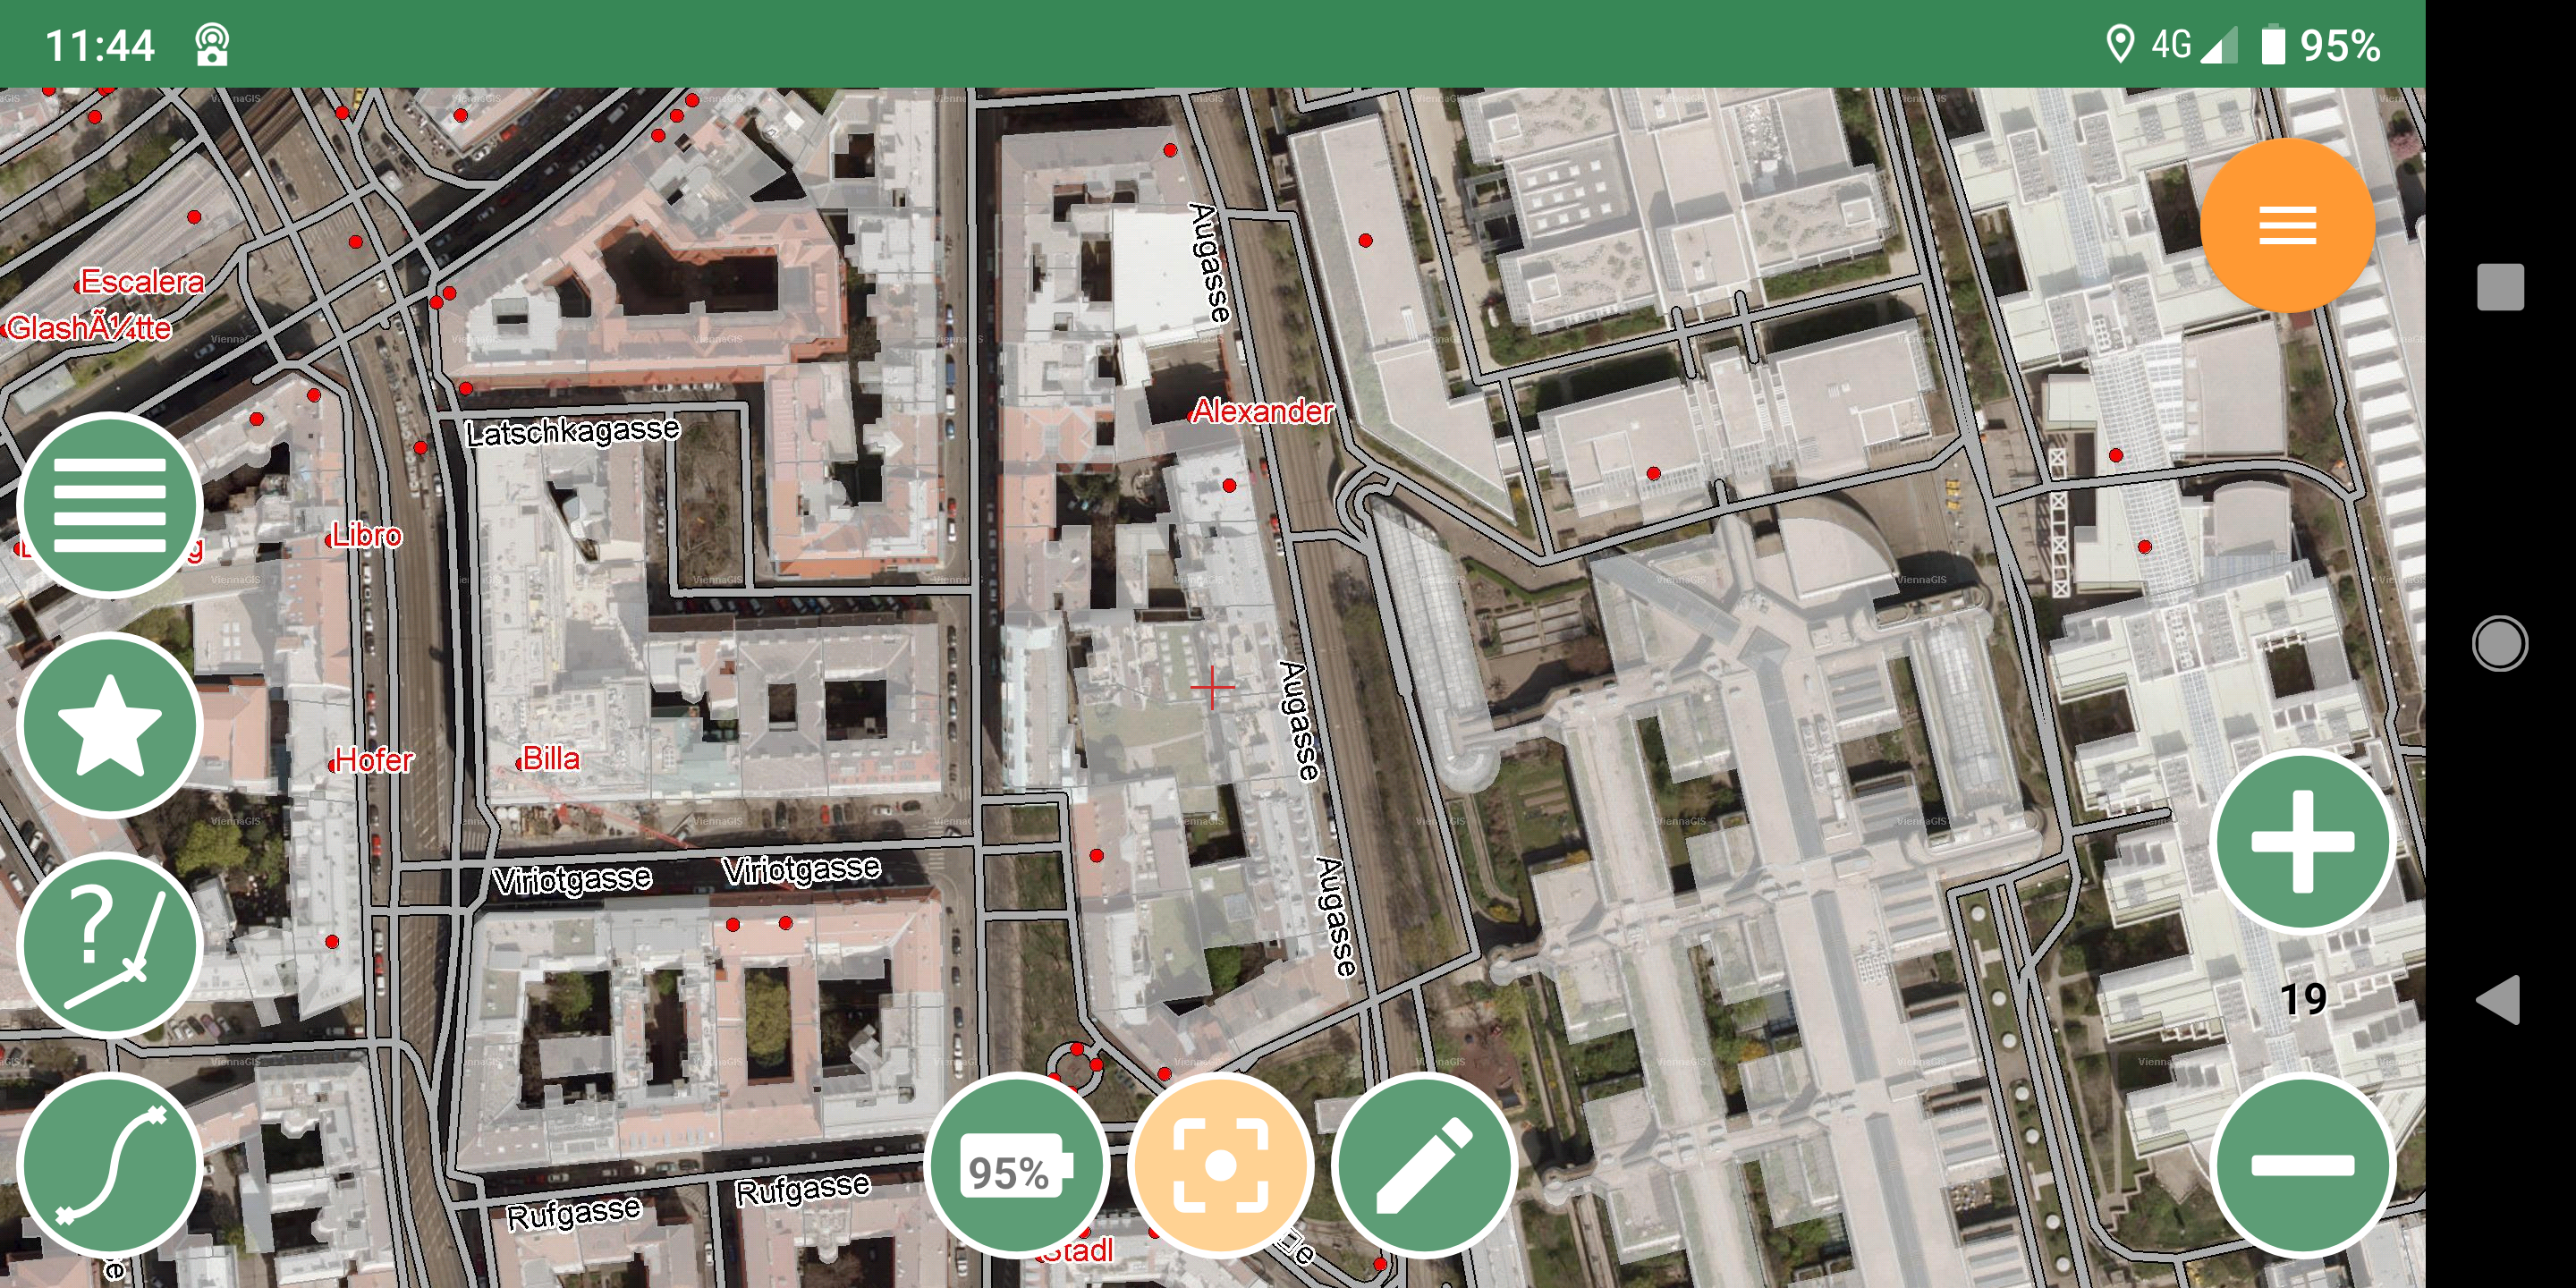
15.4.1. Styling
An MBTiles database can be created with various applications (gdal, QGis, Tilemill…). In the Hortonmachine we have a dedicated module that generates mbtiles datasets from layers of raster and vector data.
To prepare the mbtiles dataset it is first necessary to style the shapefiles in order to get the right colors and labelings. Styling can be done following the OGC SLD 1.0 specification. It is an open standard for styling data, so any compatible tool can be used.
In the Hortonmachine we havethe following module to style data: sld.exe (hm-sld.sh for unix based systems).
Once launched, the following appears:
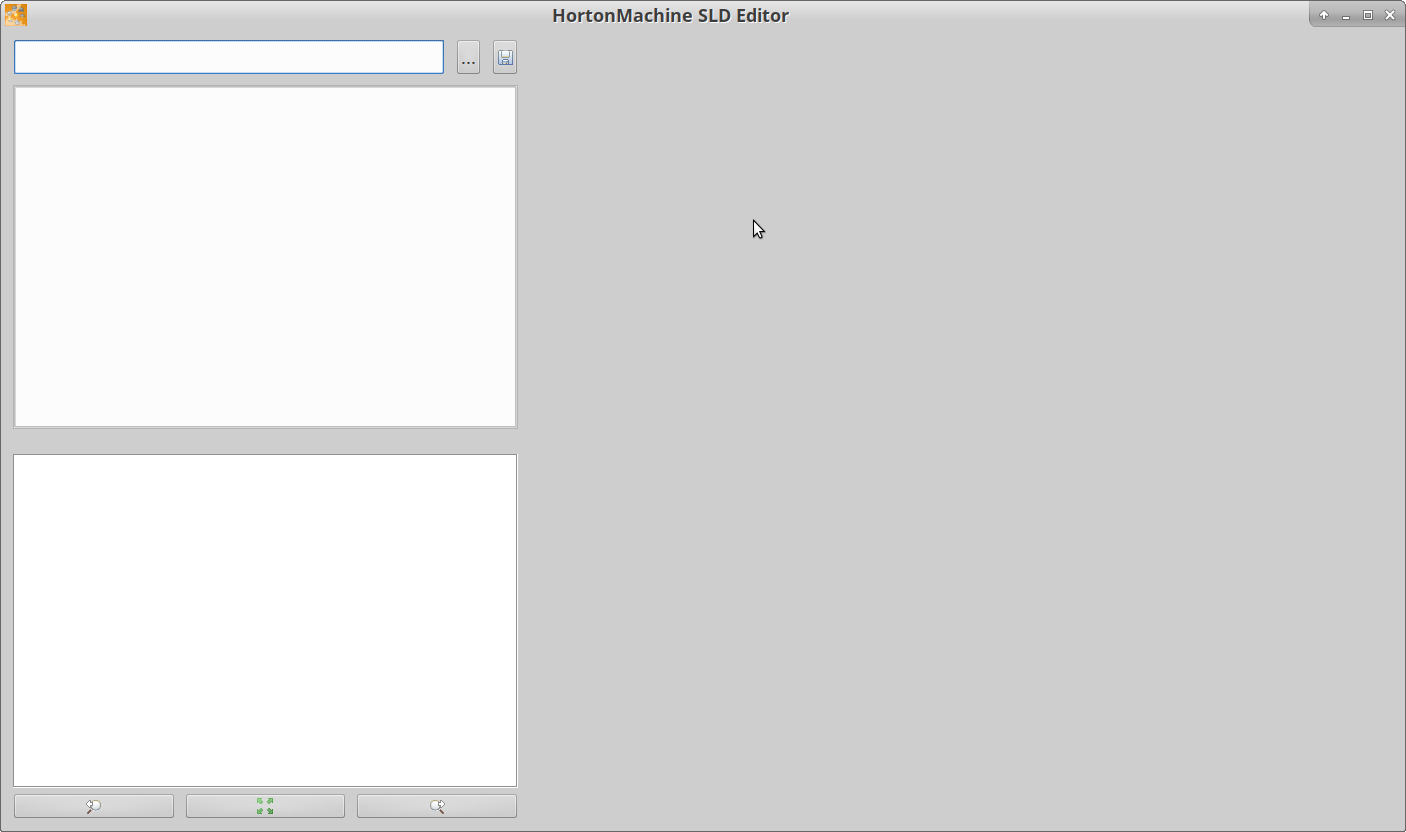
Styling the buildings
Pushing the button with the 3 dots allows to select the shapefile that we want to style. Once loaded it will show the default style (or load it from an *.sld file, if available):
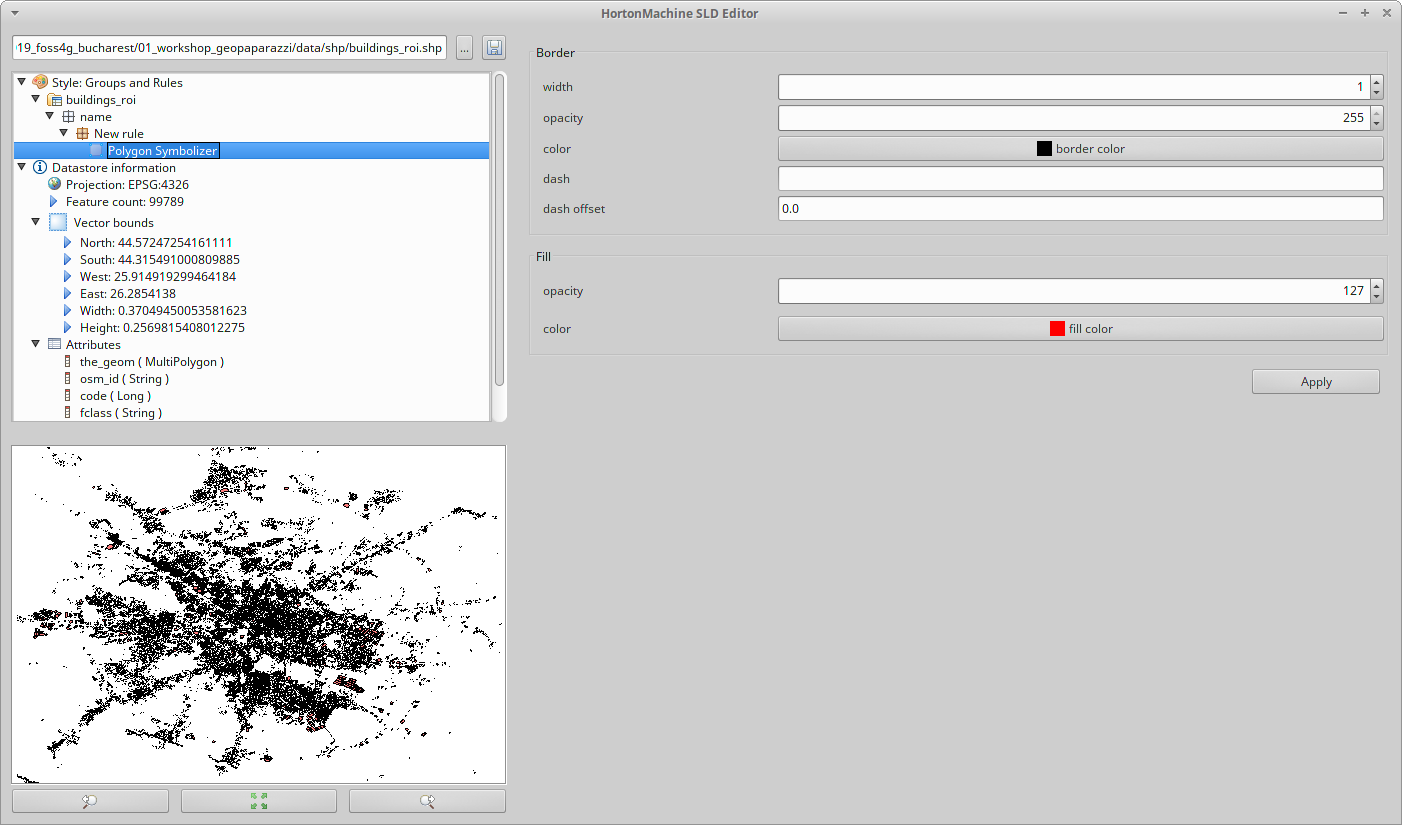
Play with the colors to get a white transparent background and a gray border.
Remeber to push Apply to view the changes.
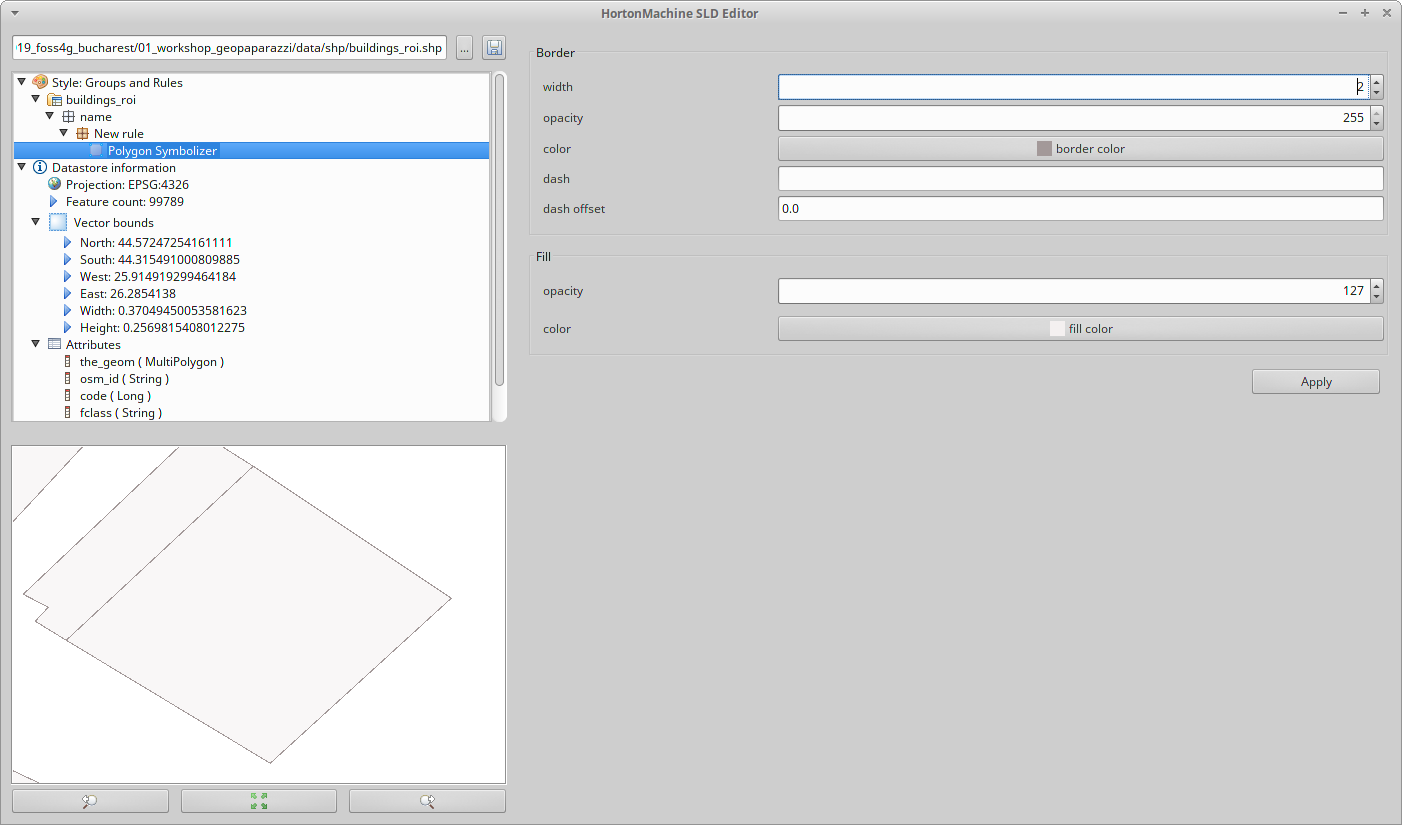
Once the preview looks as desired, push the save button to write the style to the sld file near the shapefile.
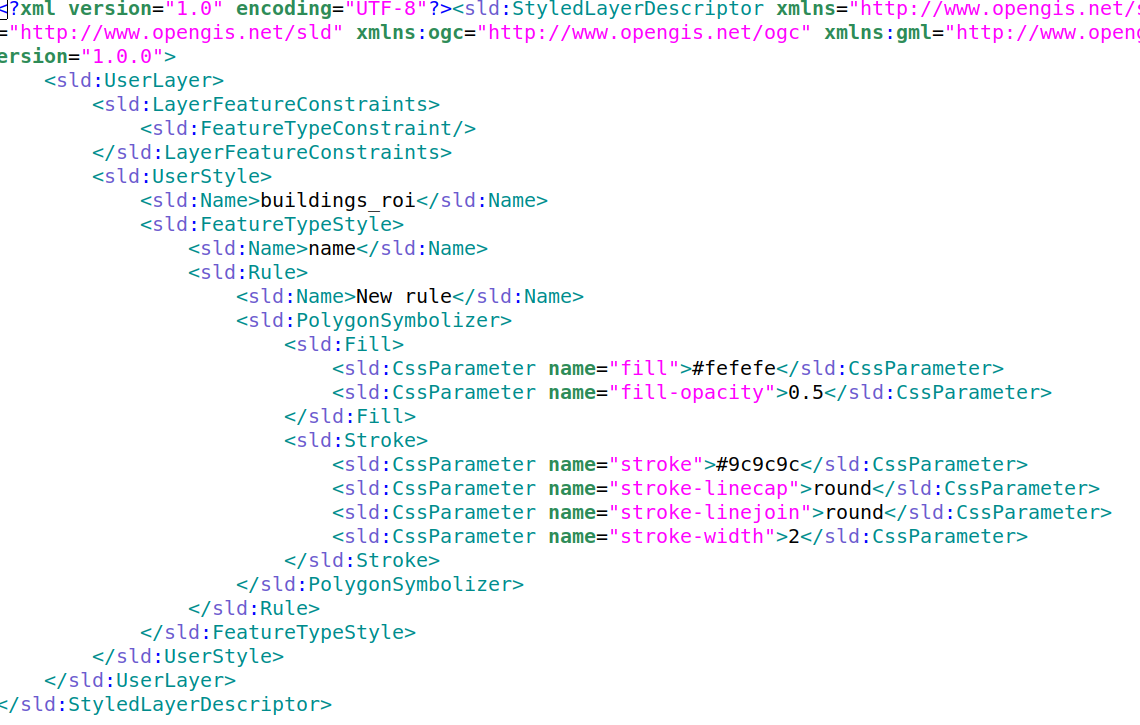
Styling the roads
Styling roads is not much different from styling polygons. But in this case we also want a label applied to the road to see the name. To do so add a textsymbolizer by right clicking on the rule:
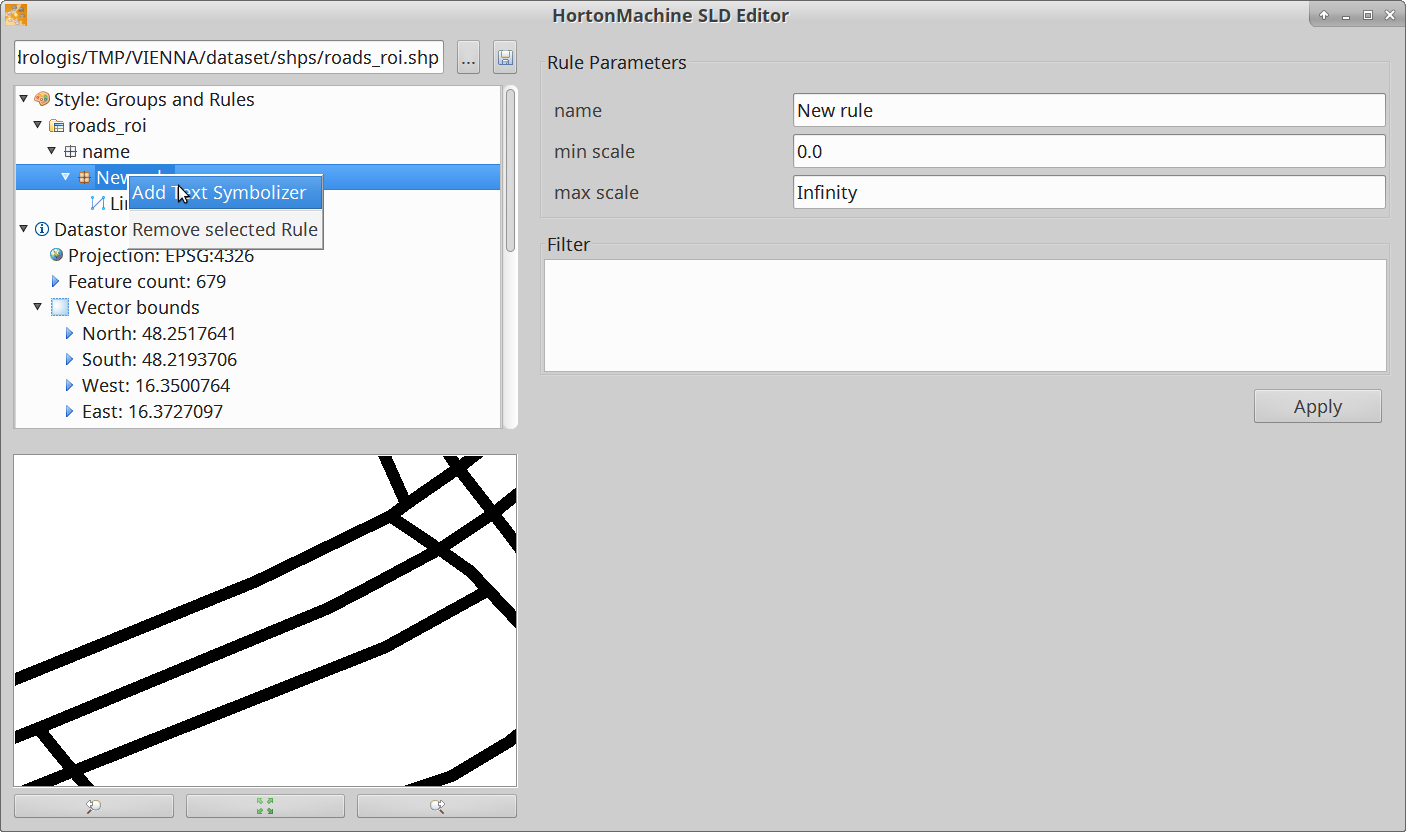
Then, to begin, choose:
-
the shapefile field to use for the label (name)
-
a font (size more or less 36)
-
a white halo (size 2)
Apply and see if you like it.
Most probably you also want the labels to follow the line (set to true) and give a bit of perpendicular offset so that the label is not on the road.
The result might look like:
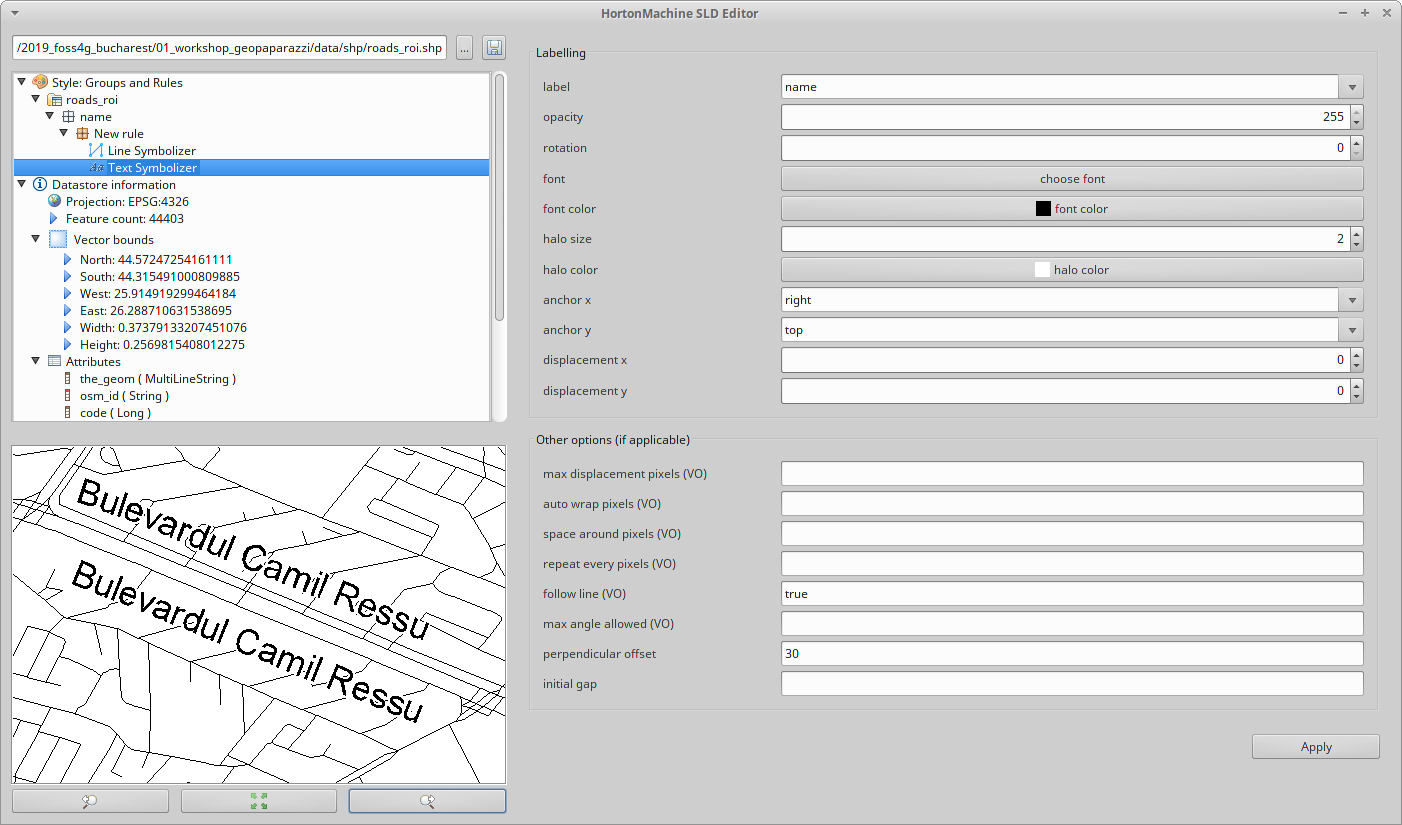
Again push the save button to persist the style.
Styling the pois
Points can be styled the same way as the polygons and lines. The only difference is in the possibility to select a mark to represent the points:
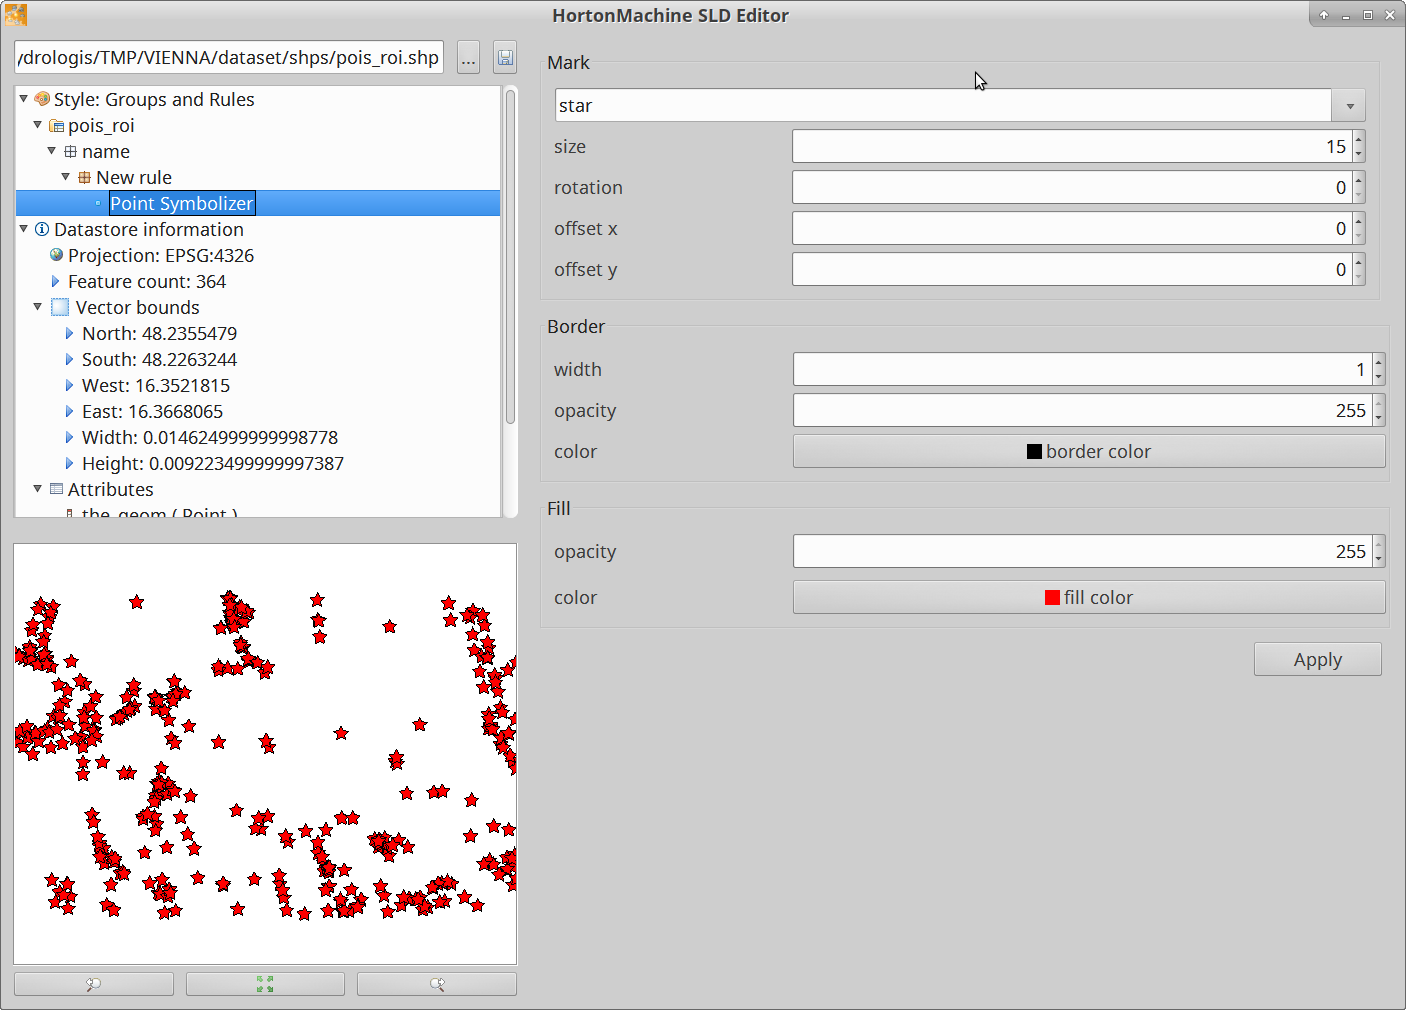
15.4.2. A quick note on filters
We can slightly change the style of the buildings shapefile in order to better see the university buildings. To do so we can right click on any attribute (type seems to be reasonable) and visualise the stats of that field. The result is a table containing all values and their count:
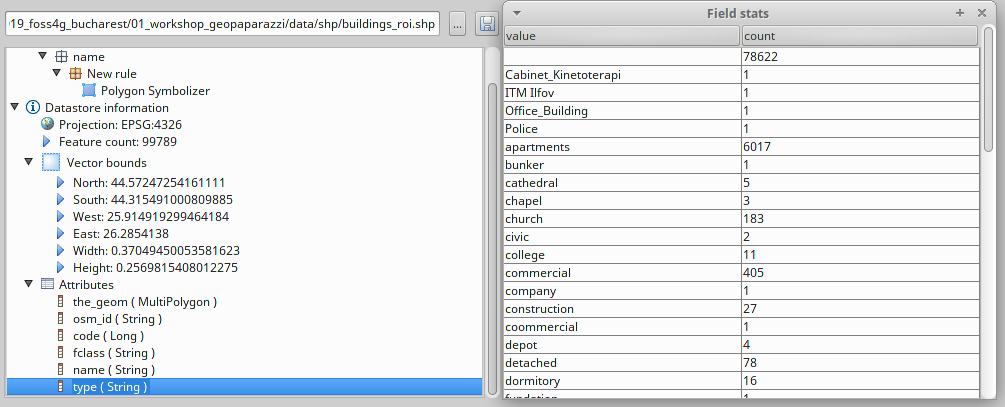
This gives us all the information to set the filter on a second rule that can be added by right clicking on the parent node of the rules (in this case name):
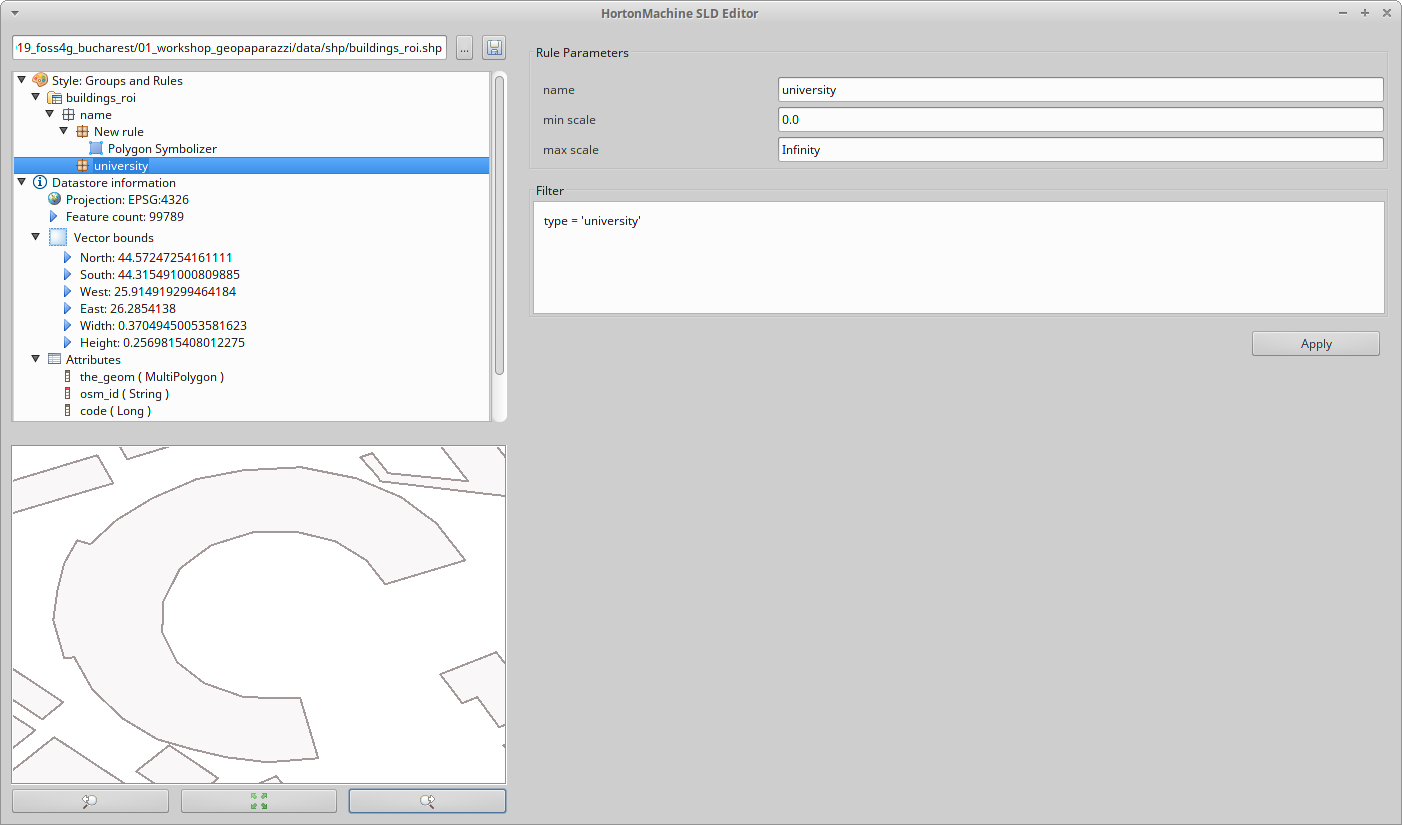
15.4.3. The MBTiles Creator
To create an mbtiles database from a set of data we can use the modules of the spatial toolbox. Launch spatialtoolbox.exe to open it:
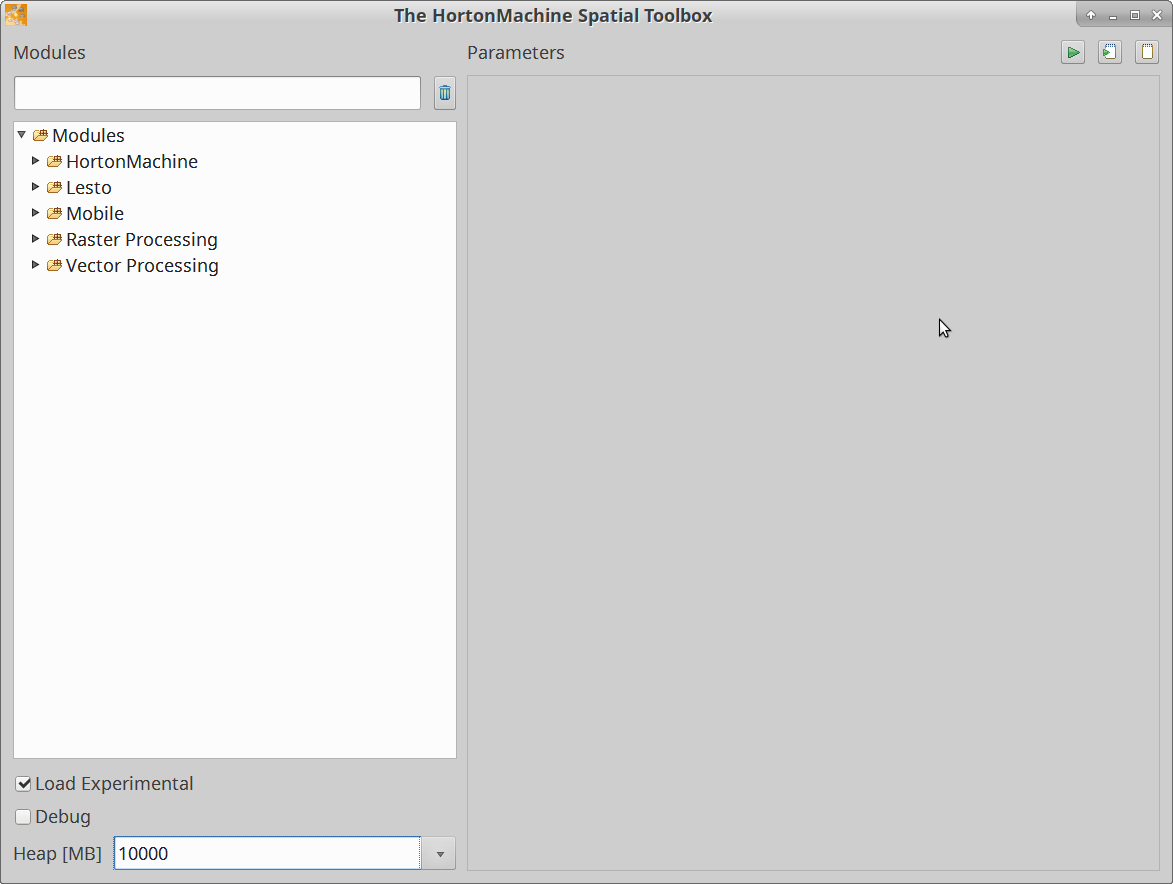
The spatial toolbox contains many modules to do hydro-geomophological analyses, process LiDAR data and work with raster and vector data. In this course we will only use the part related to the Mobile category.
Before we run any module, make sure some settings are properly configured:
-
enable the checkbox that allows loading of experimental modules
-
set the Heap memory properly depending on your PC’s RAM
The GeopaparazziMapsCreator module is the actual module that creates the mbtiles database.
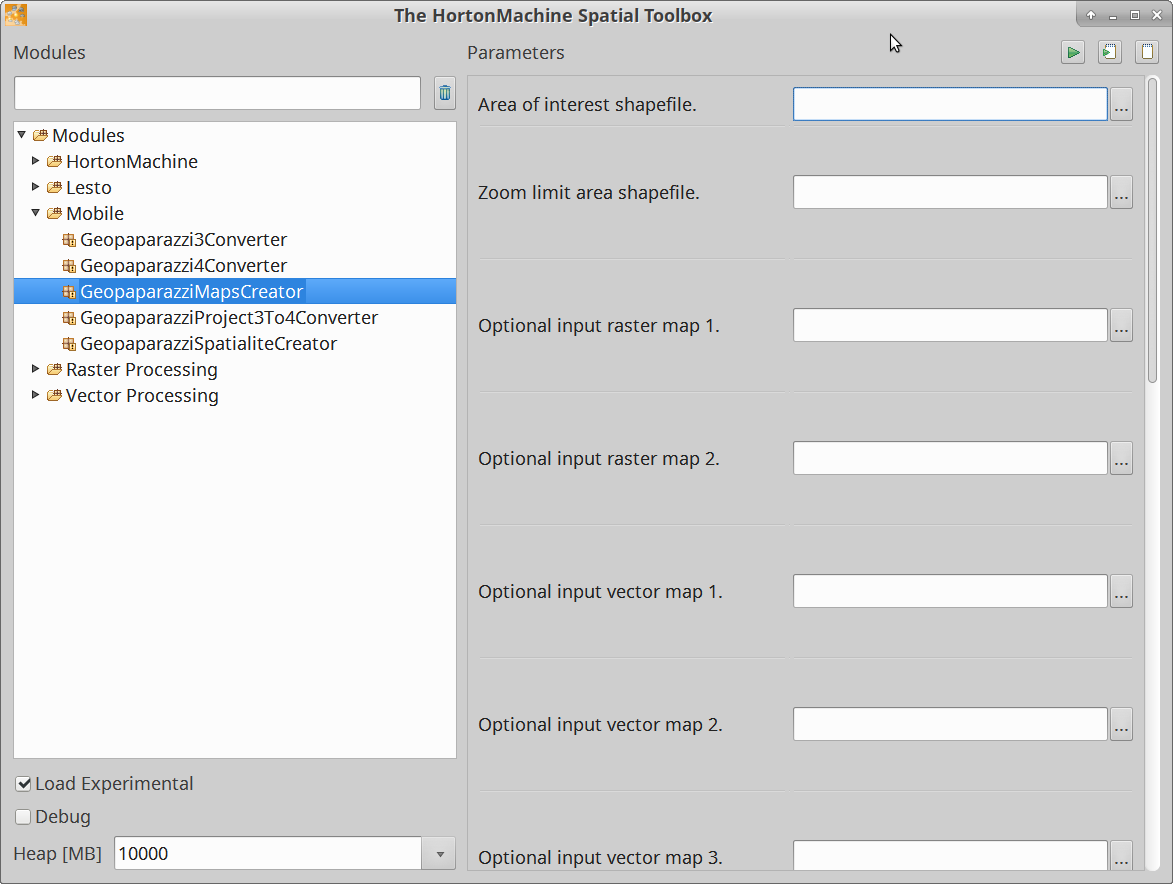
The first set of parameters are:
-
the shapefile of the area of interest we want to cover (roi.shp)
-
the background raster file (aerial image tiff)
-
the overlay shapefiles (buildings, roads, pois)
Once inserted, it should look like:
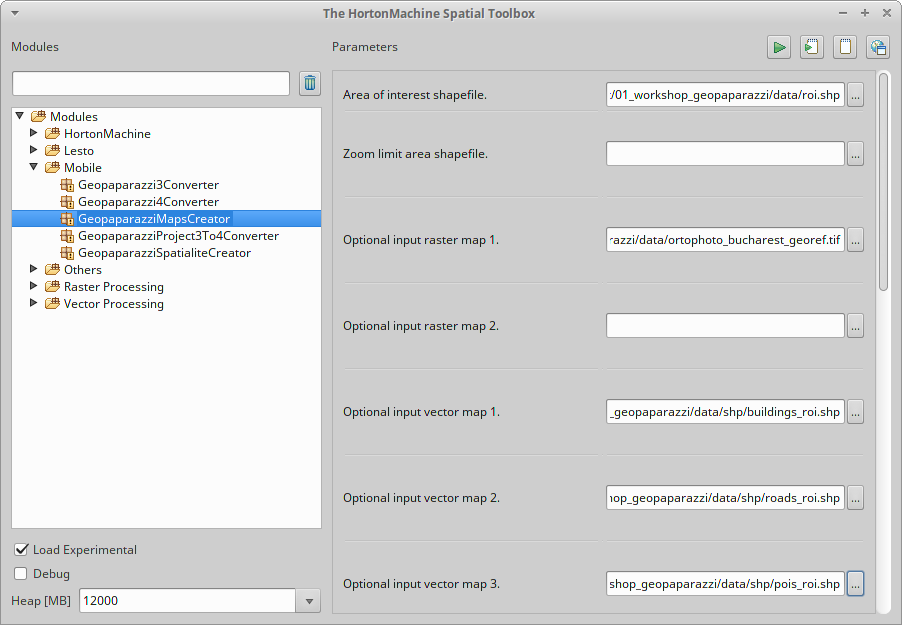
The second set of parameters are:
-
a name for the dataset (the db will be named like that also)
-
the min and max zoomlevel. The max zoomlevel is important, since it defines how large the dataset will get. On the given area a max zoomlevel of 19 is a good compromise. The zoomlevel is the one seen in geopaparazzi.
-
the used image format. In case of aerial imagery, jpg is preferred.
-
the output folder
Once inserted, it should look like:
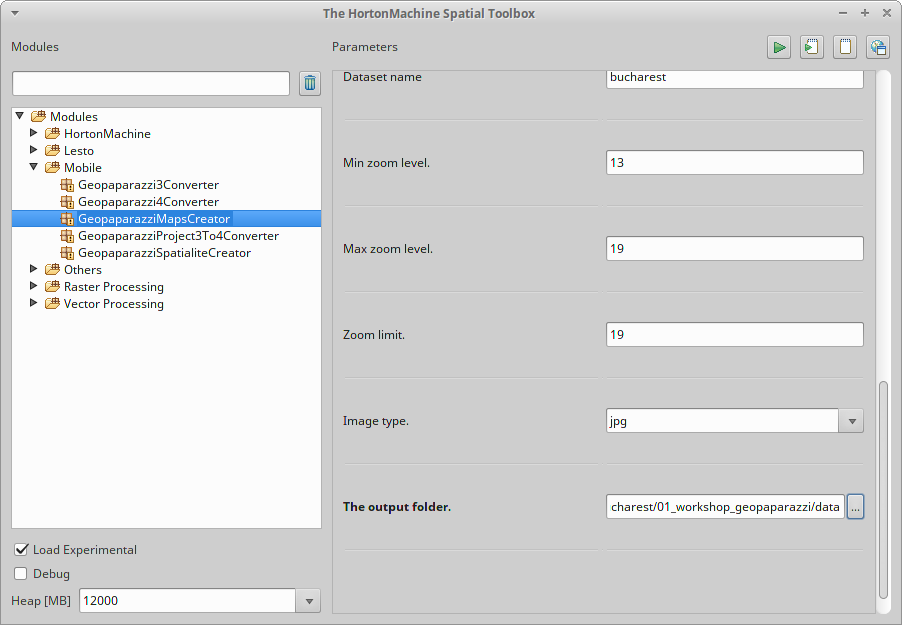
To finally generate the mbtiles database, push the run button on the upper right corner. A console will appear showing the current status:
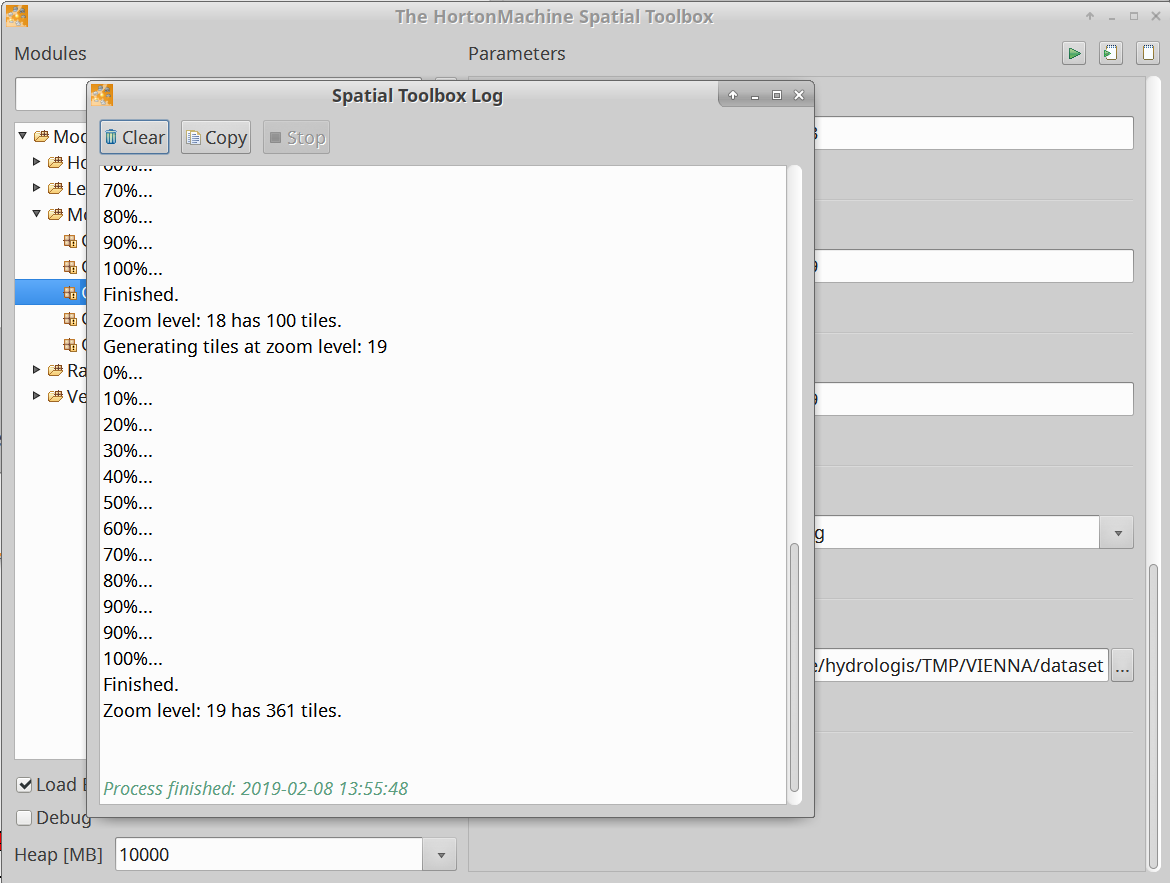
15.5. Create a spatialite database
The GeopaparazziSpatialiteCreator allows to convert a folder of shapefiles into a spatialite database that contains the layers styled following the supplied SLD.
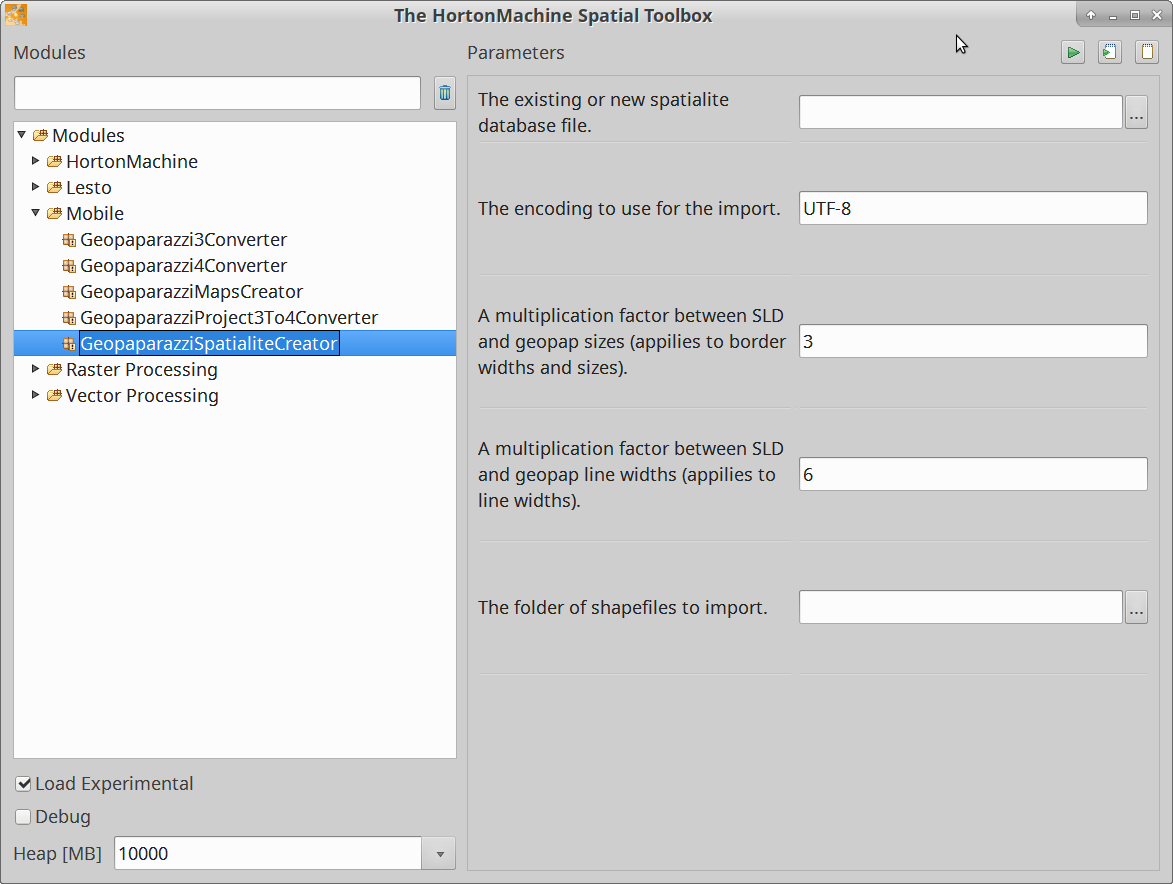
The only input parameters to set are the:
-
new spatialite database we want to create: …/dataset/bucharest.sqlite
-
the folder of shapefiles to convert: …/dataset/shps/
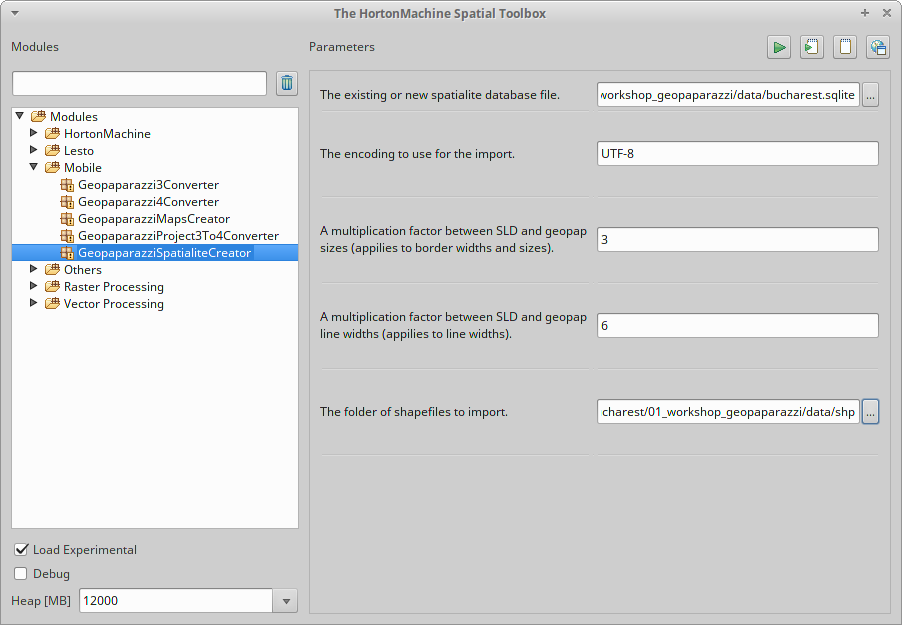
Then just run the module:
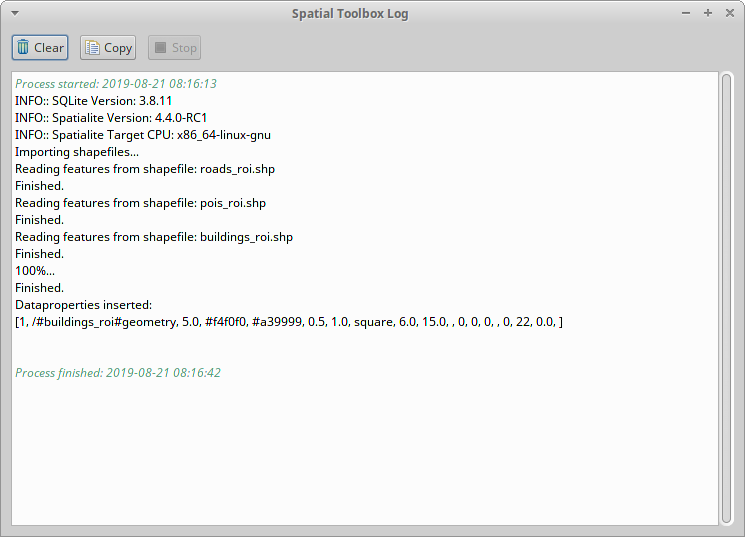
15.6. Create a form
Geopaparazzi supports complex notes called form based notes. To use them, a tags.json file needs to be created and placed inside the geopaparazzi folder inside the sdcard. In that file a json format description of the wanted tags and forms needs to be placed.
By default, to help the user to start, a sample tags.json is created in the Geopaparazzi installation. It contains form samples and examples to show all supported form widgets.
15.6.1. The example form
Let’s create a form to survey university buildings. It will be made up of 3 tabs.
The general tab:
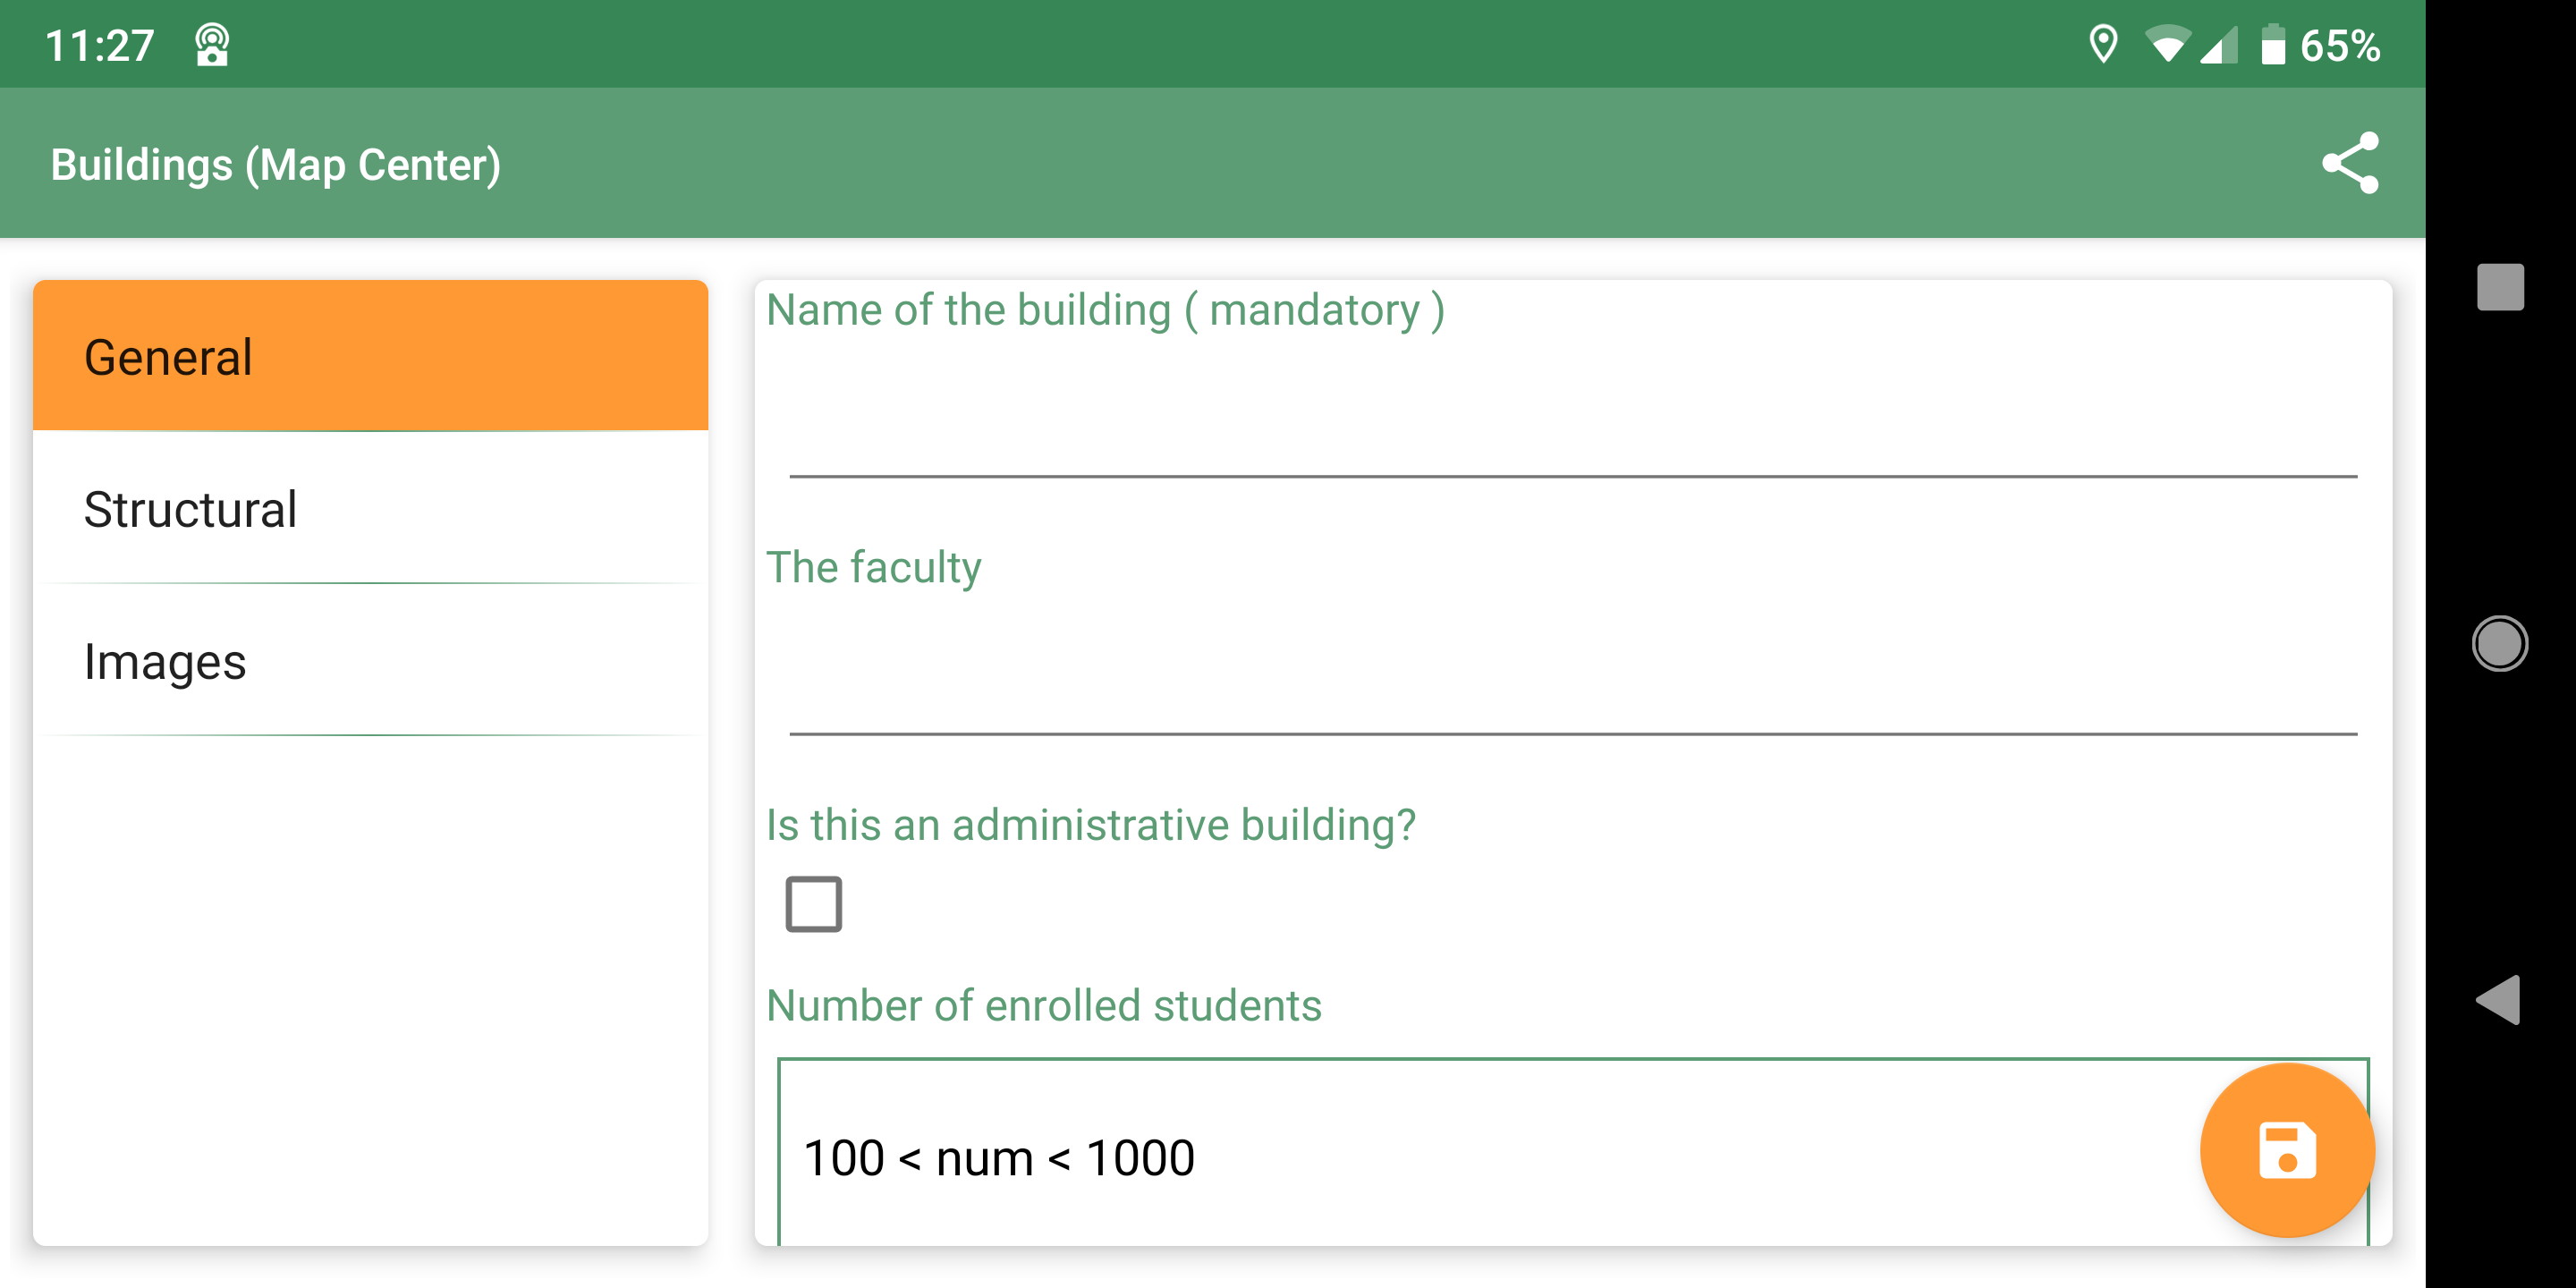
The structural tab:
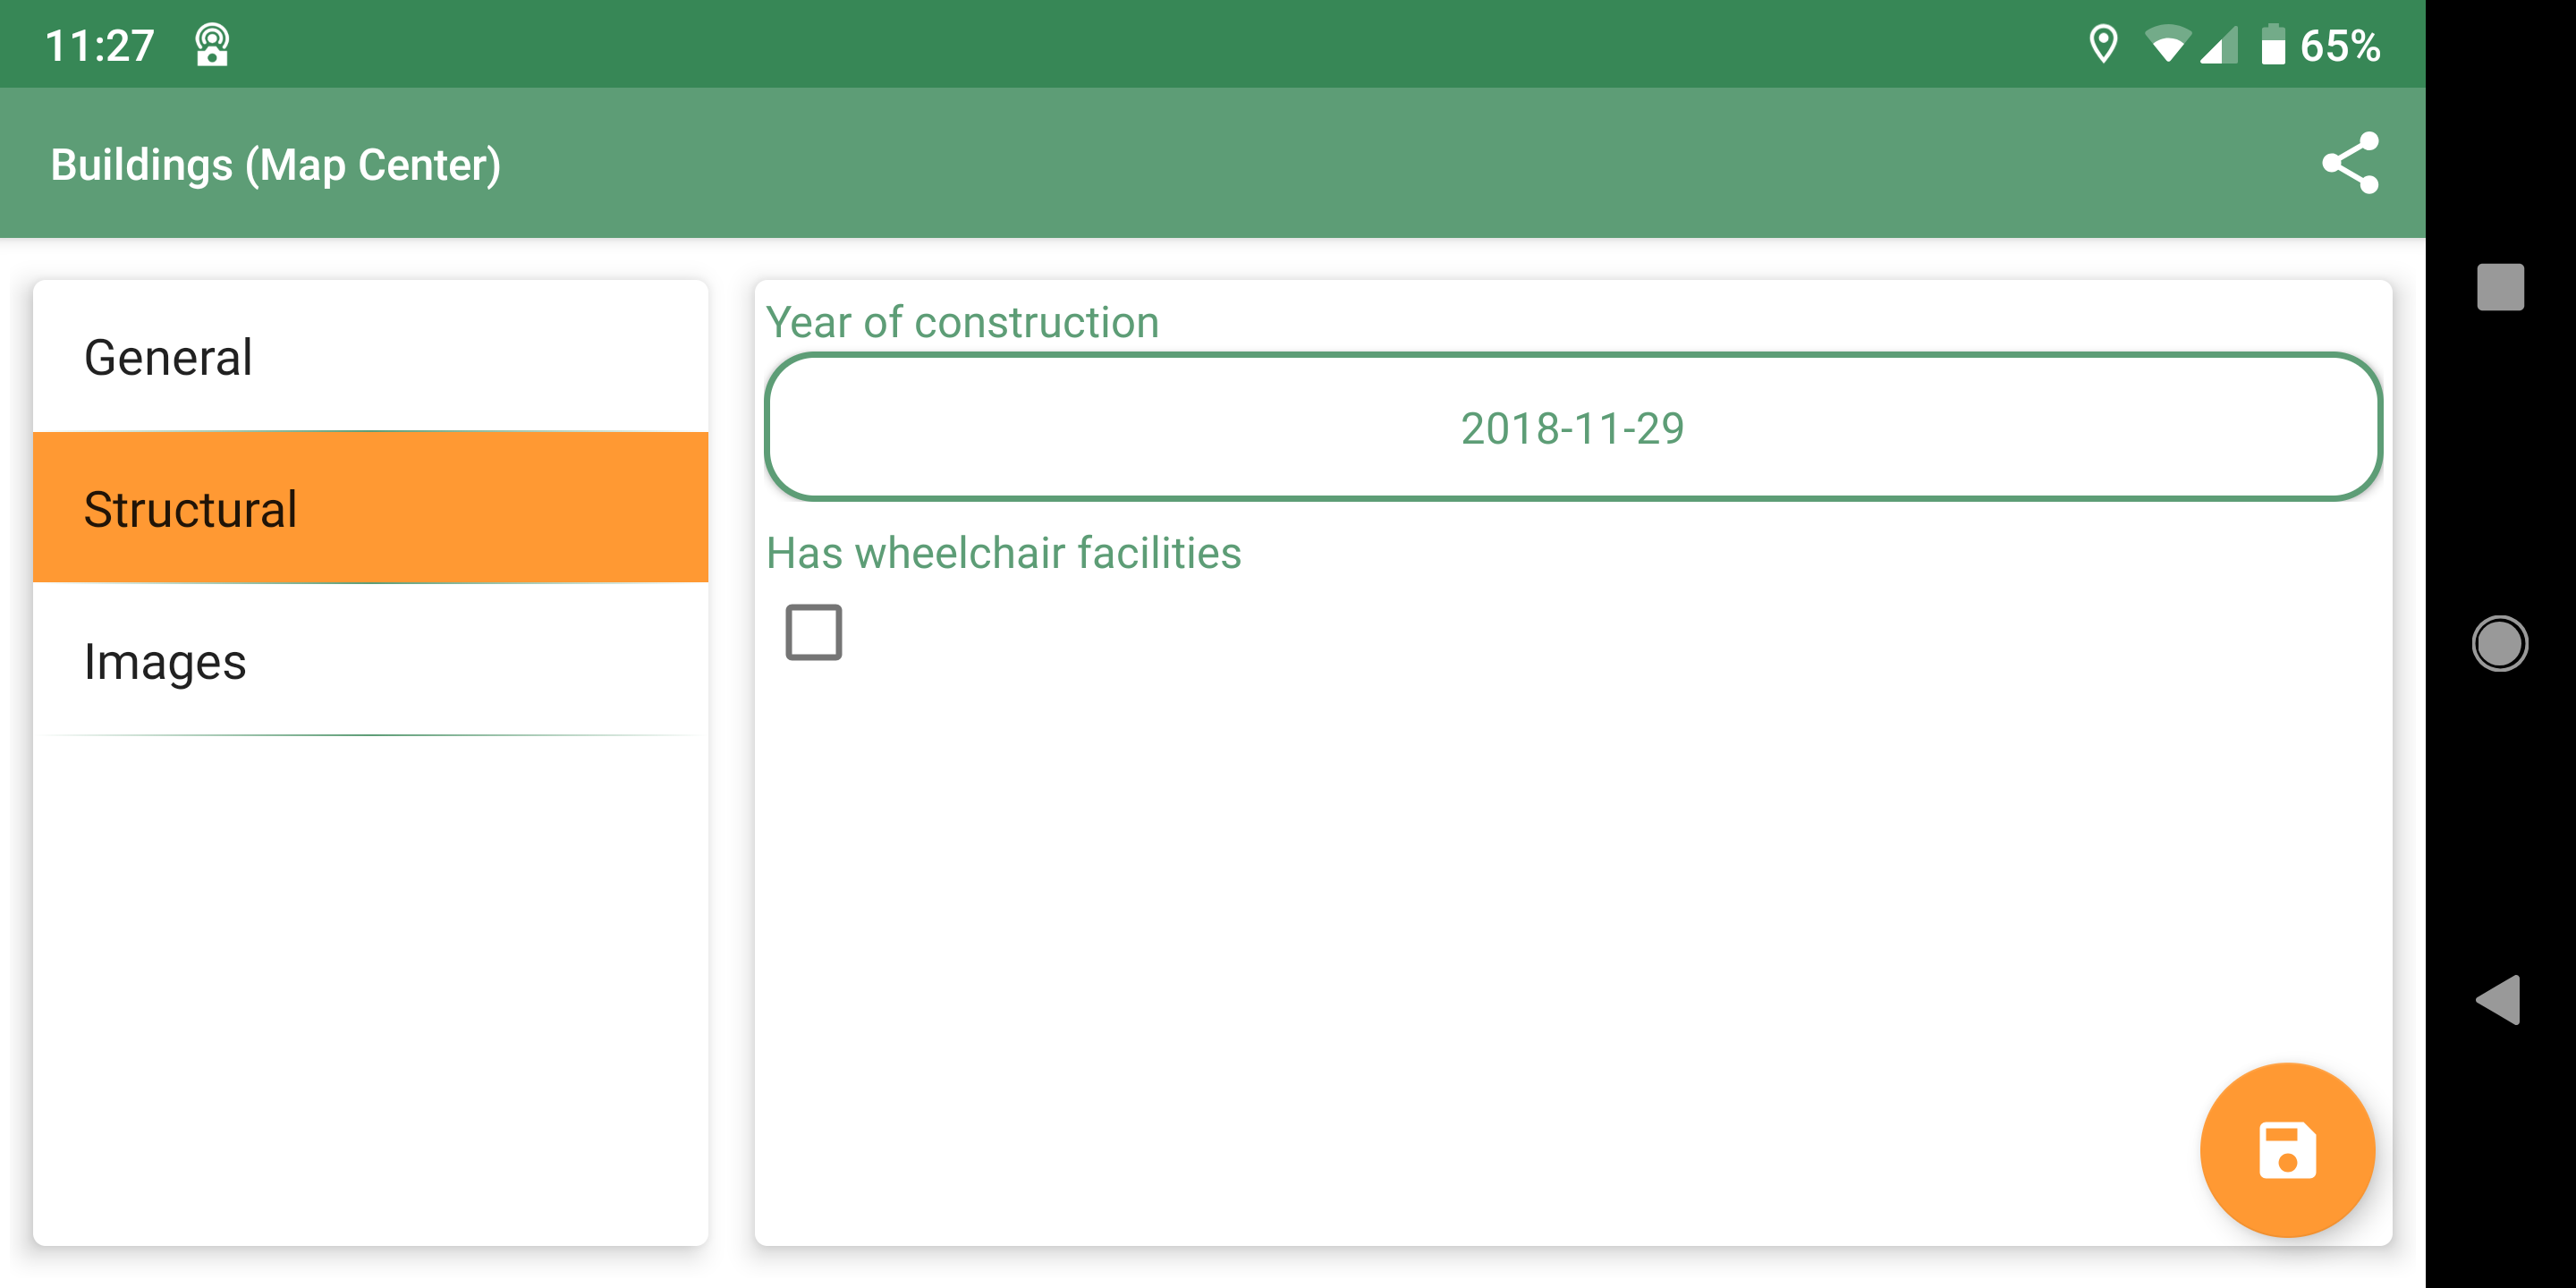
And the images tab:
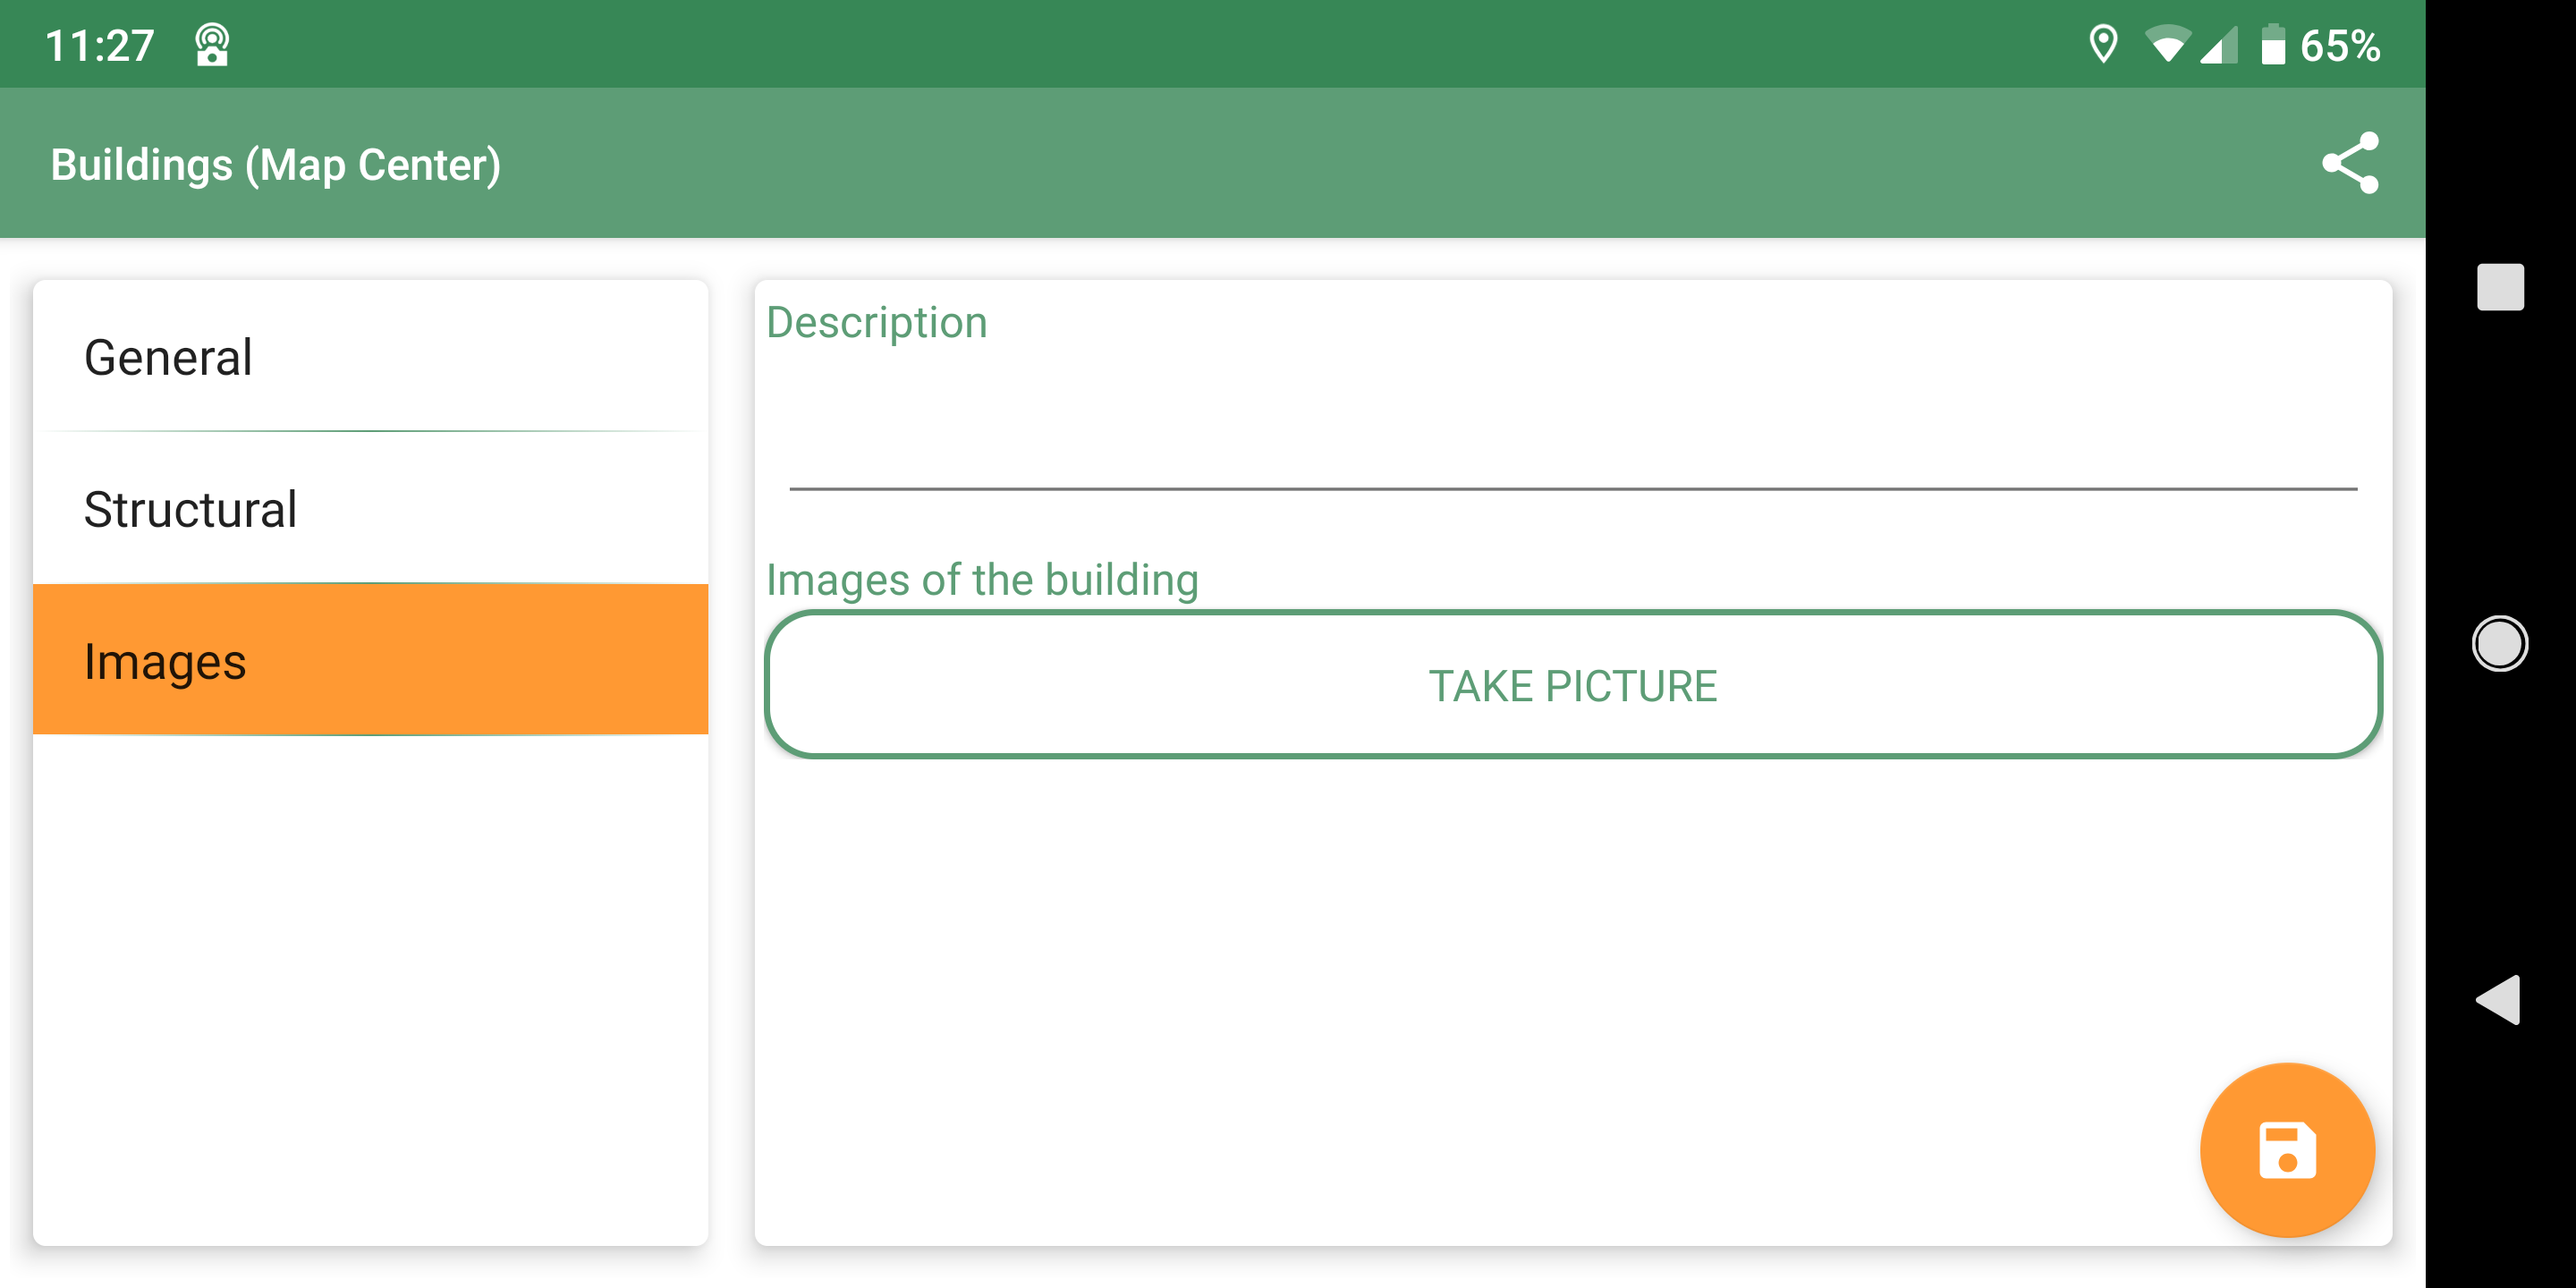
15.6.2. The gform module
The Hortonmachine has a module called gforms.exe that allows users to create forms easily.
Once opened it appears like this:
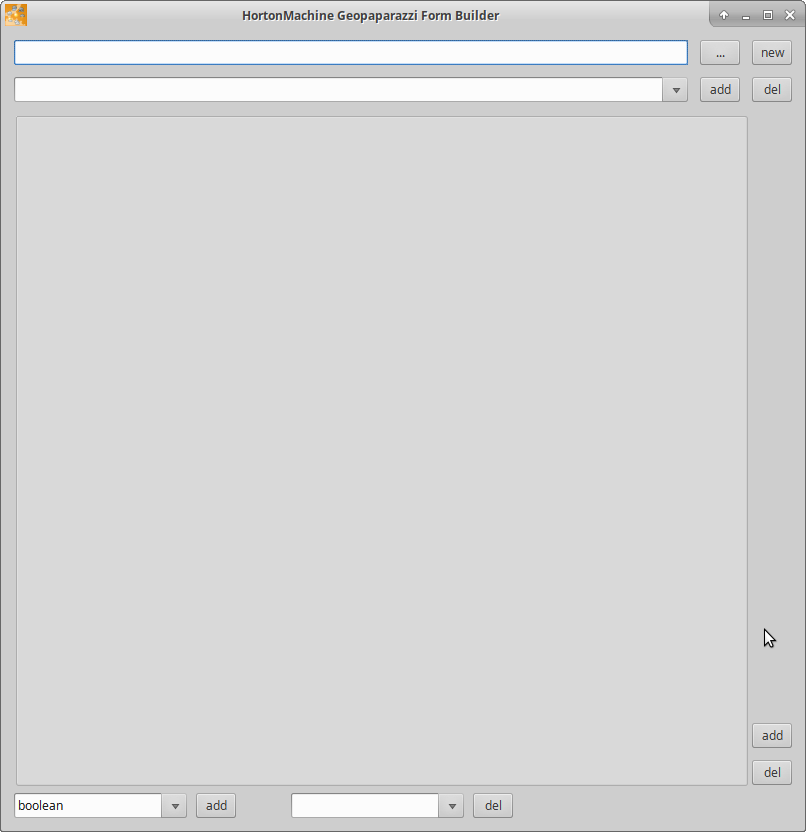
Create a new form
To create a new form push the new button and name a new file. If the name doesn’t finish by _tags.json, the application will take care of adding it.
So inserting just buldings, will produce a file buildings_tags.json.
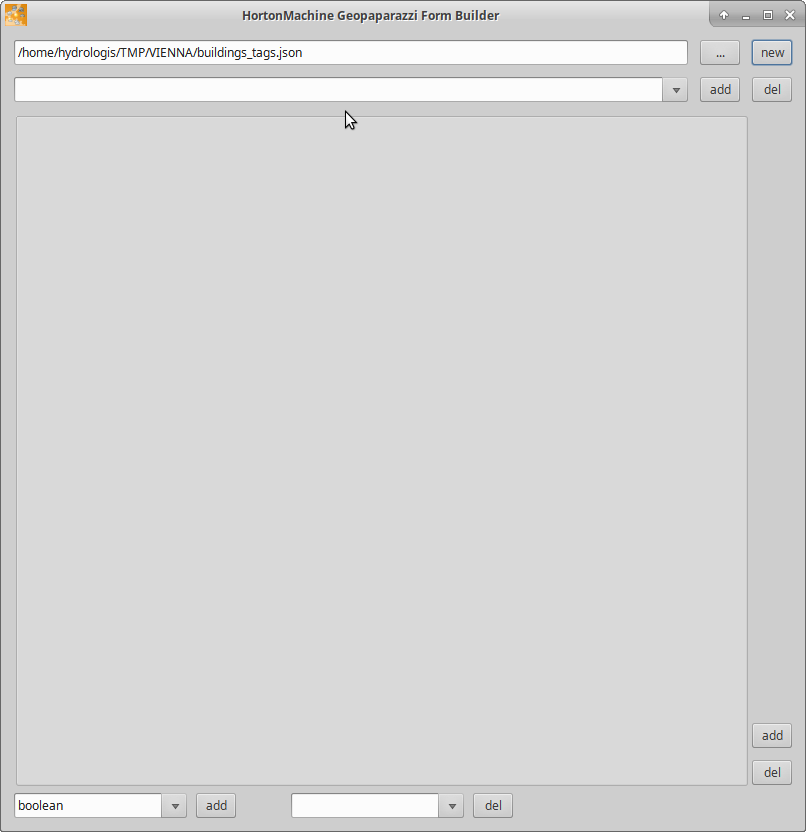
Create a section
Before doing anything, a section needs to be created. The section is what in geopaparazzi will be seen as a button.
Push the add button to the left of the combobox to add a new section:
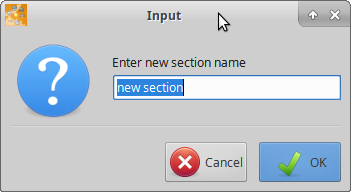
Enter a name and push ok. buildings might be a good name.
The combobox that had been empty up to now should now contain the buildings section.
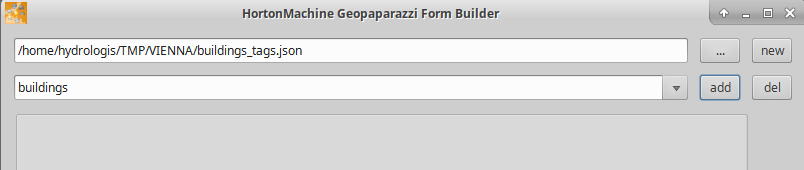
With the del button it is possible to delete an existing section. For safety the user will be prompted to make sure the section should be removed.
Create a tab
To create a tab the add button at the bottom right has to be used. The same as for the section, a name for the tab is prompted.
We are first creating the General tab, so:
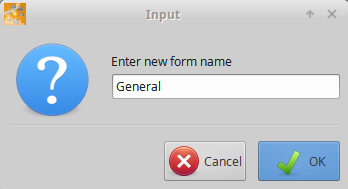
Let’s add also the Structural and Images tabs. The result should look like:
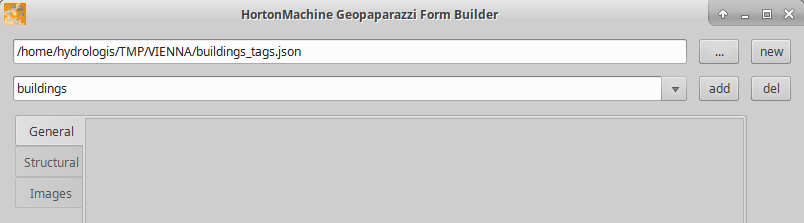
While the currently selected tab can be removed (del button below the add button) and new ones can be added, mind that at the time they can’t be reordered: new tabs are attached to the end.
Create widgets
Once a tab has been created, widgets can be added to it. Widgets can be of various types. The combobox at the bottom of the window contains all supported:
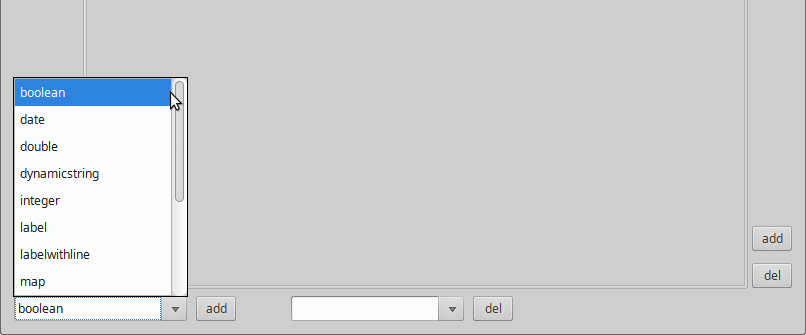
Add a textfield (to function as a label)
First we want to add a textfield that should also act as label, i.e. if populated it should be visible near the point in the map view. It would be a good idea also to make it mandatory, i.e. the user won’t be able to save the note without filling it out.
Select string from the widgets combobox and fill in the necessary parameters.
-
key: the unique key of the field. It has to be unique in the whole section. This is then used as column name for the shapefiles.
-
label: the label presented to the user in the form.
-
default: an optional default value to insert.
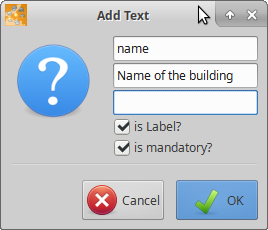
Once pushed ok, the form should look like:
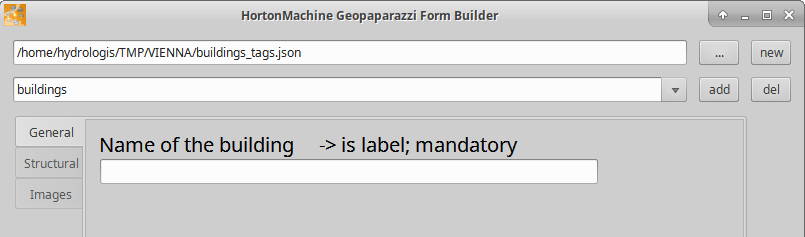
Note that in the label part, after an arrow, information about it being in label mode and/or mandatory, is given.
Delete a widget
If something went wrong and we need to remove a widget from the current tab, use the second combobox at the bottom left of the del button.
That combobox is constantly updated with the keys of the widgets currently present in the tab. Selecting the righ key and pushing del allows us to remove a widget. Again, as for tabs, remember that you can remove widgets in the middle, but new widgets are added to the bottom.
Please now add a textfield for the faculty field.
In this case a default value might be a good idea.
Add a checkbox
To add a checkbox, select the boolean widget.
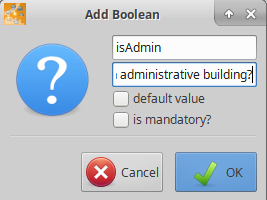
After which we should see something like:
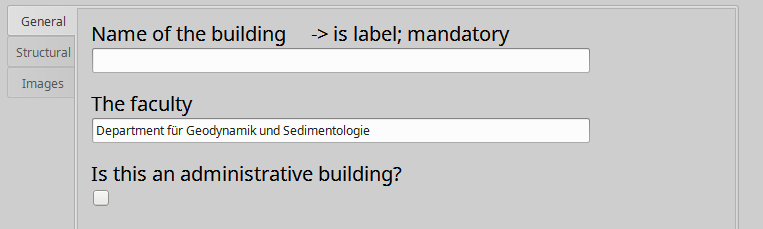
Add a combobox
The last widget of the General tab is the number of enrolled students.
stringcombo is the choice for this:
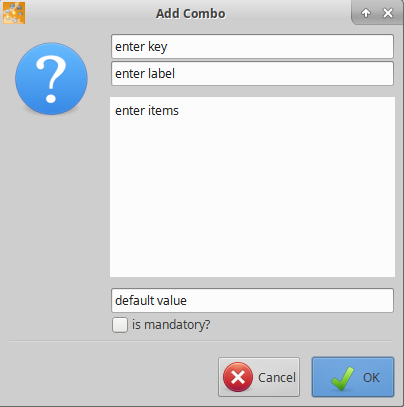
While we have already seen key, label and defaultvalue, the items textarea is new. In there we can place the values we want to see in the combobox, one per line:
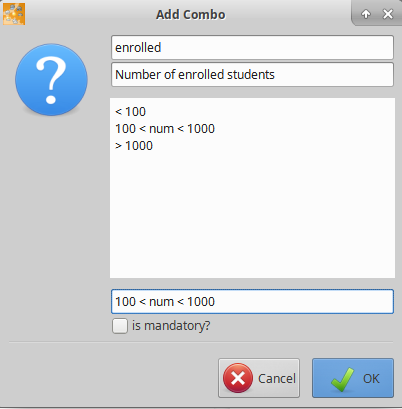
| The default value has to be exactly the same as one of the items. |
After adding the combobox, our form should now look like this:
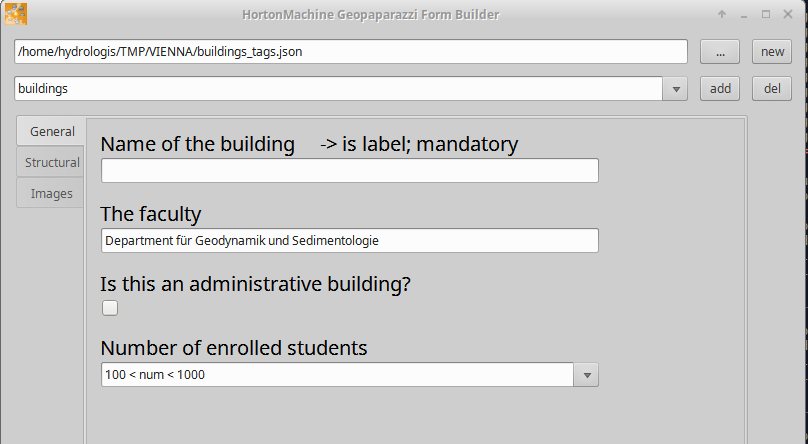
Once the structural tab is done it should look like:
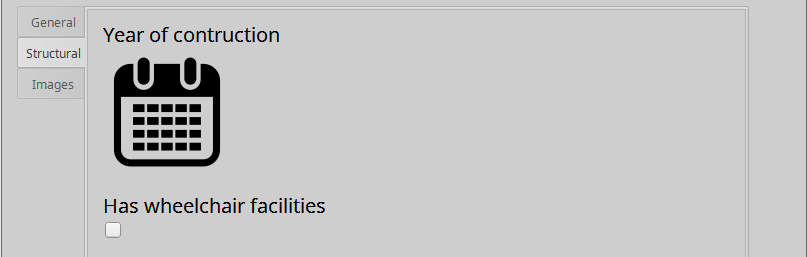
and the images tab:
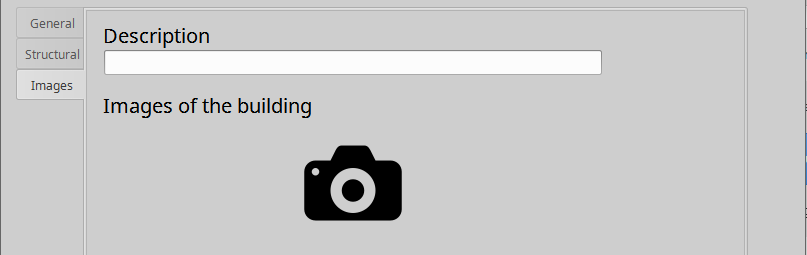
| the form is auto saving: all changes are automatically registered on the output file. |
See the form in Geopaparazzi
To test the form inside Geopaparazzi, it is necessary to upload the form file to the device and place it inside the folder geopaparazzi at the root of the sdcard.
Any file ending with *_tags.json will be loaded in the geopaparazzi notes view.
So if we added our new form file, we should get the following:
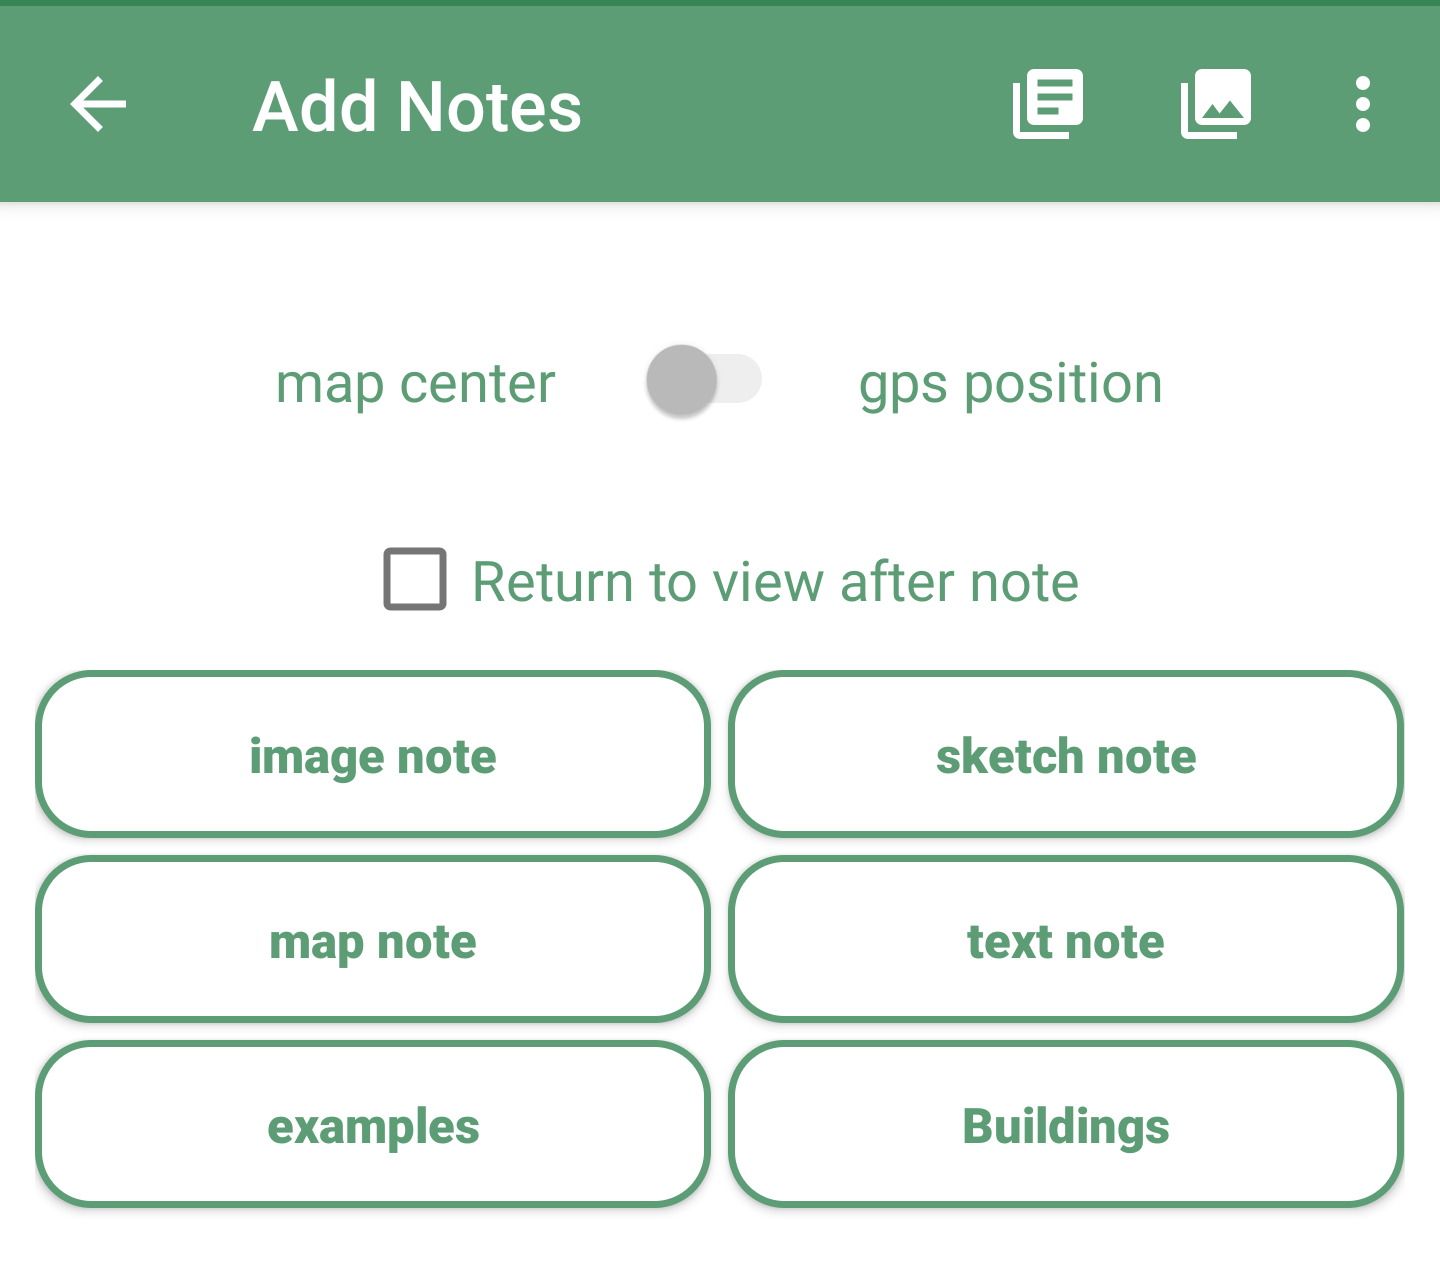
Note that only the Buildings button comes from the form file we added, the others are from the default tags.json that is available from the beginning in geopaparazzi.
15.6.3. Notes about forms
-
a form is persisted in geopaparazzi with its whole definition. So a note can be edited also when the original form is no longer available
-
a few widgets, namely connectedcombo and onetomulticombo are not yet supported in the gforms application, but can be created manually
-
a multistringcombo allows for multiple selection
-
forms are editable, simple notes not
16. Use case: Use of Geopaparazzi in Egypt to create a map to improve the management of small wastewater treatment plants.
16.1. Introduction
Have you ever tried to type in google: sanitation maps, sanitation coverage, sanitation or inventory tracking?
It is interesting to note that the agencies managing the wastewater treatment plants in the United States and Canada monitor and continuously update the inventory of small delocalized plants in order to optimize their management, while the numerous development agencies that deal with sanitation in developing countries express and declare the state of inadequacy of the system of waste treatment but do not quantify the state of art.
The management of small treatment plants of domestic sewage in decentralized communities is an issue with different perspectives. In any place on earth it involves many actors, linking technical to cultural, environmental, educational and health services. It is a topic that often touches critical as well as hidden issues. Experts in this field are well aware of that!
When you think of a small village, a rural setting with a few houses and lots of animals, or a peri-urban area that grew quickly and without any planning or again neighboring communities linked by a waterway that carries waste from upstream to valley, it is not immediate to think that all these places (due to the presence of man and animal) are a source of biomass. They are a sources of waste and organic material that often brings a high and invisible pathogenic charge.
Many projects related to developing countries today focus the attention on the proper disposal of the waste and on prevention as fundamental for the health of the inhabitants. Numerous agencies and associations dedicated to development cooperation have shown that untreated wastewater spilled into the surrounding environment without any attention is the primary vector of diseases and therefore often of epidemics in areas with deficits at levels of hygiene and public health (see the Water, Sanitation and Hygiene and the Joint Monitoring Programme).
The target C of the seventh Millennium Development Goal aimed to halve by 2015 the proportion of people without sustainable access to safe water and basic health services. The assessment tool implemented in recent years has been the count of the percentage of population using the health service.
But:
-
What is the scenario in terms of plants?
-
Where are they?
-
What do they produce?
-
How much?
-
What is the trend?
-
What are the possible risk factors?
-
What are the environmental characteristics of their location?
-
And the social context?
-
The cultural?
-
How many and which animals contribute?
-
What are the types of installations in operation?
It is clear that to get a complete picture of this kind takes time, lots of data collection, laboratory tests, and then hypothesis, correlations, ideas and possible strategies.
It is now well known that from a technical standpoint there are no prepackaged solutions exportable in contexts with very different boundary conditions. Some causes may seem trivial, but if underestimated they end up affecting the efficiency of the treatment.
It should be enough to say that there are places in the world where the toilet paper is not thrown into the toilet; there are places where after defecation you clean up with your hand; others where even plastic, cloth and diapers are thrown into the toilet and places in which under the sink there is a shredder and everything ends up into the sewer system.
These are information that decide the diameter of the pipes even before the type of treatment and planting. And if the diameter of the tubes is wrong the whole system becomes meaningless.
How many socio-cultural aspects exist in the various regions of the world that we do not know, that we can’t even imagine, that can make you smile or frighten, but that in the construction of a plant have the same weight as the distribution of BOD5?
There is no doubt that a tool that allows you to collect data of this kind, to catalog them, and most important geotag them to make them visible on a map and return the state of the existing as well as facilitates the correlation is crucial in the whole process of planning and improvement of health services in developing contexts.
16.2. Monitoring activities
During fall of 2010 Geopaparazzi has been used in the monitoring of small waste water treatment plants in decentralized communities of the Nile Delta, in a thesis project in Environmental Engineering within a larger project of technical development cooperation (ESRISS project).
The idea was to be able to do an effective analysis and mapping of the plants in the area of the Nile Delta to compare different types of treatment and analyze the parameters that contribute to the success or failure of a solution. The result of this campaign suggested the usefulness of this application and the need to widen its use to build the existing maps that consider all the complexity of the factors involved in the search for solutions to improve the health conditions of the contexts under analysis. Only in this way it is possible to build an updated database on the basis of which appropriate solutions can be proposed.
The main goal has been to integrate missing plants data.
To give an idea, information about the available data are shown for some of the plants:
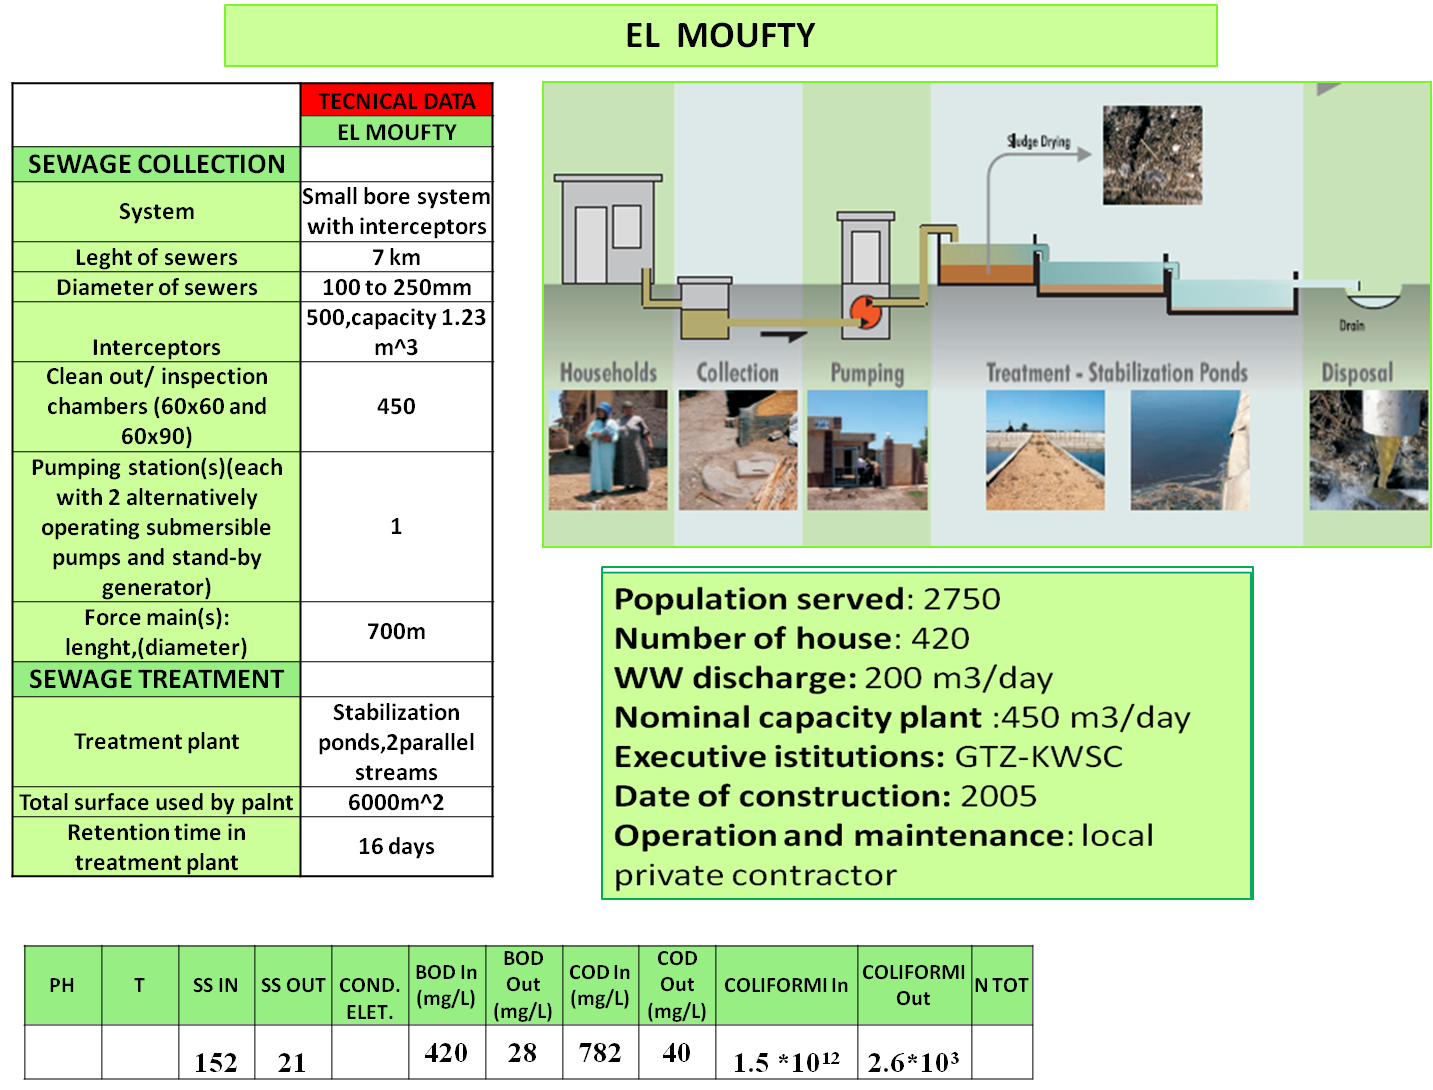
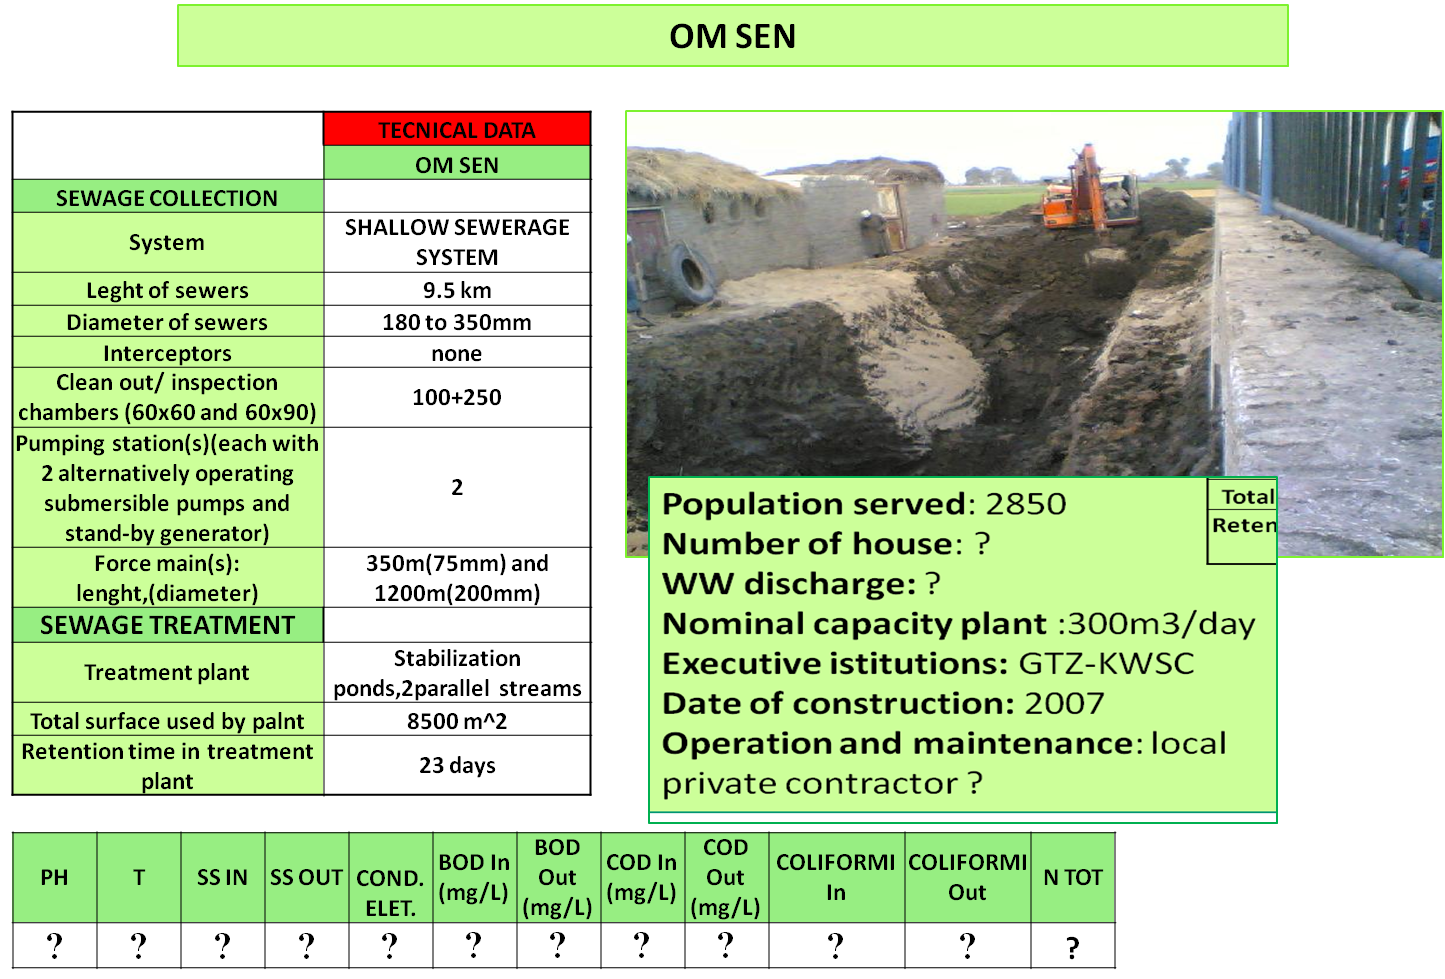
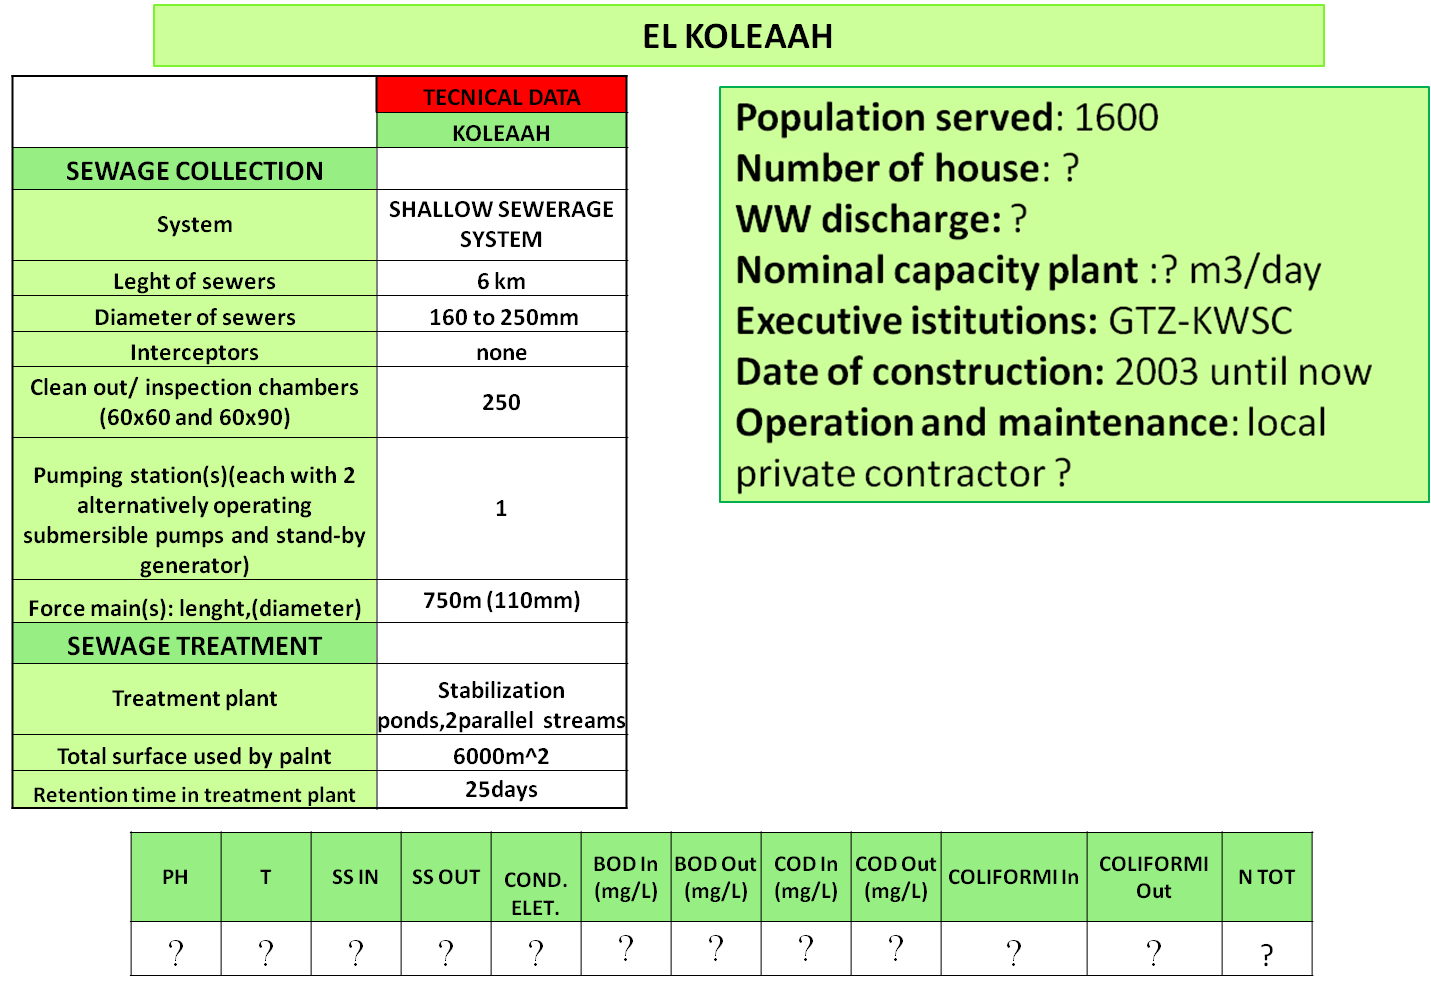
16.3. Technical background
Based on the available data a dedicated form has been designed to collect in a standardized way as much data as possible.
Once the form has been loaded into Geopaparazzi, it has been possible to access it from the add notes view.
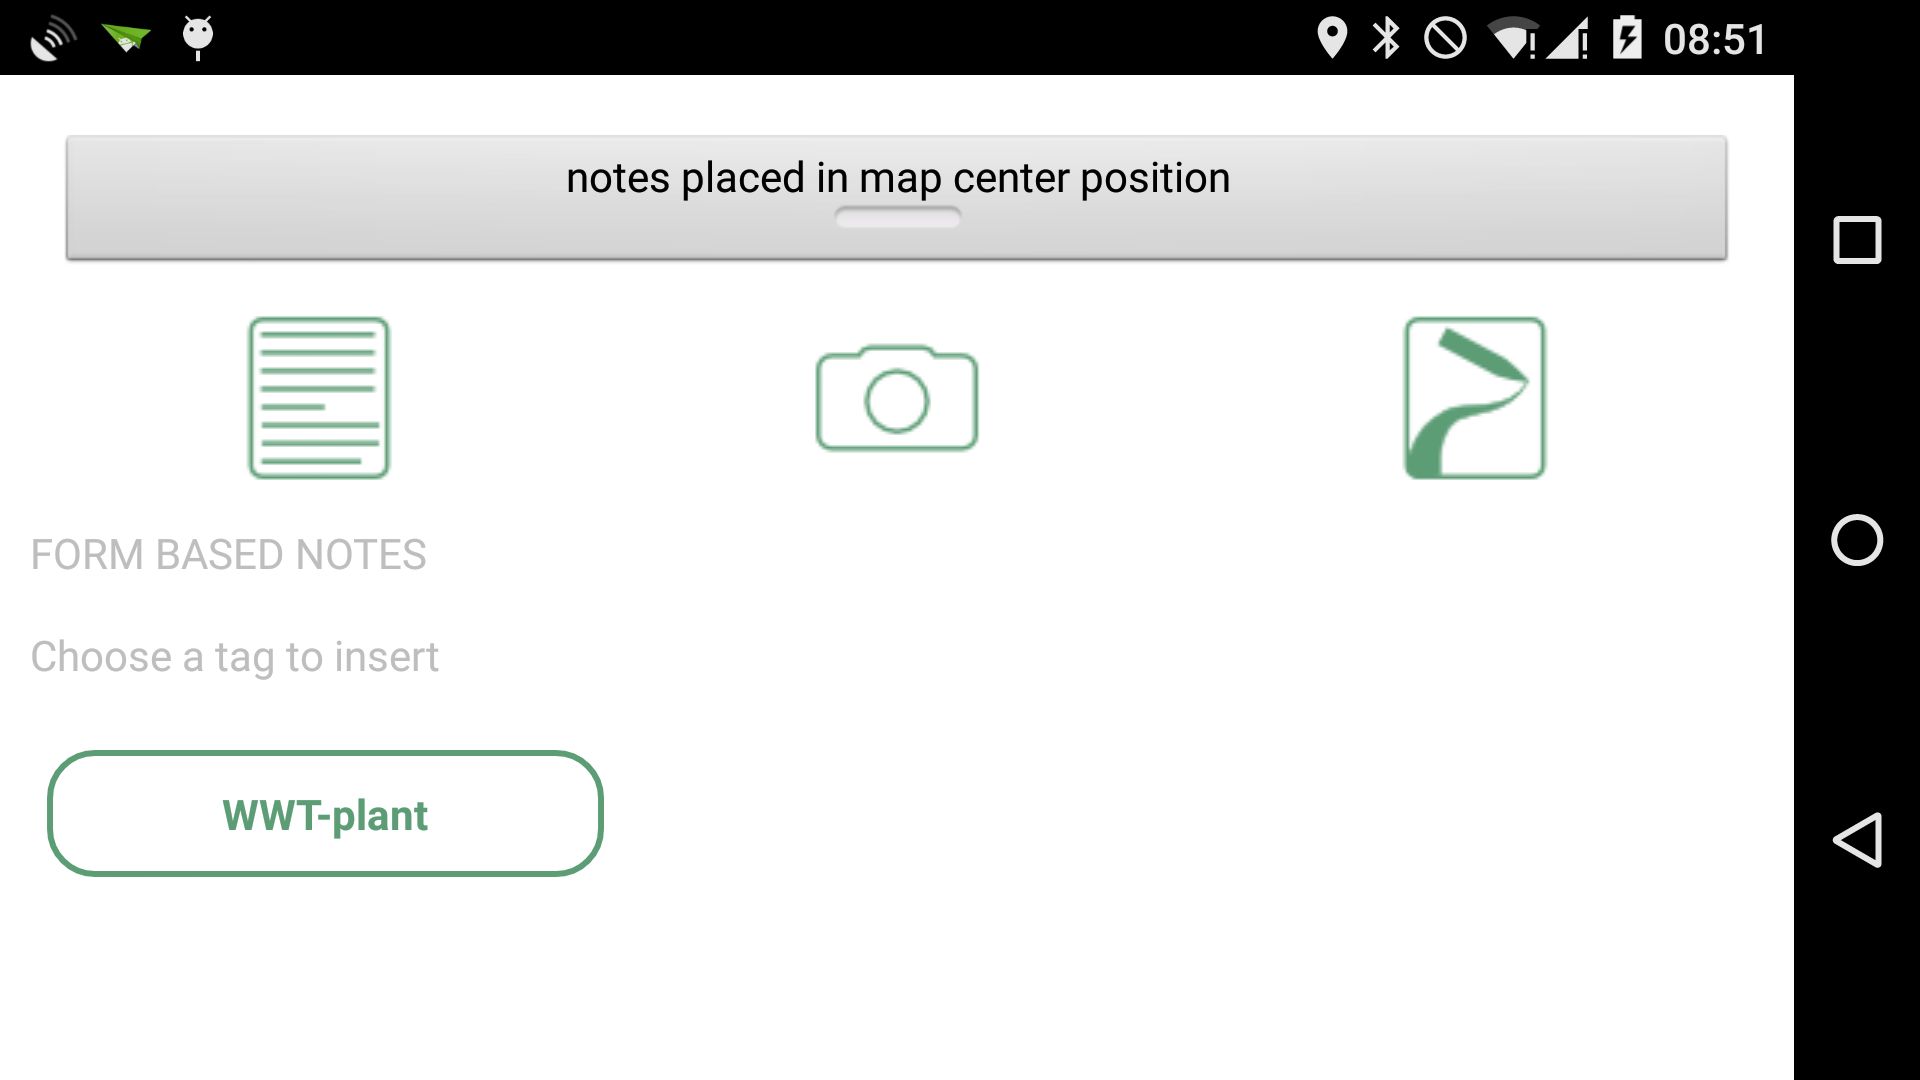
The form has been divided into 5 main sections to make it easier to read:
-
General data
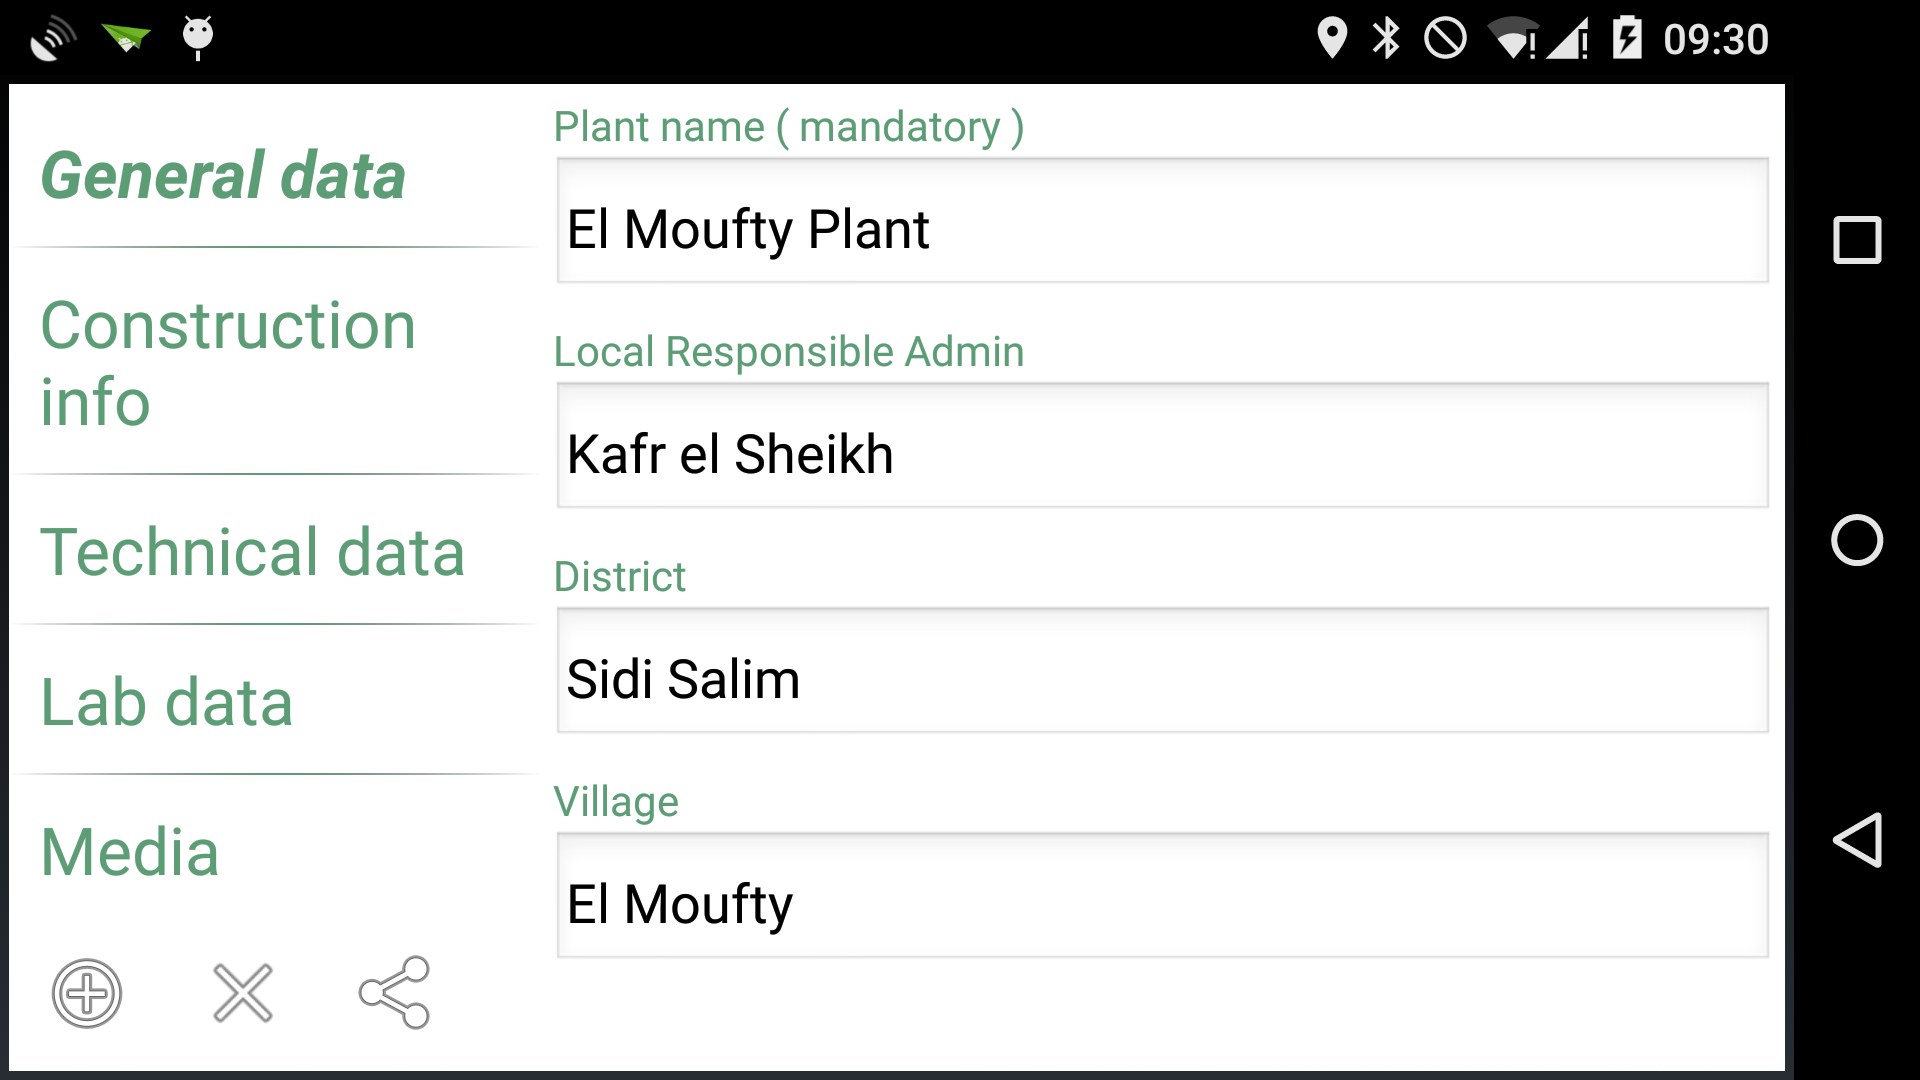
-
Construction info
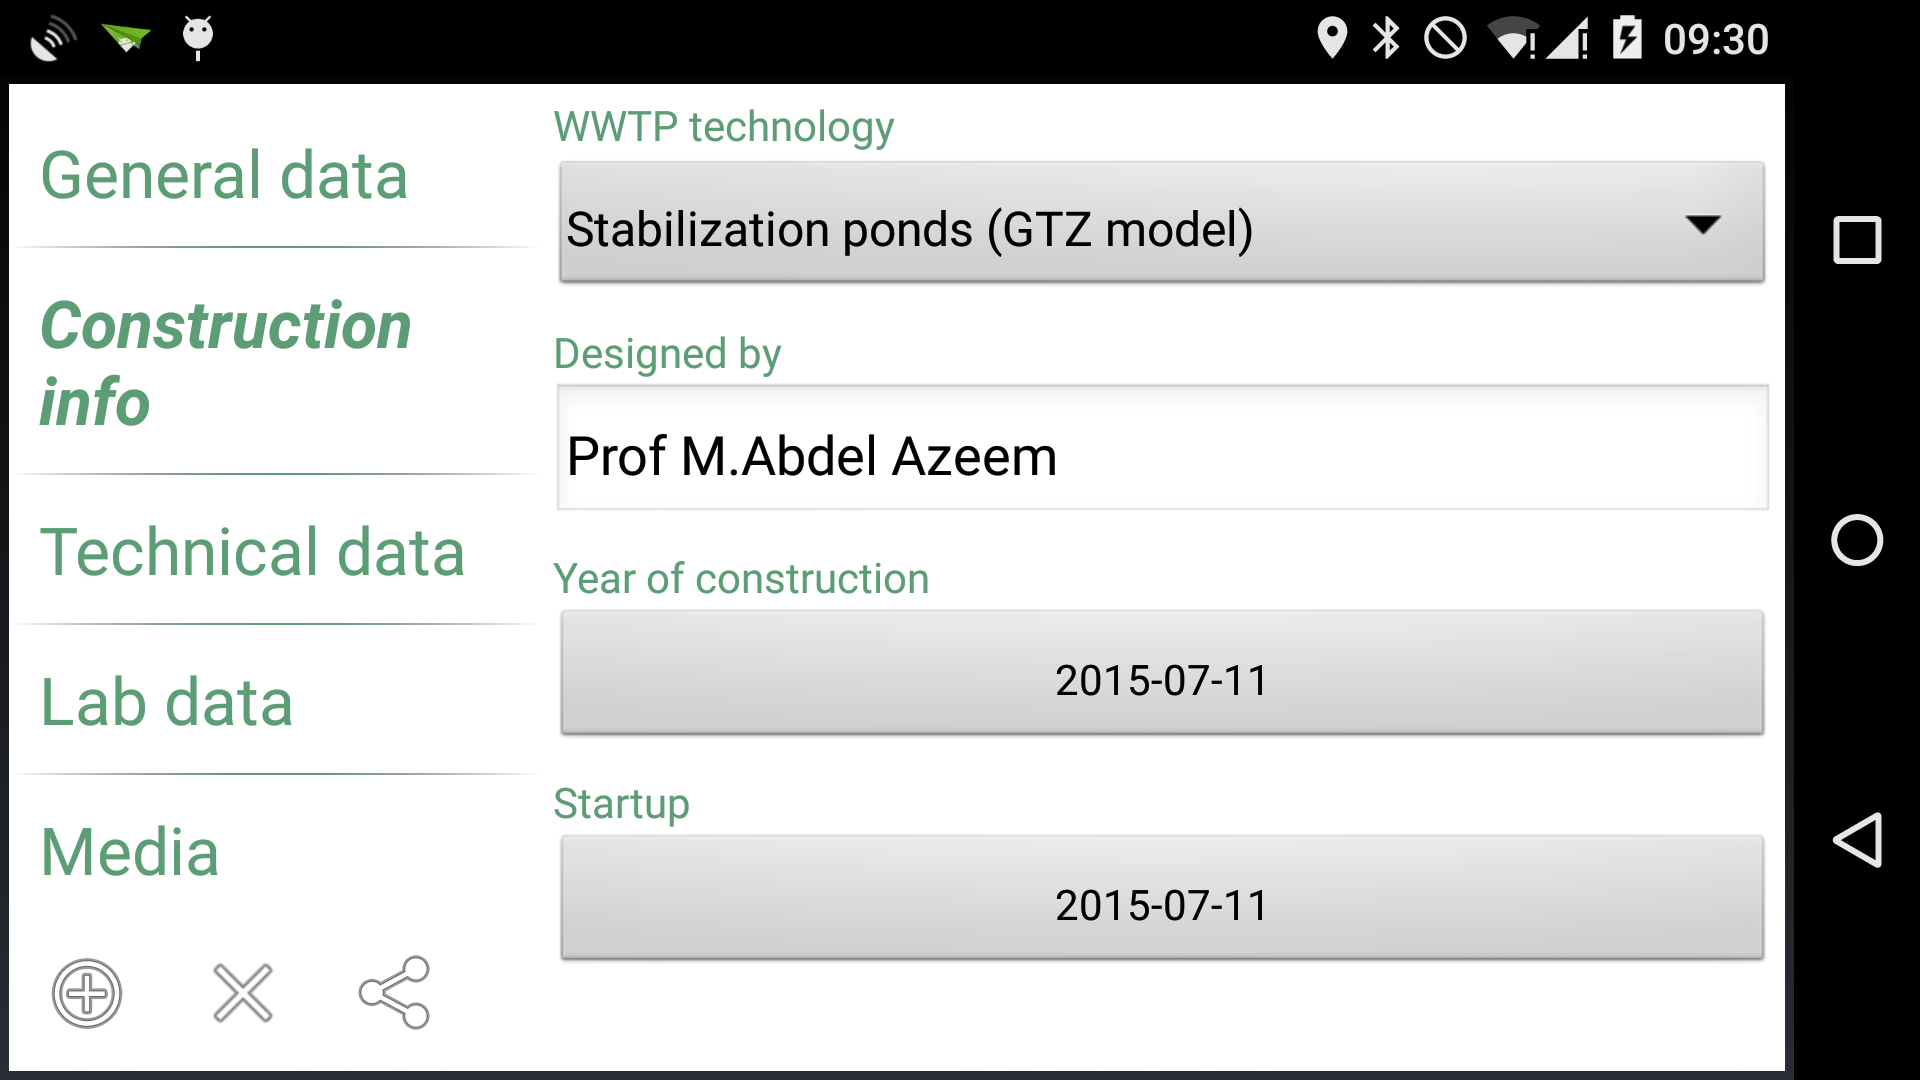
-
Technical data
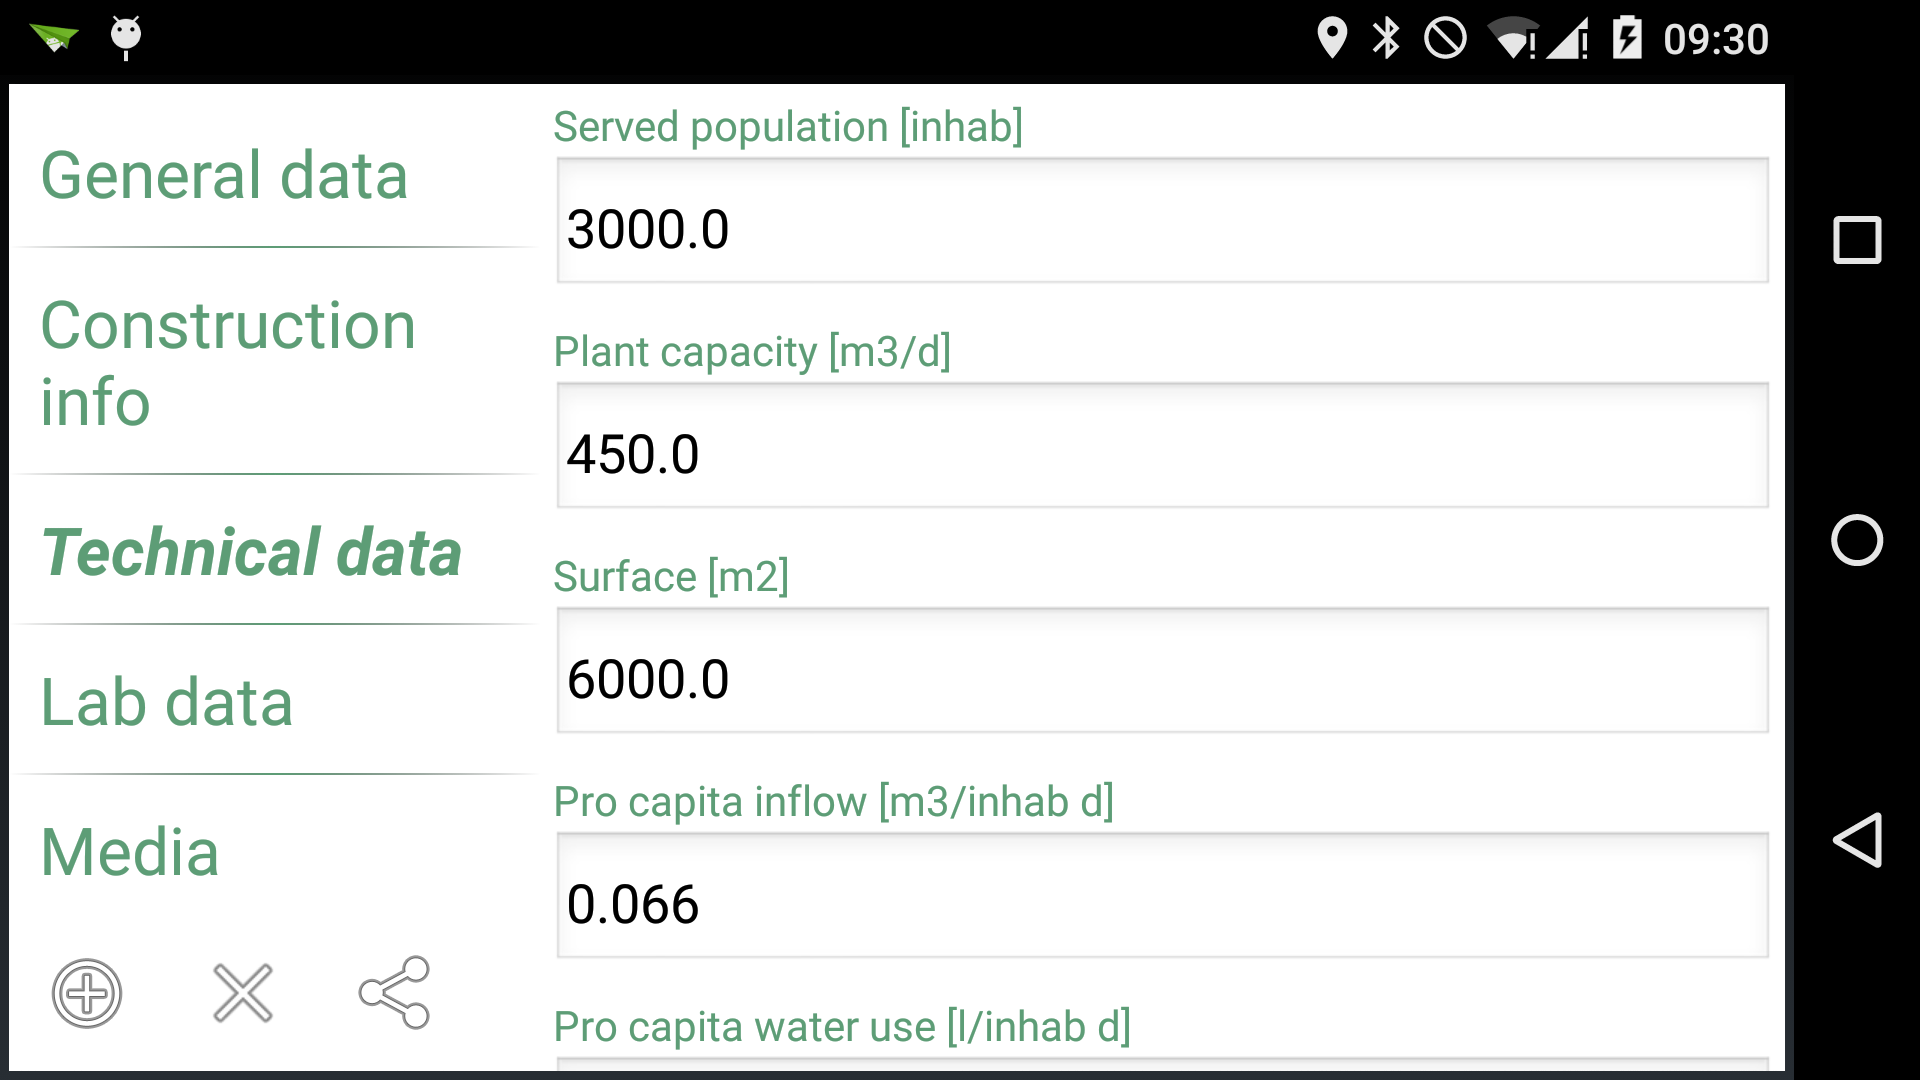
-
Lab data: this section has been added even if it is quite impossible to gather lab data in the field. But since the form based notes can be opened and modified at any time, the section has been added for further update
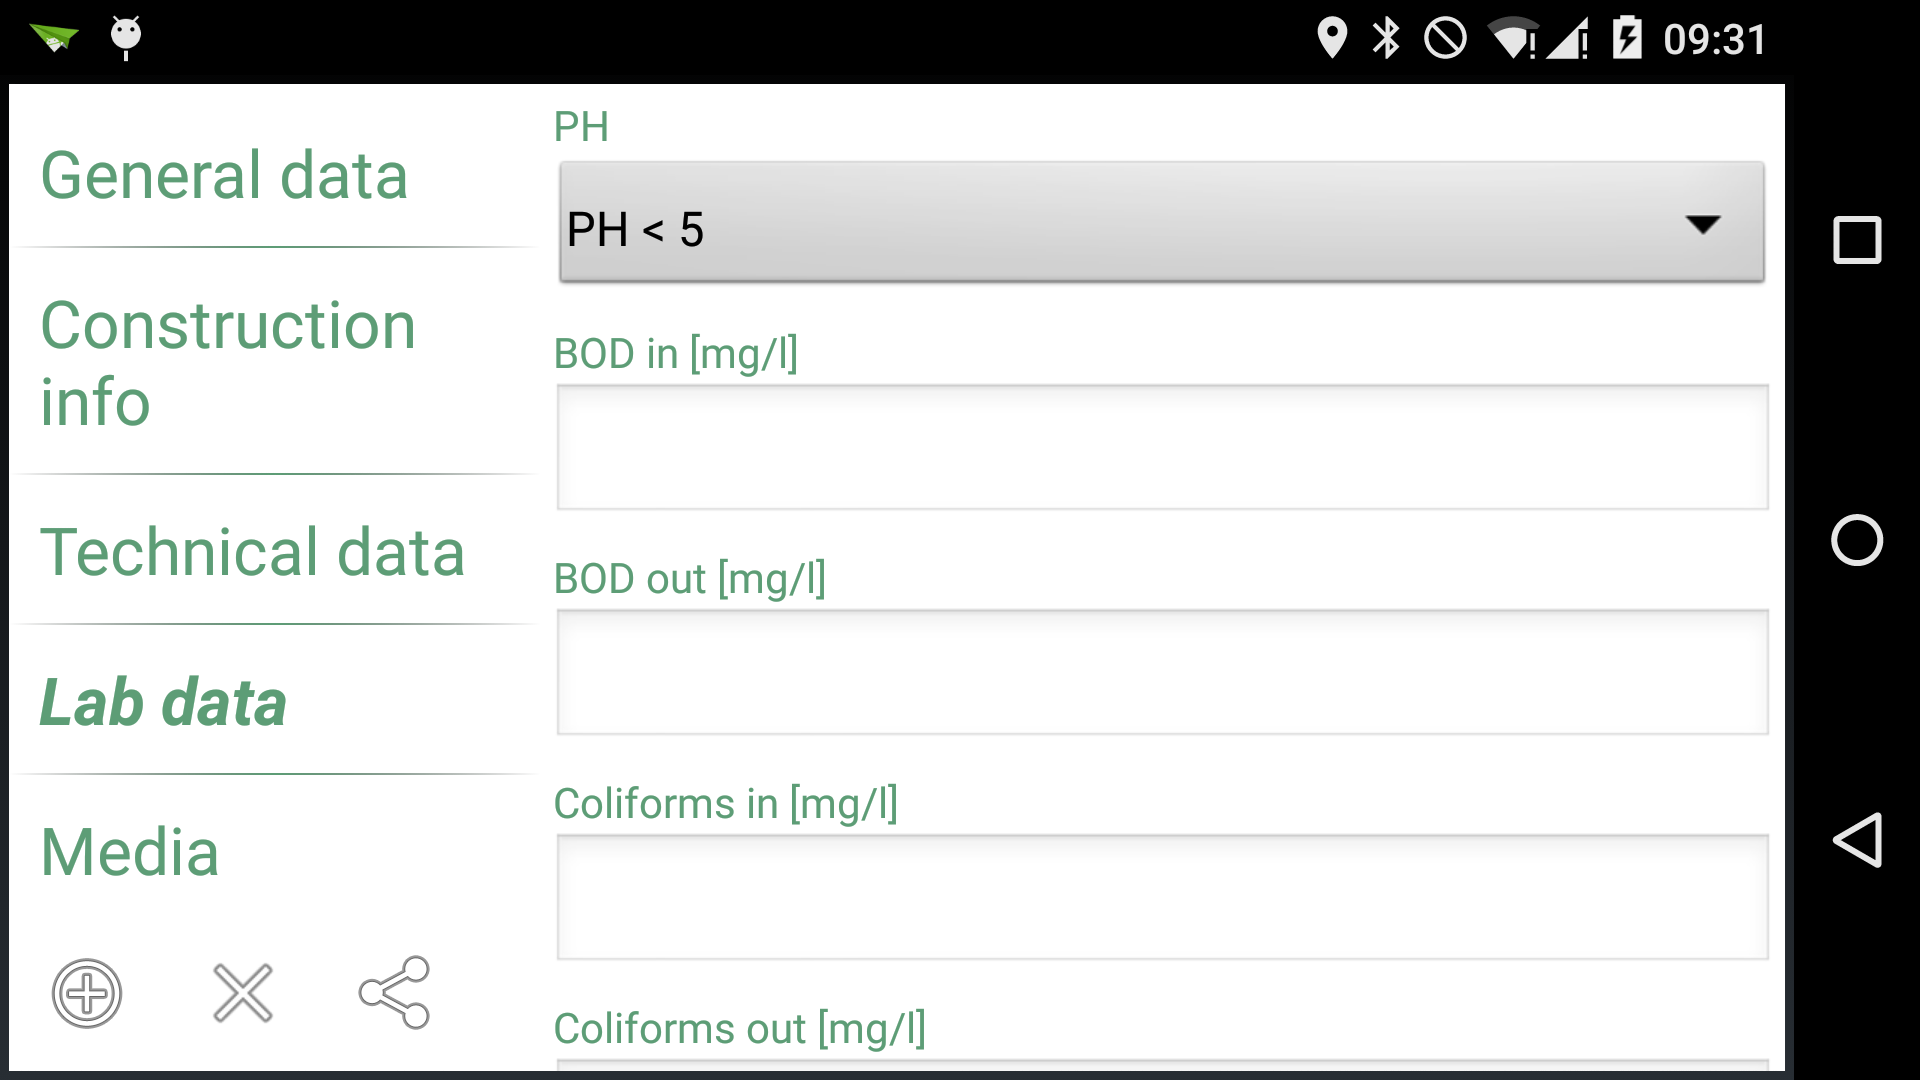
-
Media
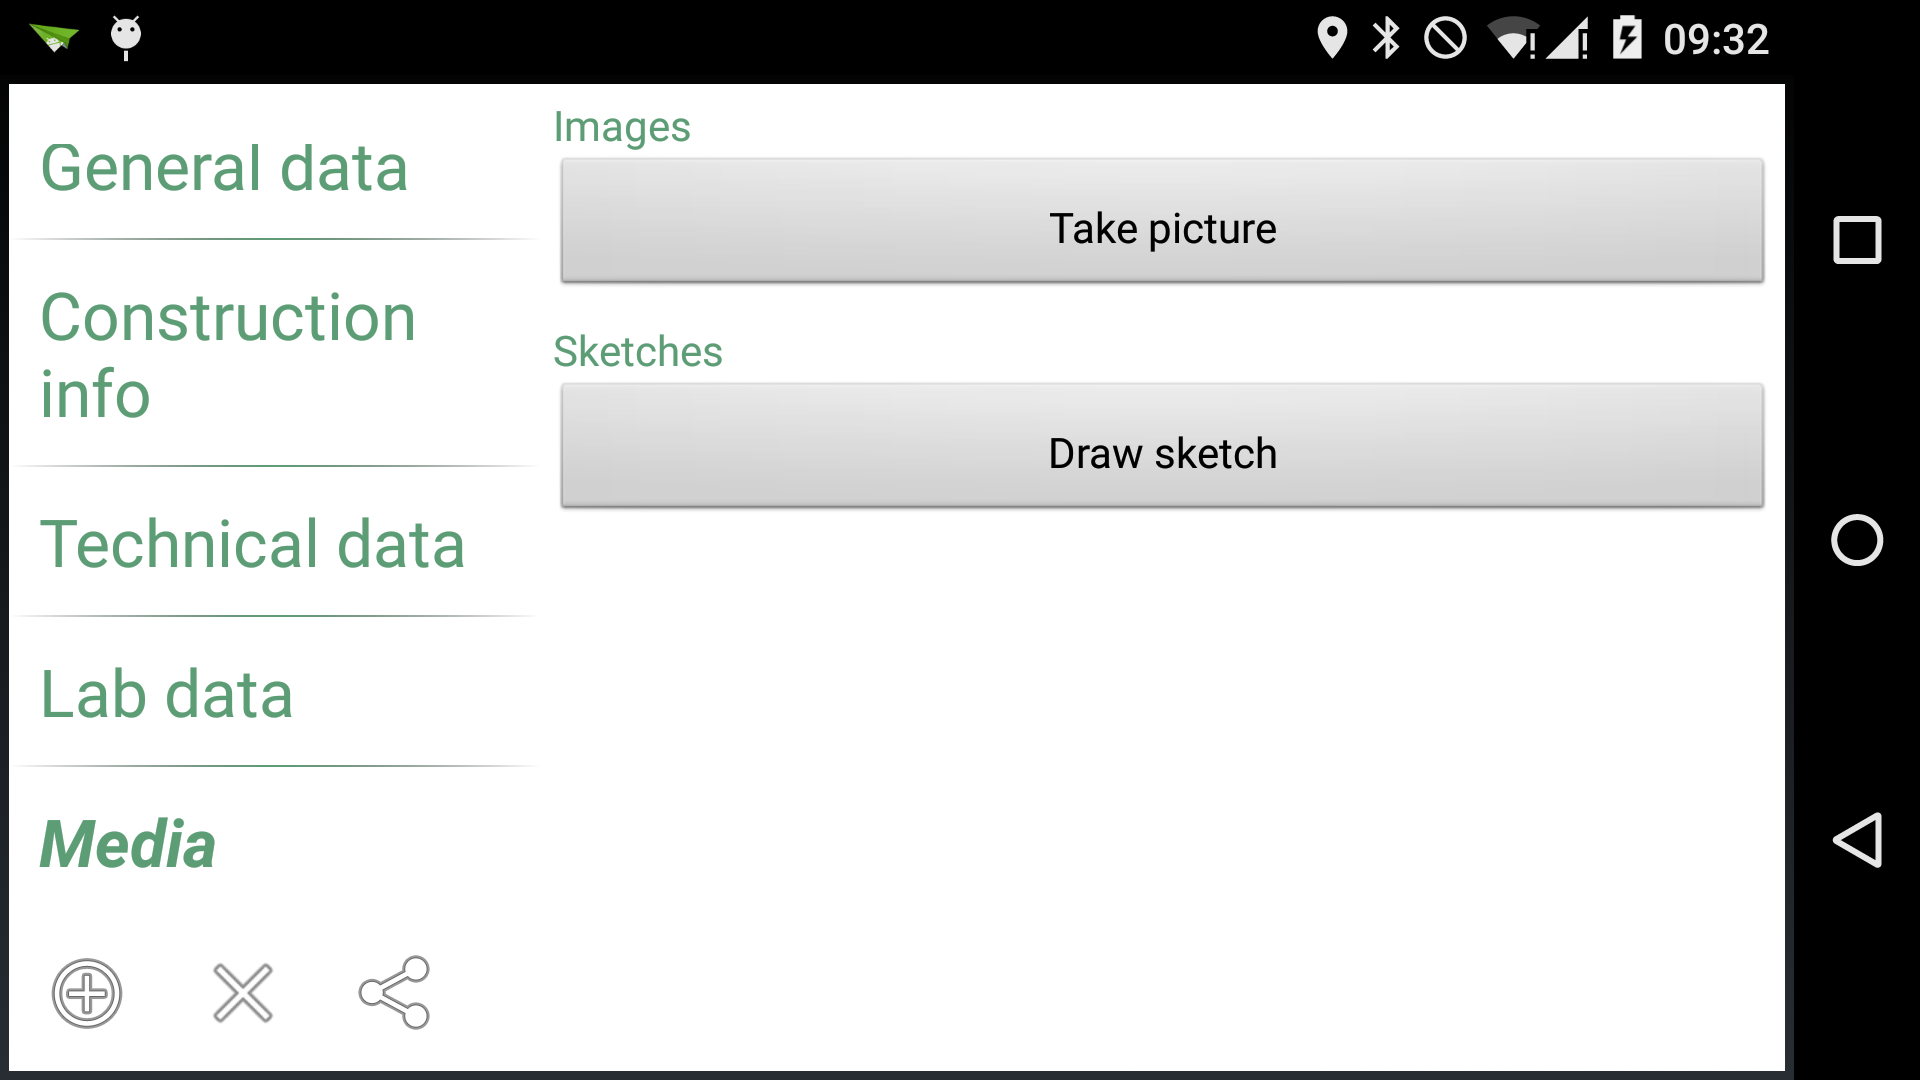
The complete tags.json file can be found in the appendix section.
16.4. Acknowledgement
This usecase is a very small and superficial extract of the Geopaparazzi related part from the master thesis of Vania Zillante: ANALISI DI TECNOLOGIE PER LA DEPURAZIONE DEI REFLUI DOMESTICI IN COMUNITÀ DECENTRATE DEL DELTA DEL NILO E PROPOSTA PER IL TRATTAMENTO DELLA FRAZIONE ORGANICA. APPLICAZIONE DI UN SOFTWARE OPEN SOURCE PER LA GEOREFERENZIAZIONE DEGLI IMPIANTI ESISTENTI..
Focus has been put only on the data collection and form creation. It is beyond the scope of this document to describe or comment any other of the contents of Vania’s thesis.
Vania’s thesis also won the scolarship prize by ABL Premio Giovanni Lorenzin.
17. Projects that base on Geopaparazzi
17.1. gvSIG Mobile
gvSIG Mobile is completely based on geopaparazzi and extends its capabilities with enterprise level functionalities to connect to the services of gvSIG Online to allow synchronization of data between teams of surveyors.
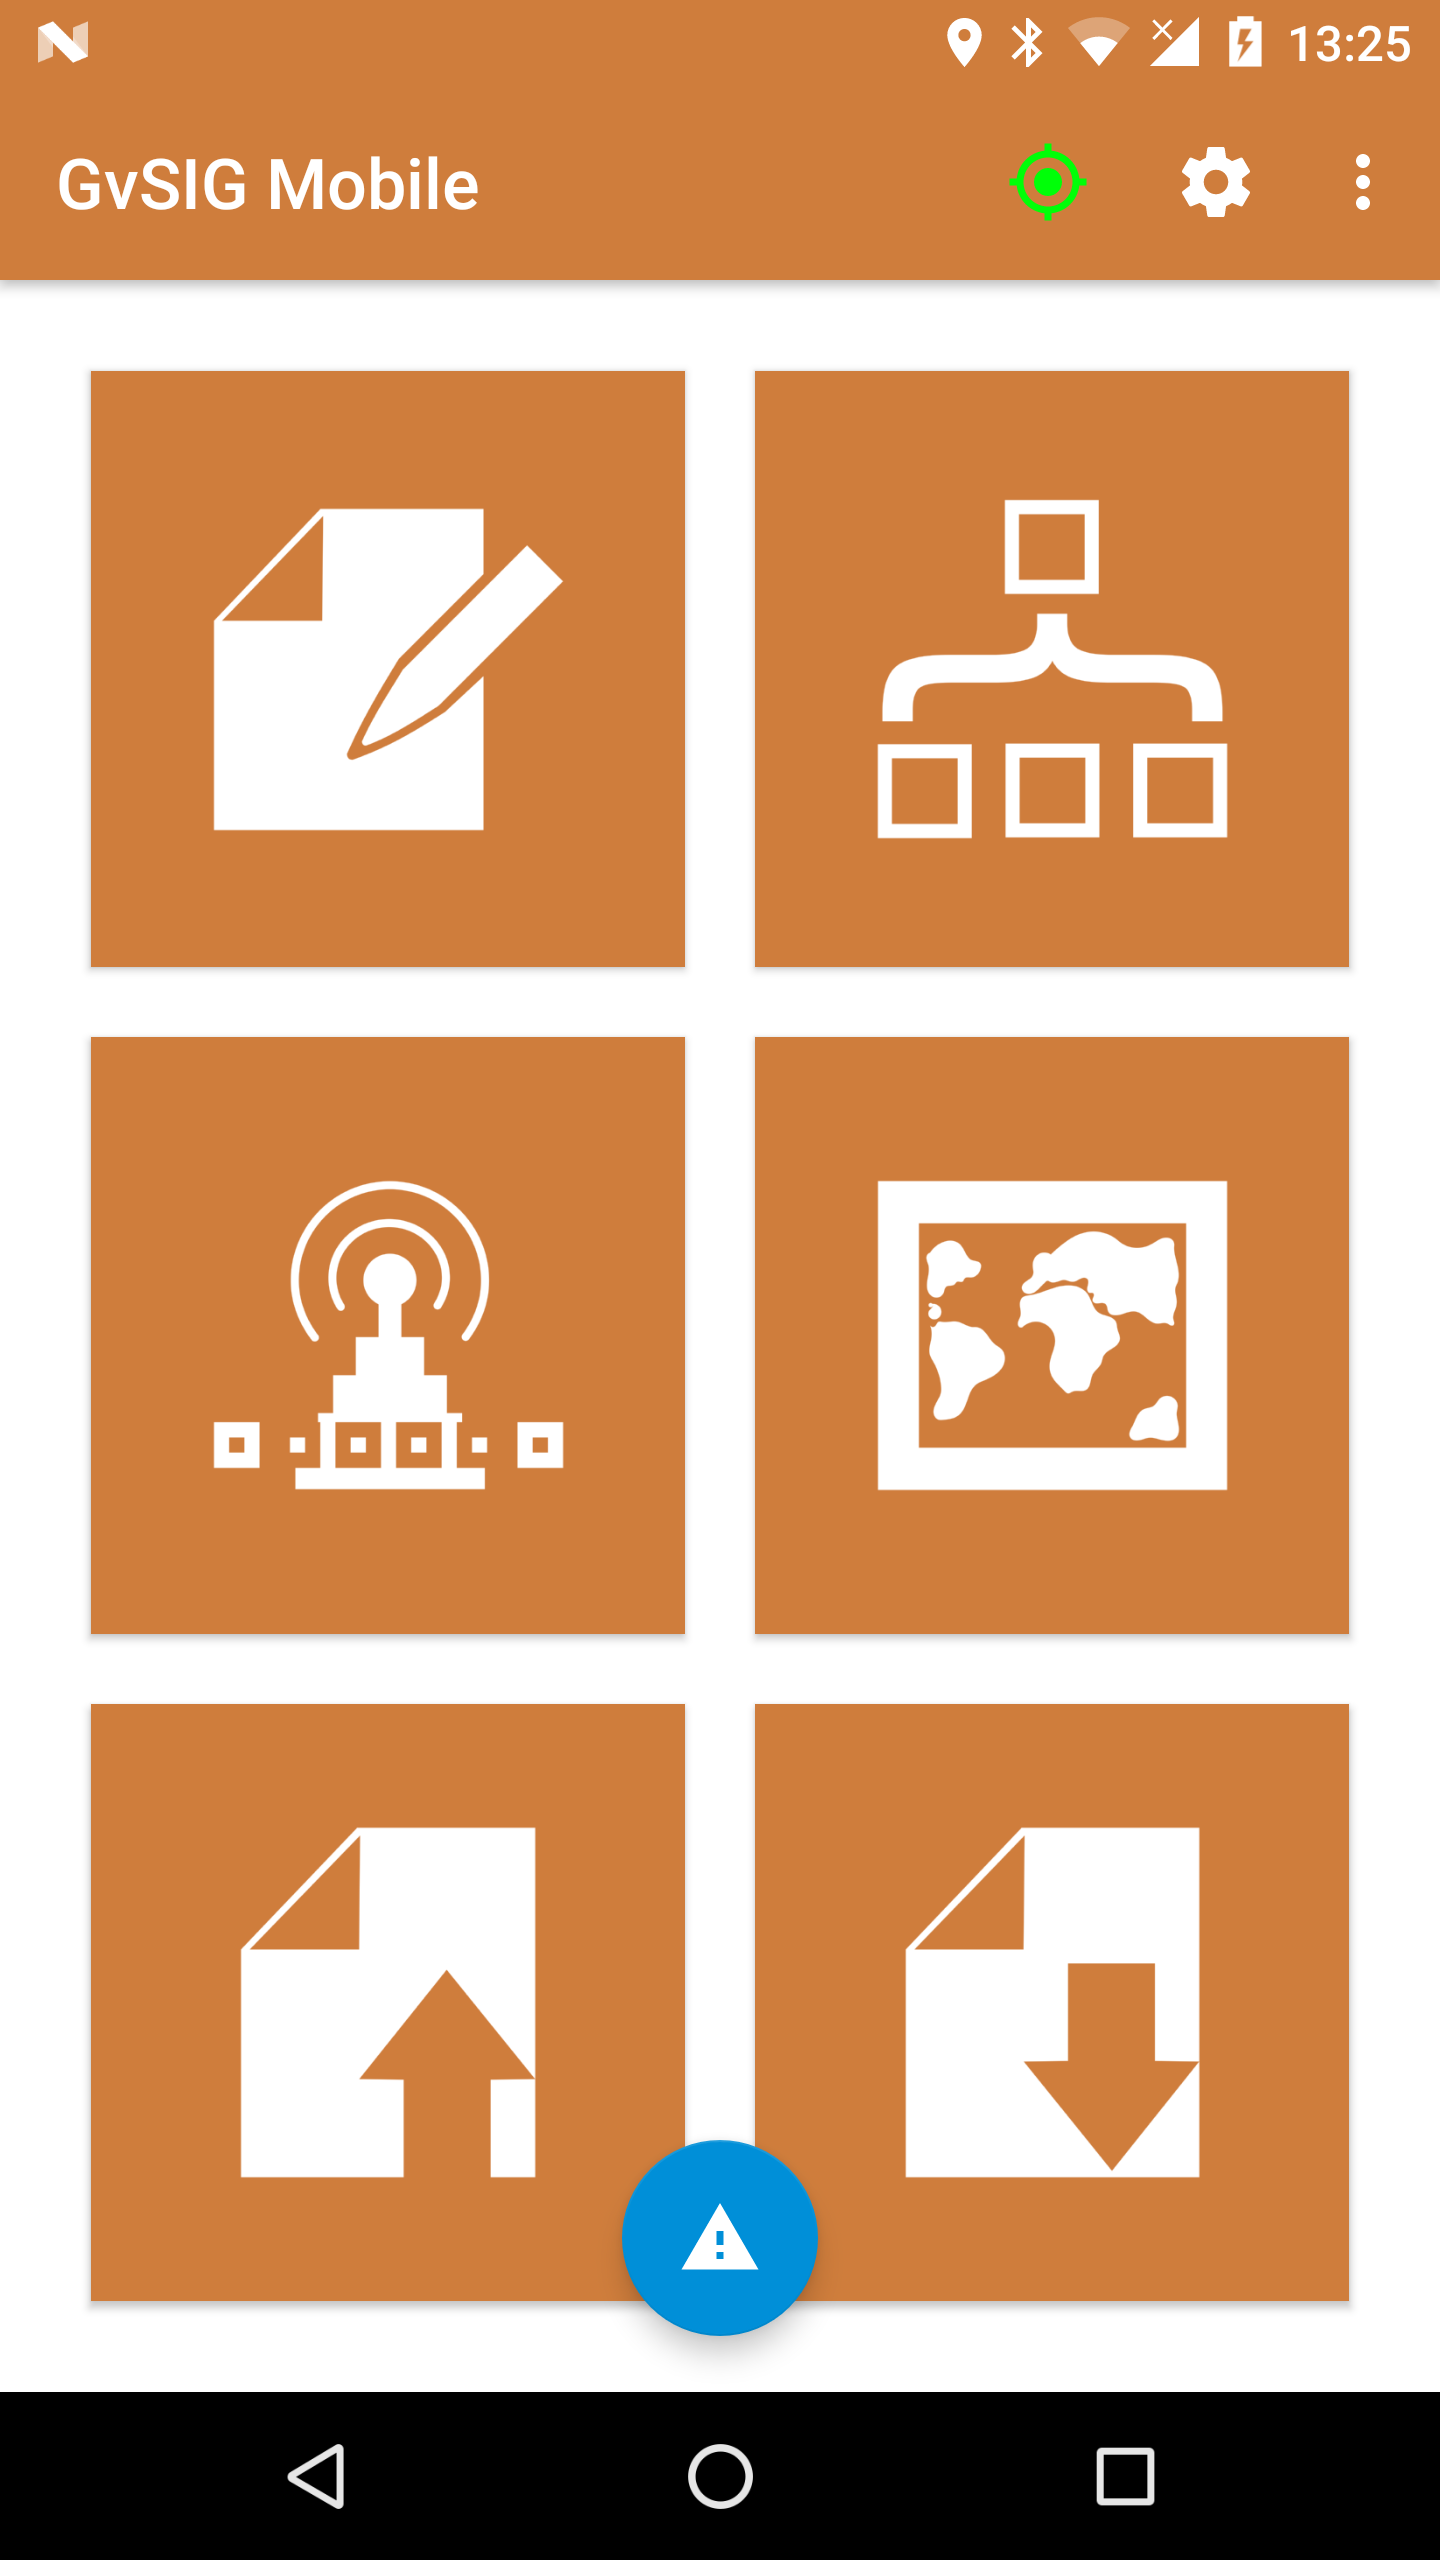
17.2. Geomobi
Geomobi is a mobile GIS developed by team developer of Embasa (Empresa Baiana de Águas e Saneamento of State Bahia Brazil). The mobile app has maps with streets, water consumers, water supply network, and sewer network layers. These maps can be used in field services for various queries.
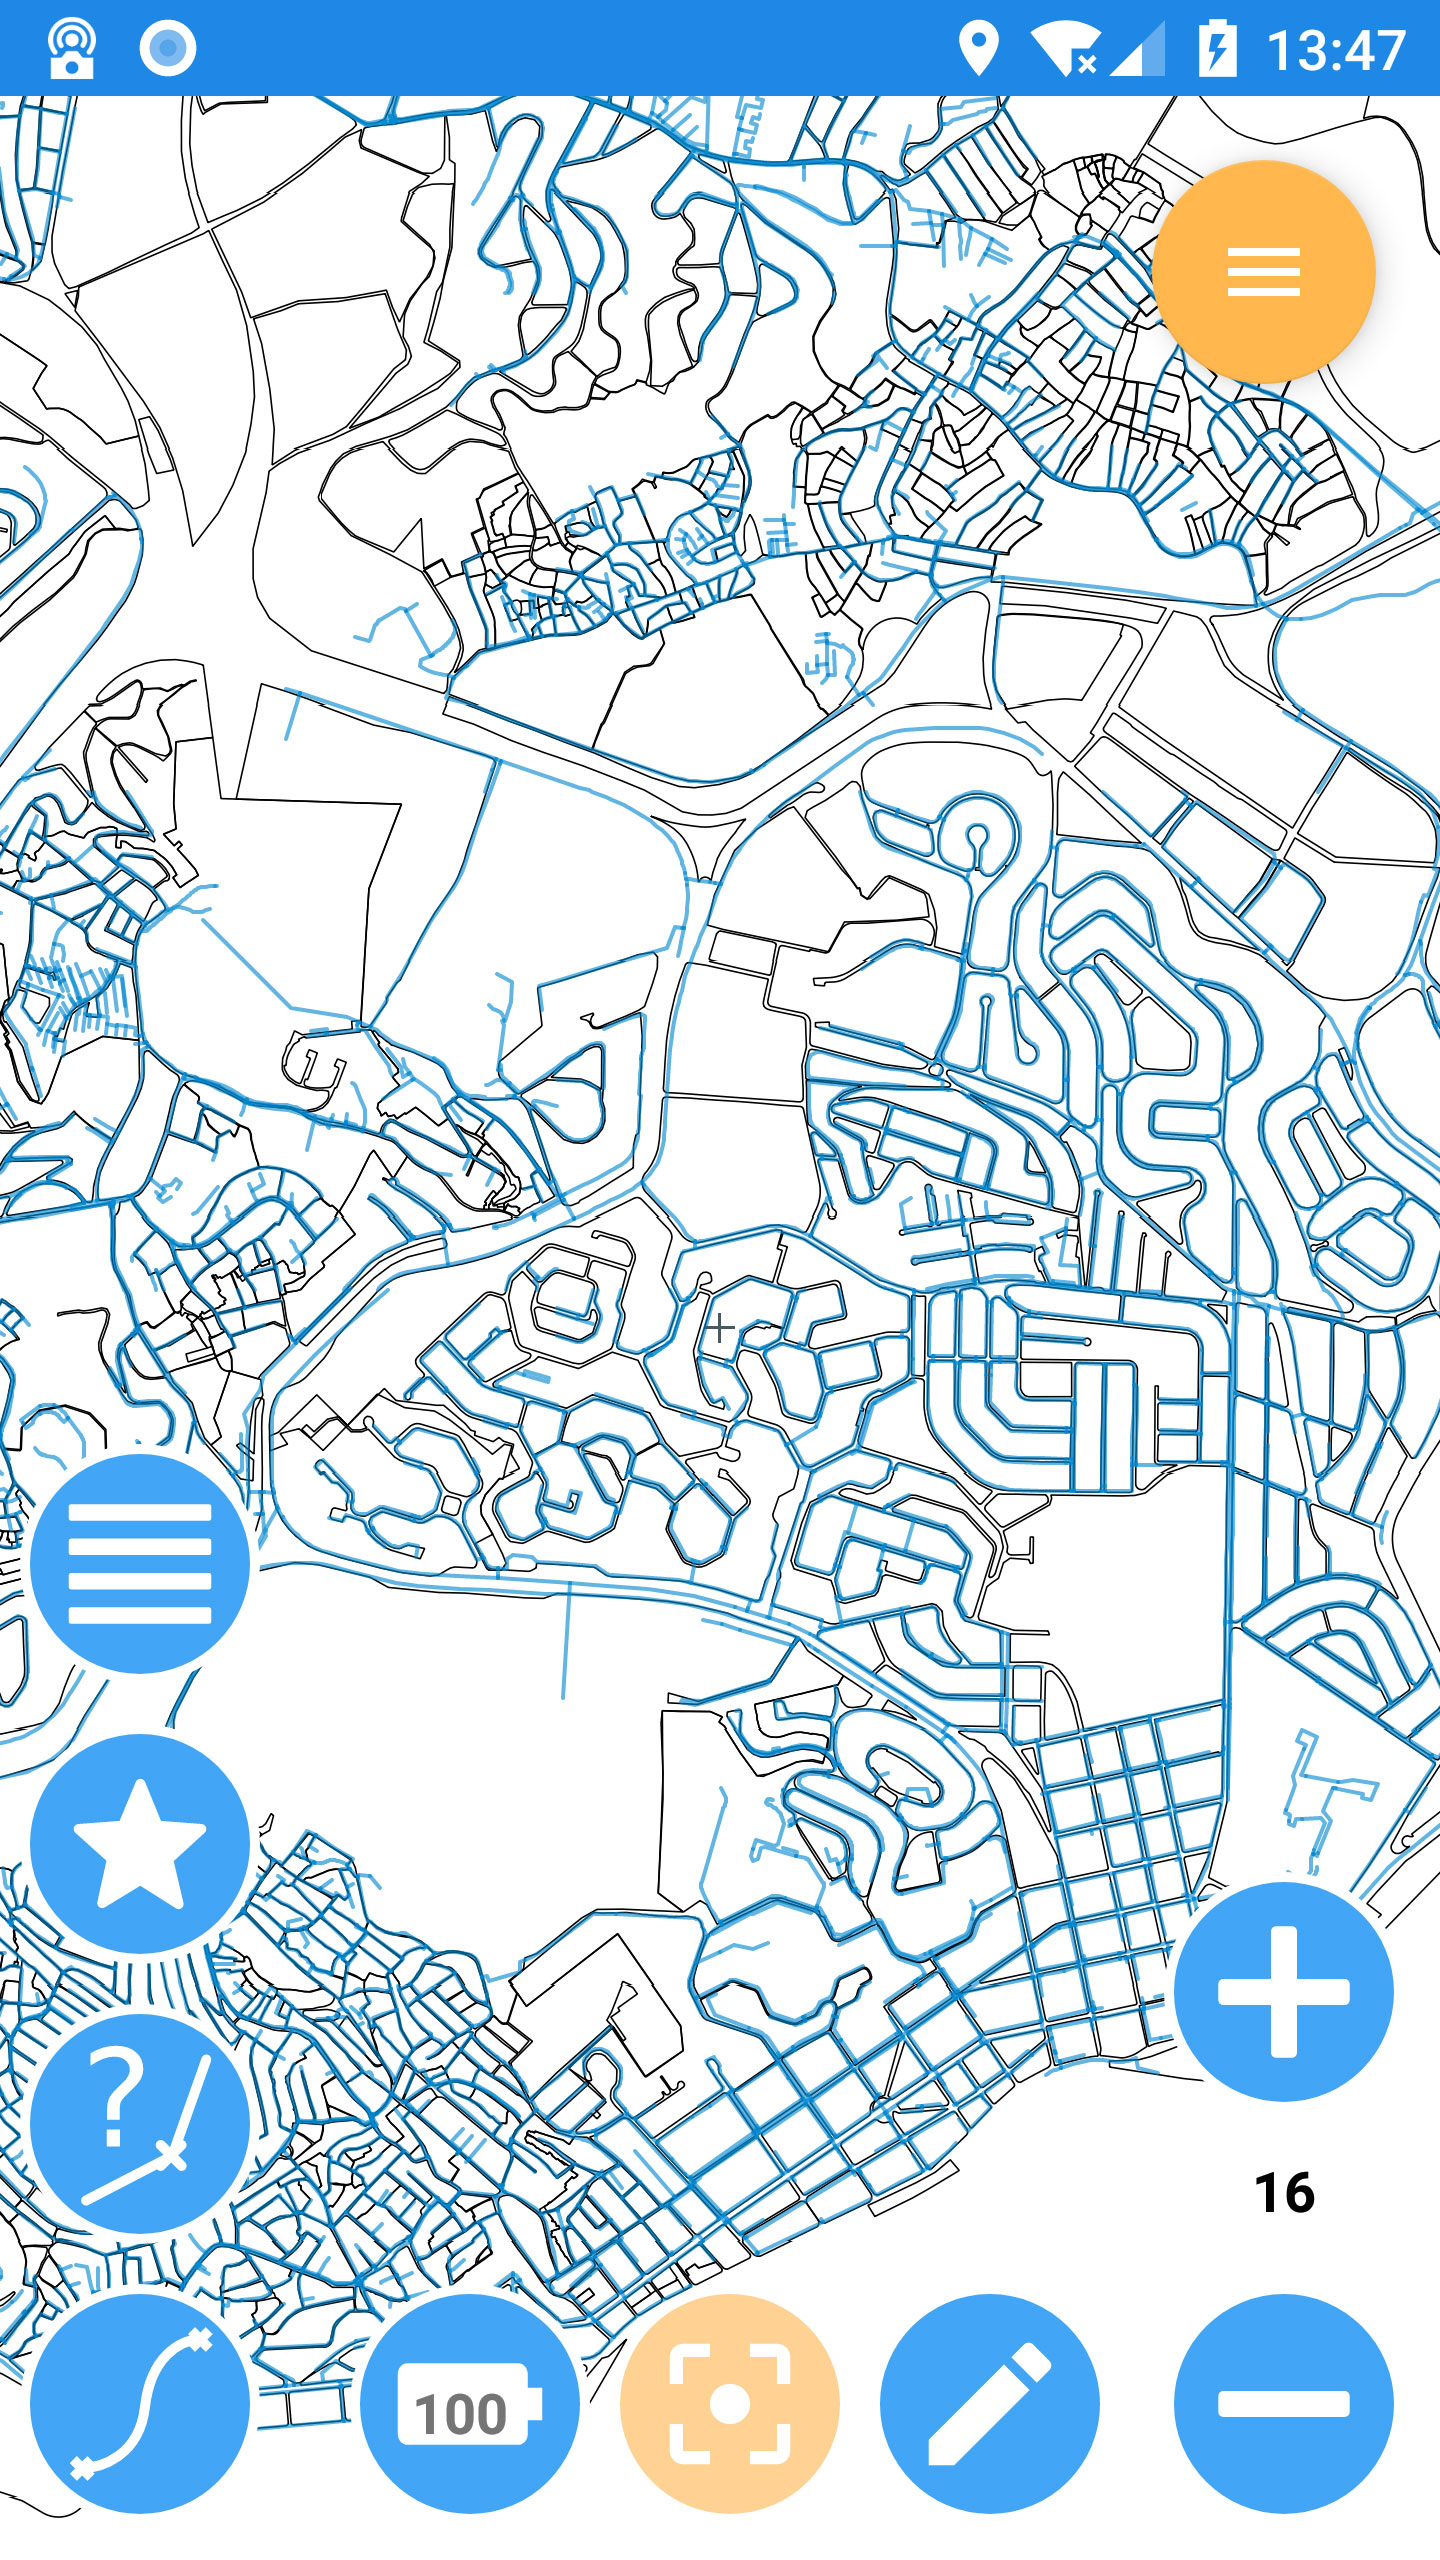
17.3. Gasdroide - Natural Gas Emission Flux Measurements on Android platform
Checkout the homepage here
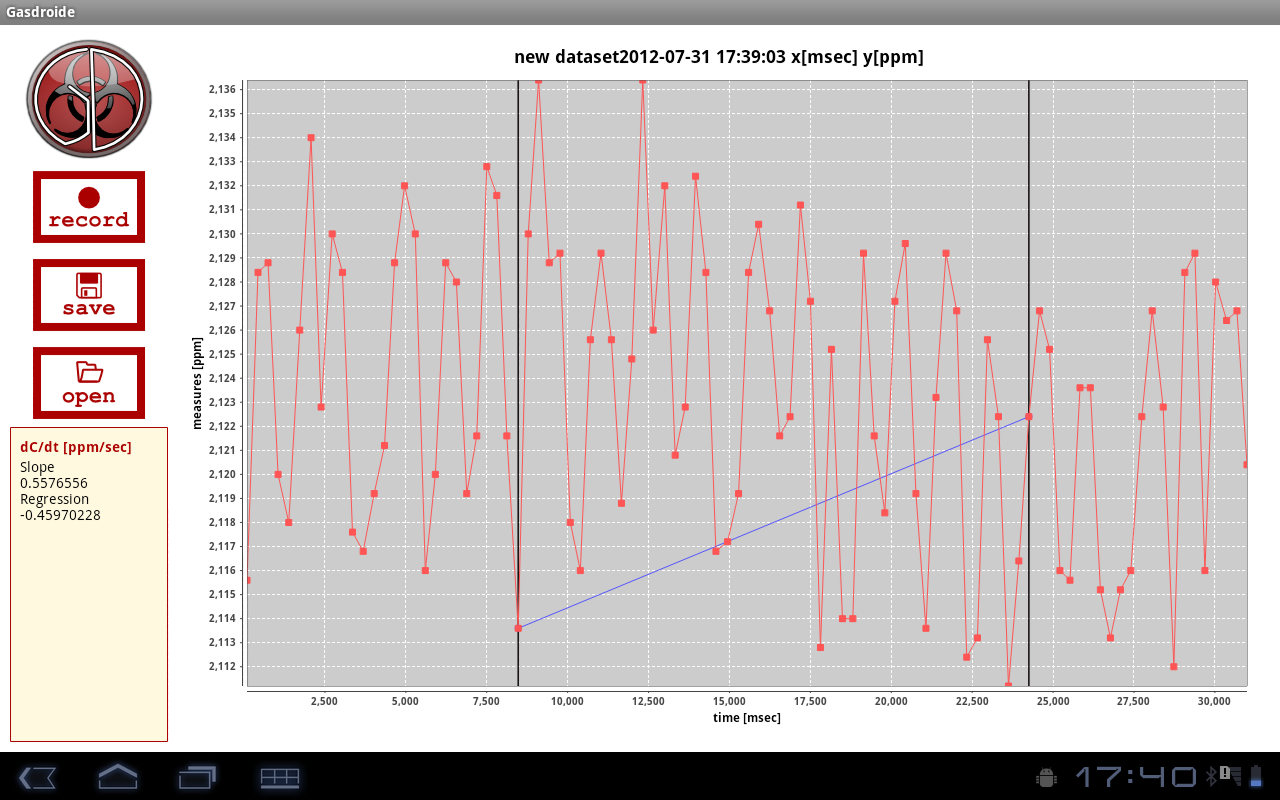
17.4. Disaster Management Information System
The Disaster Management Information System of the city of Osaka is mainly meant for collecting information about water-supply infrastructure to promote post-disaster recovery for water supply.
The same team has also been responsible for the Japanese translation of Geopaparazzi. Kudos!
17.4.1. TrashMapper
The TrashMapper is a tool used to keep information about the waste management of a town. Through it it is possible to sample and update information out in the field and then syncronize the data with a central database/webgis.
17.4.2. Trackoid
Trackoid is a mobile system for the geolocalization of small/medium fleets and teams of people (rescue). It is a realtime system with a mobile and server side.
trackoid mobile
trackoid server
17.4.3. Your app here
If you are using Geopaparazzi in any flavor we would be happy to list it here with some screenshot. Just drop us a note!
18. A small handbook for developers
18.1. Introduction
18.1.1. Getting the code
The whole source code of the Geopaparazzi project is available at its github site.
It can be downloaded into a local git repository with the following command from commandline:
git clone --recursive https://github.com/geopaparazzi/geopaparazzi.git18.1.2. Building and developing Geopaparazzi
The authors suggest to use Android Studio for the build and development of the application.
Geopaparazzi is developed in pure java. The only native C libraries referenced in the project are th elibraries of spatialite. They are contained as libraries and therefore all development is done in pure java. Android currently supports all Java 7 language features and a subset of Java 8 language features that vary by platform version. At the time of writing the Geopaparazzi codebase only uses java 7 languagefeatures.
The project uses gradle as its build tool. The commandline can be used to assemble an installation package:
./gradlew assembleIn the case of building from commandline, it is necessary to insert the keystore informations to sign the installation package in a file named:
geopaparazzi.app/ant.propertiesThe format is the one of a simple key-value properties file:
key.store=/path/to/the/keystore/file
key.store.password=yourpassword
key.alias=youralias
key.alias.password=youraliaspassword
18.2. Description of the Geopaparazzi Architecture
The Geopaparazzi application has been split in different modules, that contain functions that have been isolated.
The root source folder contains the main modules:
While the folders extra, build and gradle are accessory folders, the other folders are all part of the application.
18.2.1. Modules dependencies diagram
The diagram shows the dependencies of the various modules:
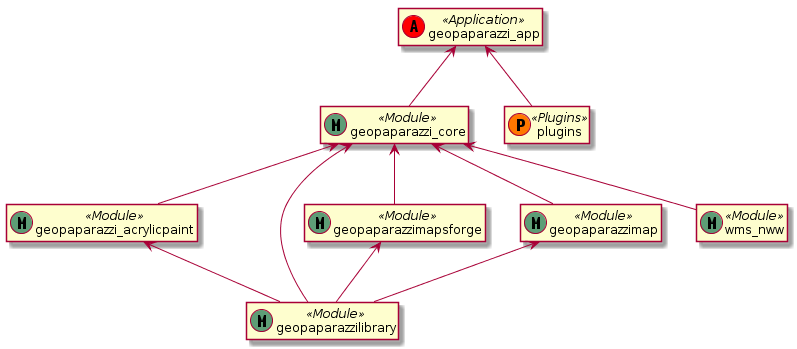

18.2.2. geopaparazzilibrary
The Geopaparazzi Library module contains all the code that can be reused across applications. The different packages contained have been named to explain their content.
Many of the packages are not used in the geopaparazzi application, but have been contributed during several customizations that have been done during the years.
Below a short description of the most important packages:
-
bluetooth: bluetooth pairing and data transfer classes
-
camera: classes for taking pictures
-
chart: charting utilities
-
core: main activities and fragments that can be reused in different contexts
-
database: database helper classes
-
features: classes related to the vector editing engine
-
forms: package containing the form based notes classes
-
gps: the gps service package
-
gps: conversion from and to gpx
-
images: image utilities
-
kml: conversion from and to kml/kmz
-
locale: utilities to handle locale switch
-
network: network related utilities
-
nfc: near field communication package
-
permissions: classes to help with the android >6 permission system
-
plugin: package that contains the plugin engine classes
-
routing: classes that connect to online routing engines
-
sensors: utilities related to motion sensors
-
share: sharing utilities for social network or similar
-
sketch: outdated sketch support. Substituted by acrylicpaint
-
sms: utilities to send or intercept sms
-
style: style support classes
-
util: many utilities classes related to projection, debug, data types and similar
-
webproject: classes that support up/downloading geopaparazzi projects from and to a server
18.2.3. geopaparazzi_core
The core module contains all that is visible in Geopaparazzi. All the activities, views and fragments and all logic behind the user interaction.
This module is very specific to Geopaparazzi and us such contains the structure of the application, its preferences, the map view and database related code.
The main packages are:
-
database: database management classes
-
maptools: tools to work with vector editing
-
mapview: the map view and all its functionalities and overlayes
-
preferences: the preferences system
-
ui: all the core activities and fragments
This module is the visible heart of geopaparazzi. It makes large use of the geopaparazzi libraries as well as the other modules.
18.2.4. geopaparazzi.app
The geopaparazzi.app module has been created to create easily branded versions of Geopaparazzi. It is a thin wrapper around the Geopaparazzi Core module.
In fact it simply extends the core module by defining an empty main activity in its release package (the one then used in google play for example):
public class GeopaparazziActivity extends GeopaparazziCoreActivity {
}
By doing this it is simple to change the style (speak color and appearence) and the name of the application by just changing/extending the xml files in the resources folder.
18.2.5. geopaparazzimapsforge
Mapsforge is the mapping engine used in Geopaparazzi. While the project is going towards the release of version 0.8.0 at the current time, Geopaparazzi still bases on a customized version of the 0.3.1 version of mapsforge. The reasons for the lack of update is both technical and due to missing resources dedicated to this activity. The upgrade to version 0.8.0 would take a significand amount of time and huge code refactoring.
The module contains also the original mapsforge code on which several bug fixes have been backported and some customizations have been applied by HydroloGIS. As such this module is mandatory to allow Geopaparazzi to work with a map view.
The module also contains:
-
the classes to handle tiles. This means reading and writing of mbtiles, online TMS services through mapurl files.
-
the user interface classes to load mapsforge, mbtile, rasterlite2 and mapurl datasets. These are basically activities to browse the filesystem and load data and keep them ordered in a simple catalog.
18.2.6. geopaparazzispatialitelibrary
The Spatialite Library module contains several important pieces necessary to the main application.
As the name already describes, the spatialite vector part is handled in this module. It contains all the classes that define spatial tables and its geometries and attributes.
Data Access Objects are present for the different tabel types, as normal spatialite vector tables but also rasterlite2 and geopackage tables.
The same package also contains activities to browse and select spatialite databases and load them into the map view. Views are also available to change the order of the database layers visualized and change their properties in terms of style and labeling.
The spatialite module contains also 2 very important projects: jsqlite and jts
android-spatialite (jsqlite)
The package jsqlite contains the android-spatialite project, which exposes a simple API to load spatialite extensions and query a spatialite database using spatial queries.
This API is used in geopaparazzi to access any spatialite/rasterlite2 database.
JTS
The Java Topology Suite is a geometric java library very well known in the geospatial world. It could be said, that it is the first and only one used in the open source geospatial business, since the counterpart GEOS, which is used in most of the geospatial applications (gdal, postgis, spatialite), is an almost straight port from the java to the C++ language.
The JTS package in this module has been adapted by HydroloGIS in order to be usable in android. In particular all the AWT related classes have been replaced or removed, depending on the needs.
18.2.7. geopaparazzi_acrylicpaint
Acrylic Paint is the new choice for the drawing of sketches in Geopaparazzi. It is a very nifty and tiny project, well written and maintained in few classes. It makes the perfect fit to be used in Geopaparazzi.
This module contains the original classes of the Acrylic Paint project. They have been customized by HydroloGIS only to answer properly to the intent launched by Geopaparazzi and return the image drawn by the user the way Geopaparazzi needs it. Also teh style has been adapted to be aligned with the one of Geopaparazzi.
18.2.8. wms_nww
The WMS is a standard mapping service and is supported in Geopaparazzi using this module. The module is an adapted code from an older version of the Nasa World Wind Android application. It allows to query the getCapabilities of the Service and list the available layers, which allows th user to easily select a layer to visualize in Geopaparazzi.
Since the original code is releasesd under the Apache License, this module has been kept outside of the Geopaparazzi codebase. That is also the reason the git clone --recursive is necessary when checking out the project’s source code.
18.2.9. plugins
It is now possible to use plugins with Geopaparazzi. They ar enot dynamic plugins that can be installed aside of Geopaparazzi and then loaded into it. But it is possible to compile an custom version of Geopaparazzi with certain plugins enabled.
The official codebase of Geopaparazzi currently uses the plugins for all its import and export options.
Inside the plugins folder, at the time of writing 4 plugins are available:
-
geopaparazzi_default_export_plugins: Contains the export actions (and menu entries of the export view) that take care of bookmarks, gps, images and kmz
-
geopaparazzi_default_import_plugins: Contains the import actions (and menu entries in the import view) that take care of bookmarks, default databases, gps, wms and mapurls
-
geopaparazzi_projects_export_plugins: Contains the export action that allows to upload the current geopaparazzi project to a serverside application
-
geopaparazzi_projects_import_plugins: Contains the import action that allows to list geopaparazzi projects available on a server and then download a selected project to the device
The plugin system is very handy if, for example, it comes to data synchronization. A developer could implement his/her own version of data synchronization with an own servide application and create a set of plugins that take care of it inside geopaparazzi.
That developer could then create a custom build of Geopaparazzi (or whatever the name would be), remove the projects import/export plugins and add instead his/her own. The custom version would then present in the import/export views the new actions to synchronize with the selected server application. This brings to a very smooth integration.
19. Appendix
19.1. The finalized tags.json of the Forms section
[
    {
        "sectionname": "fountain",
        "sectiondescription": "fountain",
        "forms": [
            {
                "formname": "General data",
                "formitems": [
                    {
                        "key": "name",
                        "value": "",
                        "islabel": "true",
                        "type": "string",
                        "mandatory": "yes"
                    },
                    {
                        "key": "street",
                        "value": "",
                        "type": "string",
                        "mandatory": "no"
                    }
                ]
            },
            {
                "formname": "Technical data",
                "formitems": [
                    {
                        "key": "protected",
                        "value": "true",
                        "type": "boolean",
                        "mandatory": "no"
                    },
                    {
                        "key": "type",
                        "values": {
                            "items": [
                                {
                                    "item": ""
                                },
                                {
                                    "item": "manual"
                                },
                                {
                                    "item": "electrical"
                                },
                                {
                                    "item": "gravity"
                                }
                            ]
                        },
                        "value": "manual",
                        "type": "stringcombo",
                        "mandatory": "no"
                    },
                    {
                        "key": "PH",
                        "values": {
                            "items": [
                                {
                                    "item": ""
                                },
                                {
                                    "item": "PH < 5"
                                },
                                {
                                    "item": "5 < PH < 7"
                                },
                                {
                                    "item": "PH > 7"
                                }
                            ]
                        },
                        "value": "PH < 5",
                        "type": "stringcombo",
                        "mandatory": "no"
                    },
                    {
                        "key": "number of served people",
                        "value": "",
                        "type": "double",
                        "mandatory": "no"
                    },
                    {
                        "key": "is working",
                        "value": "true",
                        "type": "boolean",
                        "mandatory": "no"
                    },
                    {
                        "key": "needs",
                        "values": {
                            "items": [
                                {
                                    "item": ""
                                },
                                {
                                    "item": "nothing"
                                },
                                {
                                    "item": "maintainance"
                                },
                                {
                                    "item": "rehabilitation"
                                }
                            ]
                        },
                        "value": "nothing",
                        "type": "stringcombo",
                        "mandatory": "no"
                    }
                ]
            },
            {
                "formname": "Media",
                "formitems": [
                    {
                        "key": "Images",
                        "value": "",
                        "type": "pictures",
                        "mandatory": "no"
                    }
                ]
            }
        ]
    }
]
19.2. Complete tag.json for the Egypt use case
[

    {
        "sectionname": "WWT-plant",
        "sectiondescription": "WWT-plant",
        "forms": [

        {
            "formname": "General data",
            "formitems": [

        {
             "key": "Plant name",
             "value": "El Moufty Plant",
             "islabel": "true",
             "type": "string",
             "mandatory": "yes"
        }
,
        {
             "key": "Local Responsible Admin",
             "value": "Kafr el Sheikh",
             "type": "string",
             "mandatory": "no"
        }
,
        {
             "key": "District",
             "value": "Sidi Salim",
             "type": "string",
             "mandatory": "no"
        }
,
        {
             "key": "Village",
             "value": "El Moufty",
             "type": "string",
             "mandatory": "no"
        }
             ]
        }
,
        {
            "formname": "Construction info",
            "formitems": [

        {
             "key": "WWTP technology",
             "values": {
                 "items": [
                     {"item": ""},
                     {"item": "Stabilization ponds (GTZ model)"}                 ]
             },
             "value": "",
             "type": "stringcombo",
             "mandatory": "no"
        }
,
        {
             "key": "Designed by",
             "value": "Prof M.Abdel Azeem",
             "type": "string",
             "mandatory": "no"
        }
,
        {
             "key": "Year of construction",
             "value": "",
             "type": "date",
             "mandatory": "no"
        }
,
        {
             "key": "Startup",
             "value": "",
             "type": "date",
             "mandatory": "no"
        }
             ]
        }
,
        {
            "formname": "Technical data",
            "formitems": [

        {
             "key": "Served population [inhab]",
             "value": "3000.0",
             "type": "double",
             "mandatory": "no"
        }
,
        {
             "key": "Plant capacity [m3/d]",
             "value": "450.0",
             "type": "double",
             "mandatory": "no"
        }
,
        {
             "key": "Surface [m2]",
             "value": "6000.0",
             "type": "double",
             "mandatory": "no"
        }
,
        {
             "key": "Pro capita inflow [m3/inhab d]",
             "value": "0.066",
             "type": "double",
             "mandatory": "no"
        }
,
        {
             "key": "Pro capita water use [l/inhab d]",
             "value": "111.0",
             "type": "double",
             "mandatory": "no"
        }
,
        {
             "key": "Inflow [m3/d]",
             "value": "200.0",
             "type": "double",
             "mandatory": "no"
        }
,
        {
             "key": "Outflow quality analysis",
             "values": {
                 "items": [
                     {"item": ""},
                     {"item": "monthly"},
                     {"item": "yearly"}                 ]
             },
             "value": "",
             "type": "stringcombo",
             "mandatory": "no"
        }
             ]
        }
,
        {
            "formname": "Lab data",
            "formitems": [

        {
             "key": "PH",
             "values": {
                 "items": [
                     {"item": ""},
                     {"item": "PH < 5"},
                     {"item": "5 < PH < 7"},
                     {"item": "PH > 7"}                 ]
             },
             "value": "PH < 5",
             "type": "stringcombo",
             "mandatory": "no"
        }
,
        {
             "key": "BOD in [mg/l]",
             "value": "",
             "type": "double",
             "mandatory": "no"
        }
,
        {
             "key": "BOD out [mg/l]",
             "value": "",
             "type": "double",
             "mandatory": "no"
        }
,
        {
             "key": "Coliforms in [mg/l]",
             "value": "",
             "type": "double",
             "mandatory": "no"
        }
,
        {
             "key": "Coliforms out [mg/l]",
             "value": "",
             "type": "double",
             "mandatory": "no"
        }
,
        {
             "key": "COD in [mg/l]",
             "value": "",
             "type": "double",
             "mandatory": "no"
        }
,
        {
             "key": "COD out [mg/l]",
             "value": "",
             "type": "double",
             "mandatory": "no"
        }
,
        {
             "key": "Suspended solids in [mg/l]",
             "value": "",
             "type": "double",
             "mandatory": "no"
        }
,
        {
             "key": "Suspended solids out [mg/l]",
             "value": "",
             "type": "double",
             "mandatory": "no"
        }
             ]
        }
         ]
    }
]