1. SMASH, the free and open source digital field mapping for IOS and Android
| If you are looking for the source code for the software of this project, jump right to this link. |
SMASH is a digital field mapping application developed to perform fast qualitative engineering/geologic surveys and GIS data collection.
The main aim of SMASH is to have a tool that:
-
is open source and works both on IOS and Android
-
fits in any pocket and can be always at hand, when needed
-
gives the possibility to take geo-referenced and possibly orientated pictures during a survey, with further possibility to import them into GIS applications
-
is able to easily exploit an Internet connection, if available
-
is extremely easy to use and intuitive, providing just few important functions
SMASH on the ipad
The main features available in SMASH are:
-
geo-referenced notes and pictures
-
gps track logging
-
form-based data surveys
-
easy export of collected data
-
a map view for navigation with support for raster and vector data
-
geopackage (OGC standard) support
SMASH on the IPhone.
SMASH on the Android, Pixel 2 XL.
1.1. License
The SMASH source code is licensed under the GNU General Public License, Version 3
1.2. Community
SMASH is stricktly related to the older, more mature and andoird only app Geopaparazzi. For that reason they share the same channels and spaces.
Find out the latest SMASH news.
Join the Geopaparazzi user’s discussion!. Feel free to post also about SMASH.
And there’s a group for Geopaparazzi/SMASH developers too.
You can even contribute to this Geopaparazzi or SMASH manual!
1.3. Need help?
Subscribe to the mailinglist, we are here to help you!
We also have a mailinglist for developers.
1.4. Found bugs?
If you found a bug, please report it in our issue tracker. We will check it and work on it as soon as we can.
1.5. Need features?
If you would like to see new features in SMASH, you have a few ways to get there:
-
develop them yourself and contribute them to the project via pull requests
-
hire someone to do that for you. Get in touch with us.
-
create a new feature request in our issue tracker and wait for someone interested to do it
1.6. Donations
If you find this application useful for your job, please consider to donate to support the development. Donations to this project support the development of the Hortonmachine, Geopaparazzi and SMASH projects.
Thanks for helping to keep this development free and open source.
2. Installation
2.1. IOS
SMASH can be found on the Apple store. Since the word SMASH is used a lot in gaming apps, in order to avoid to have to scroll down many results, it is useful to insert in the search bar the complete name: SMASH Digital field mapping
In that case the right app is the first result in the list, apart of an Ad that in the below case shows a gaming app:
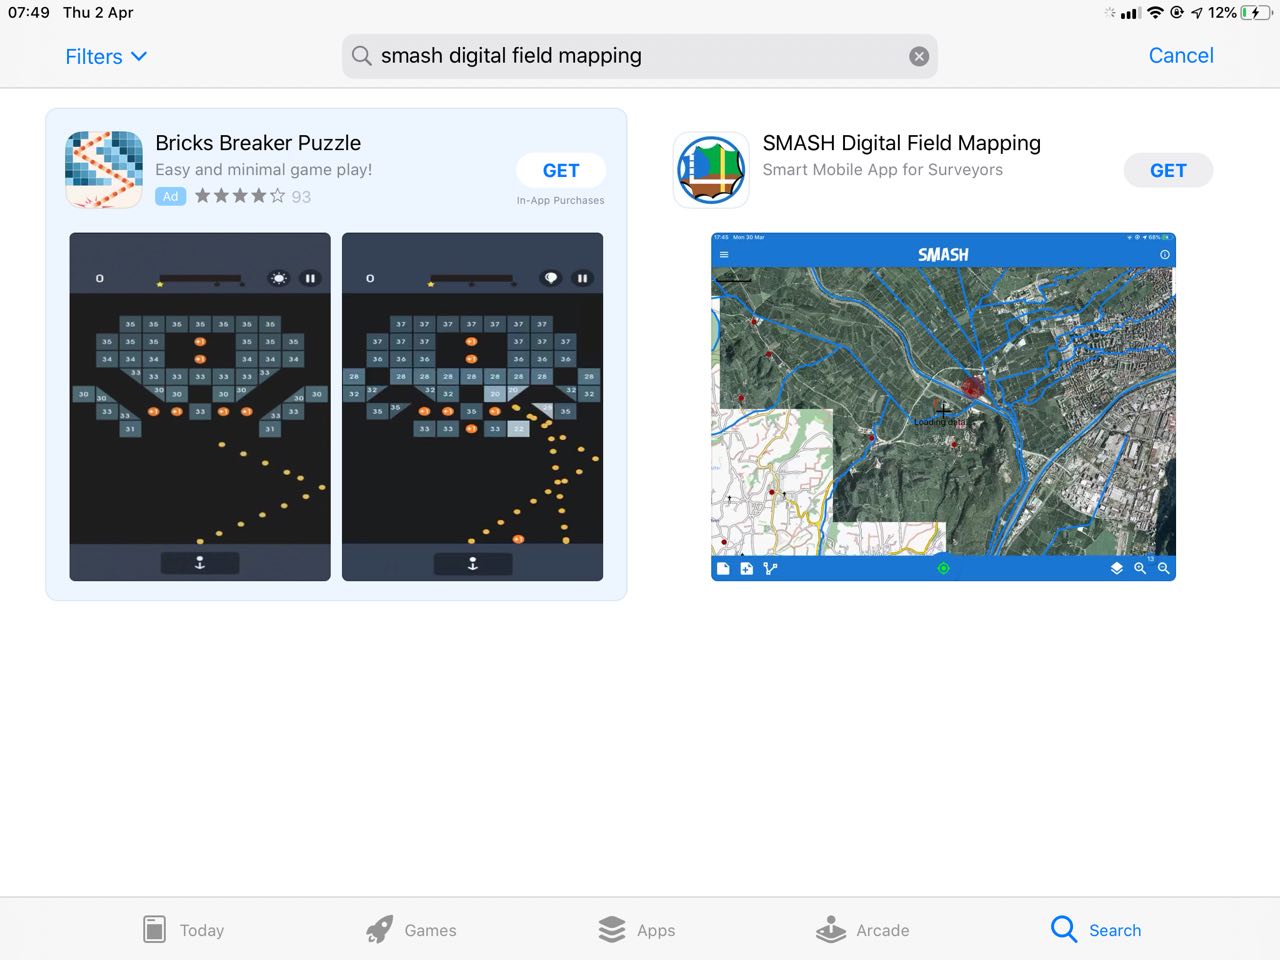
The SMASH entry in the Apple store.
By tapping on it it is possible to find a description and some feature screenshots.
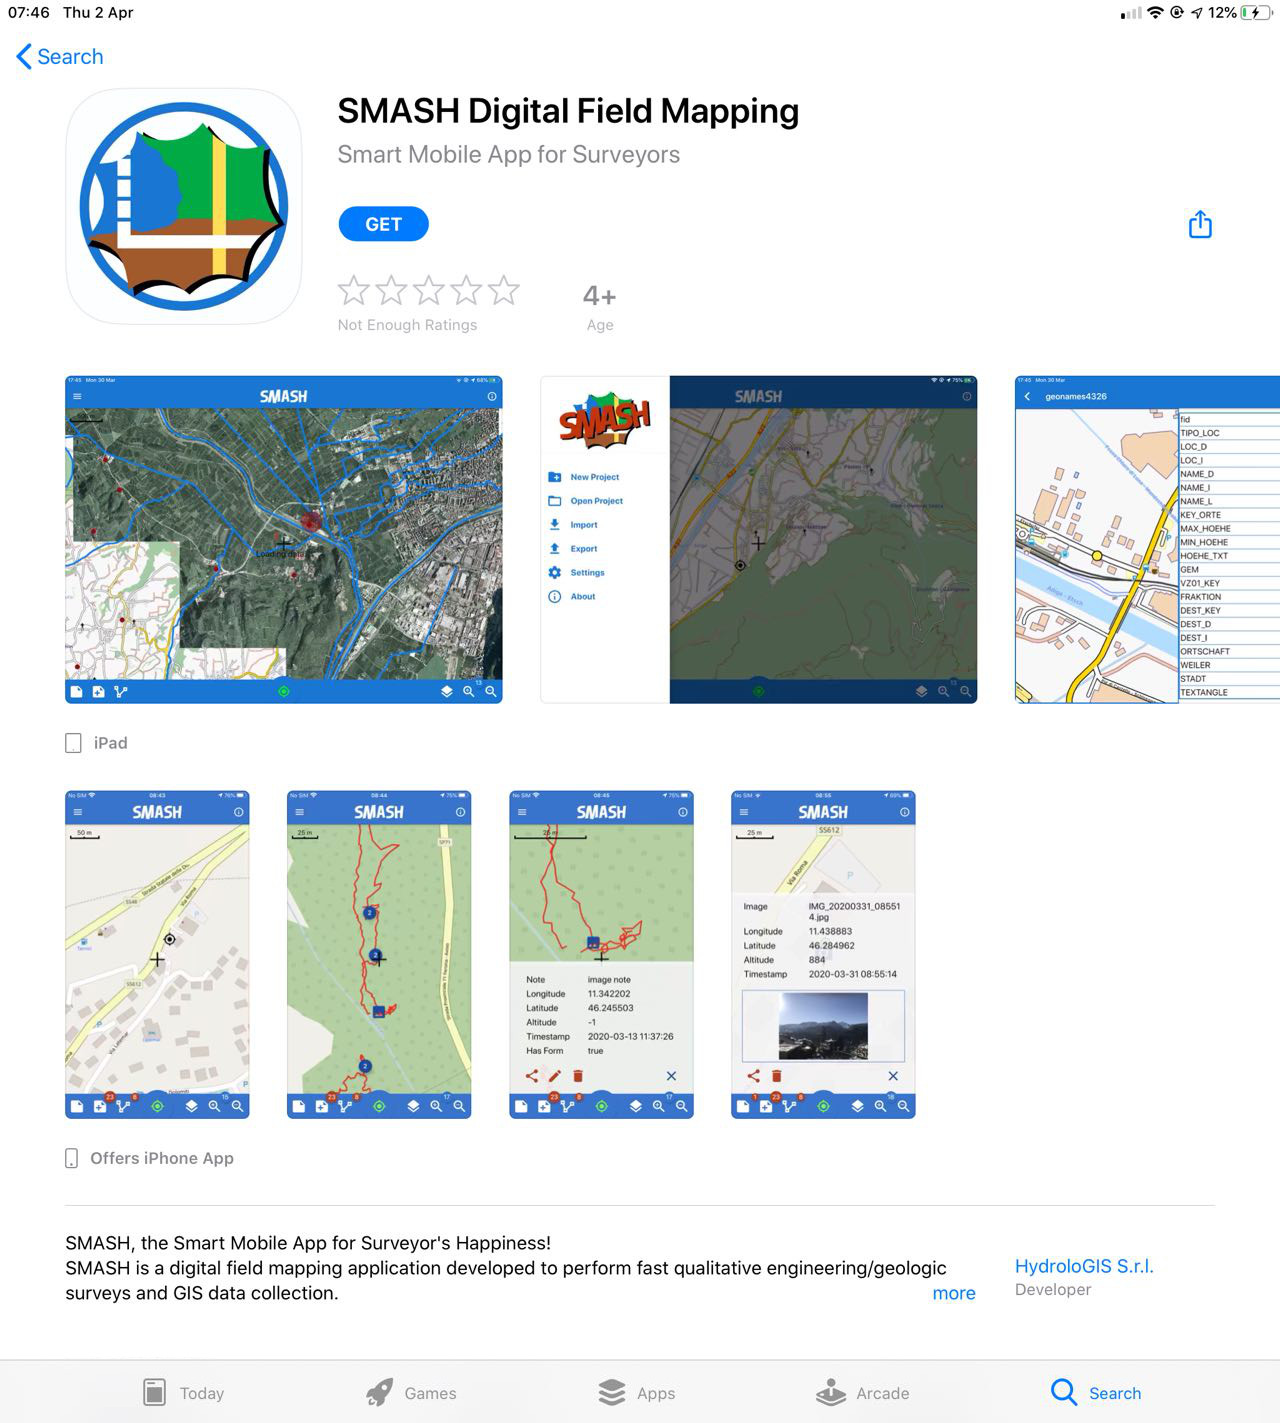
Details of the SMASH app in the Apple store.
To install the app just push the GET button and follow the usual IOS installation instructions.
2.2. Android
2.2.1. From Google Play
SMASH can be found on the Google Play store. Since the word SMASH is used a lot in gaming apps, in order to avoid to have to scroll down many results, it is useful to insert in the search bar the complete name: SMASH field mapping
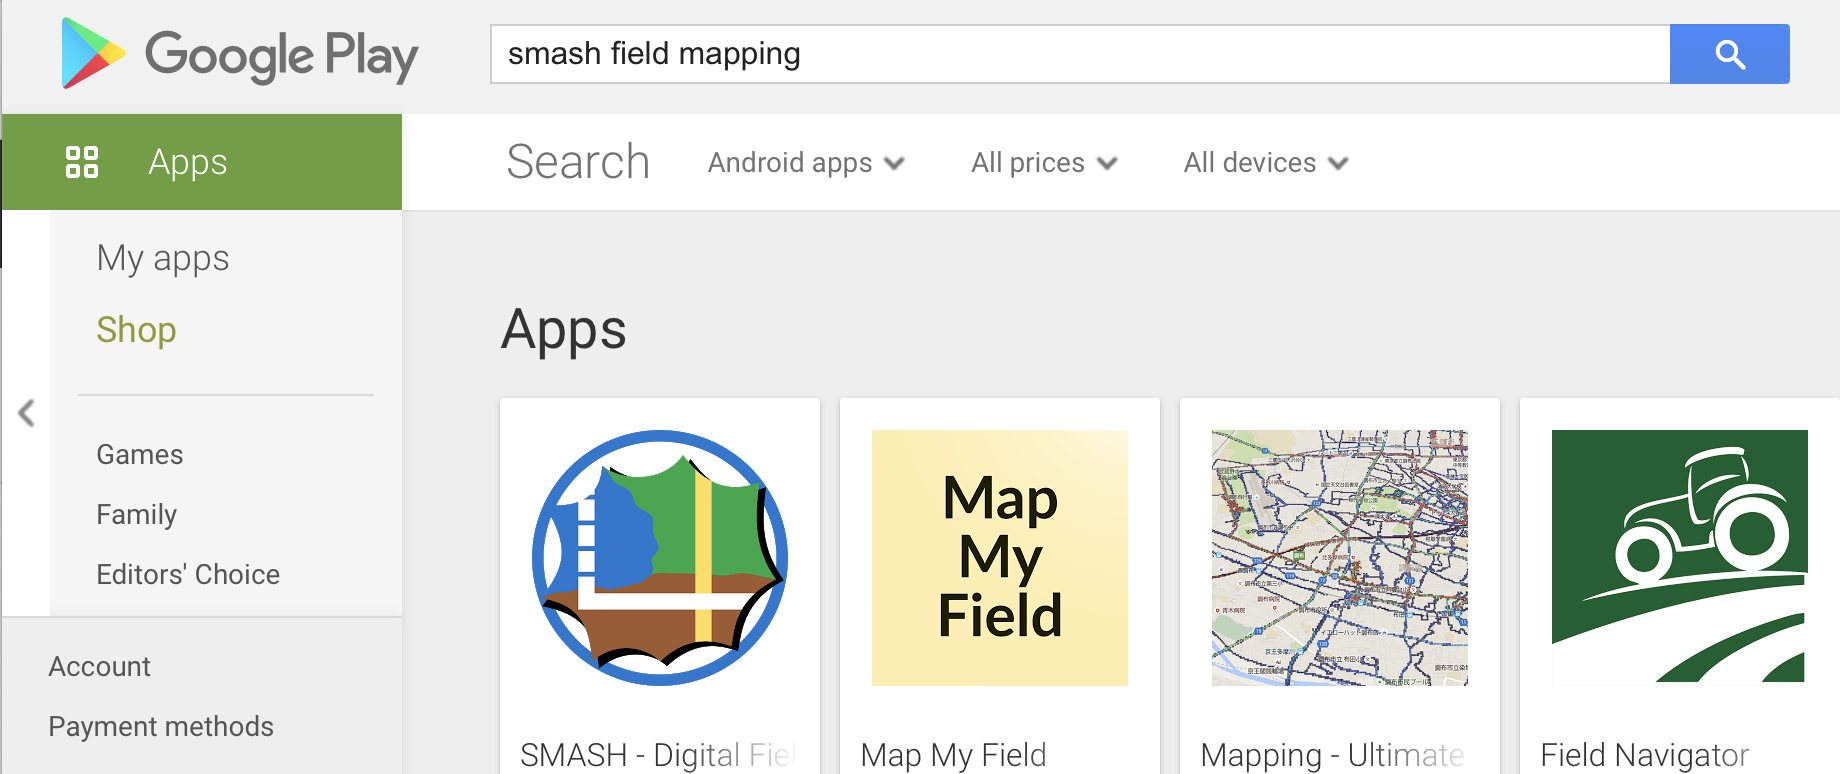
The SMASH entry in the Google Play store.
By tapping on it it is possible to find a description and some feature screenshots.
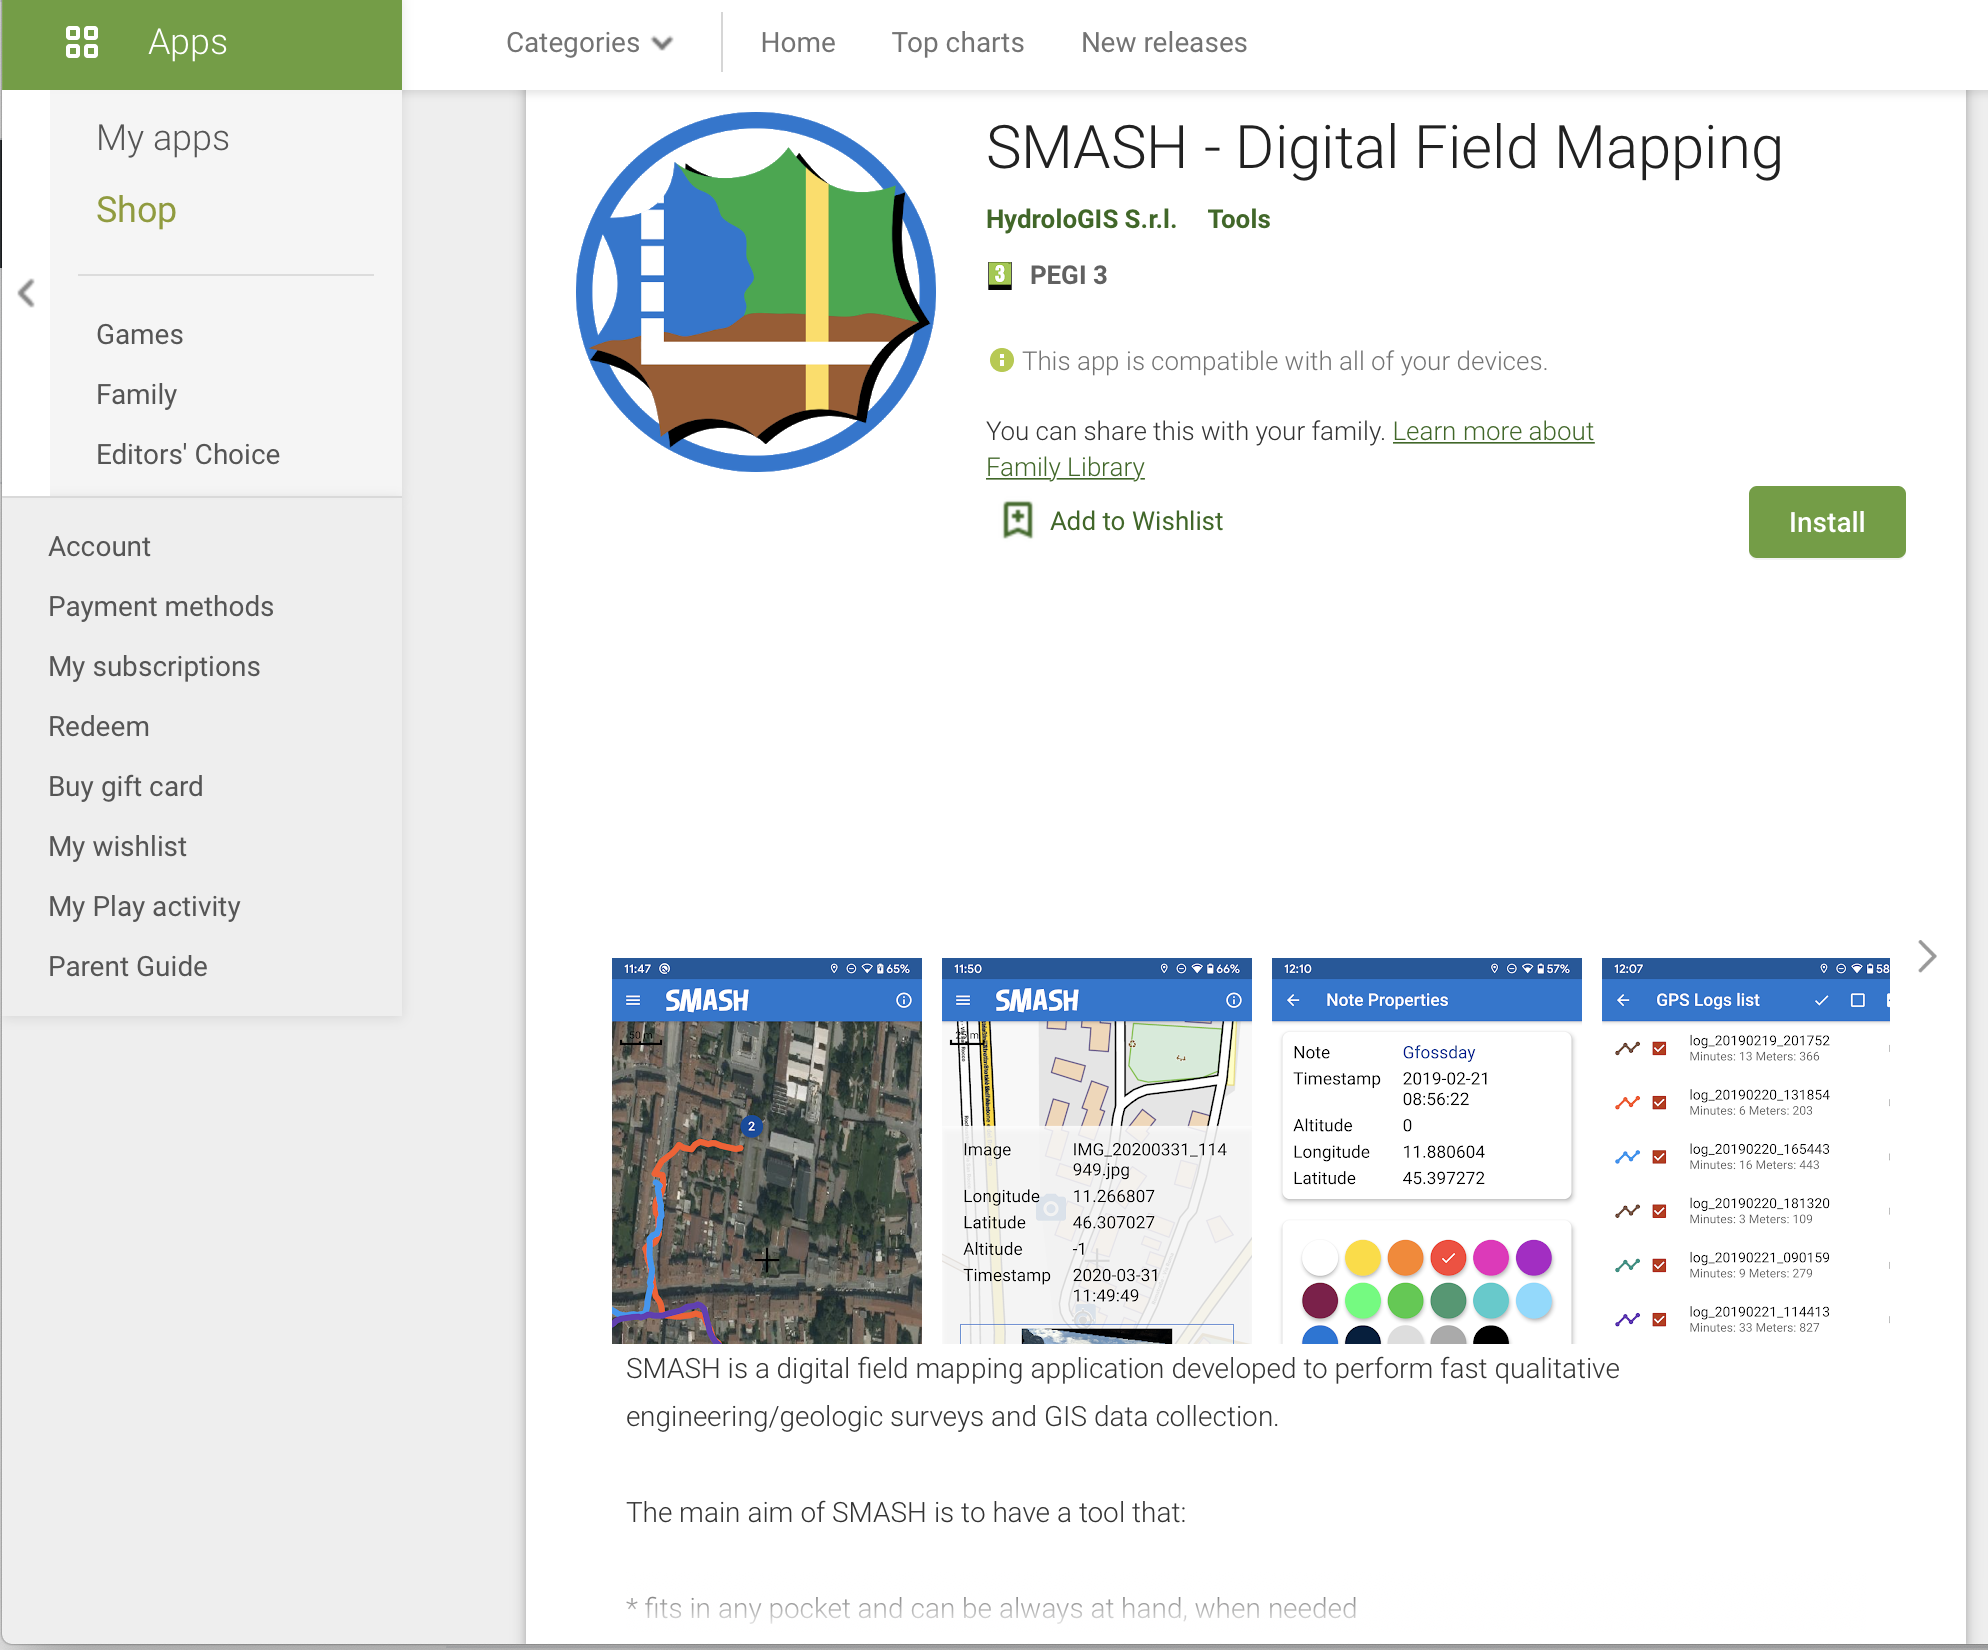
Details of the SMASH app in the Google Play store.
2.2.2. From the main repository
For people that have no access to Google Play, an apk has been paced under the releases page of SMASH. Under the assets section of each release there is also an apk file. That one can be manually installed on Android. Actually, if the link is accessed from within Android, the installation is proposed on clicking the link.
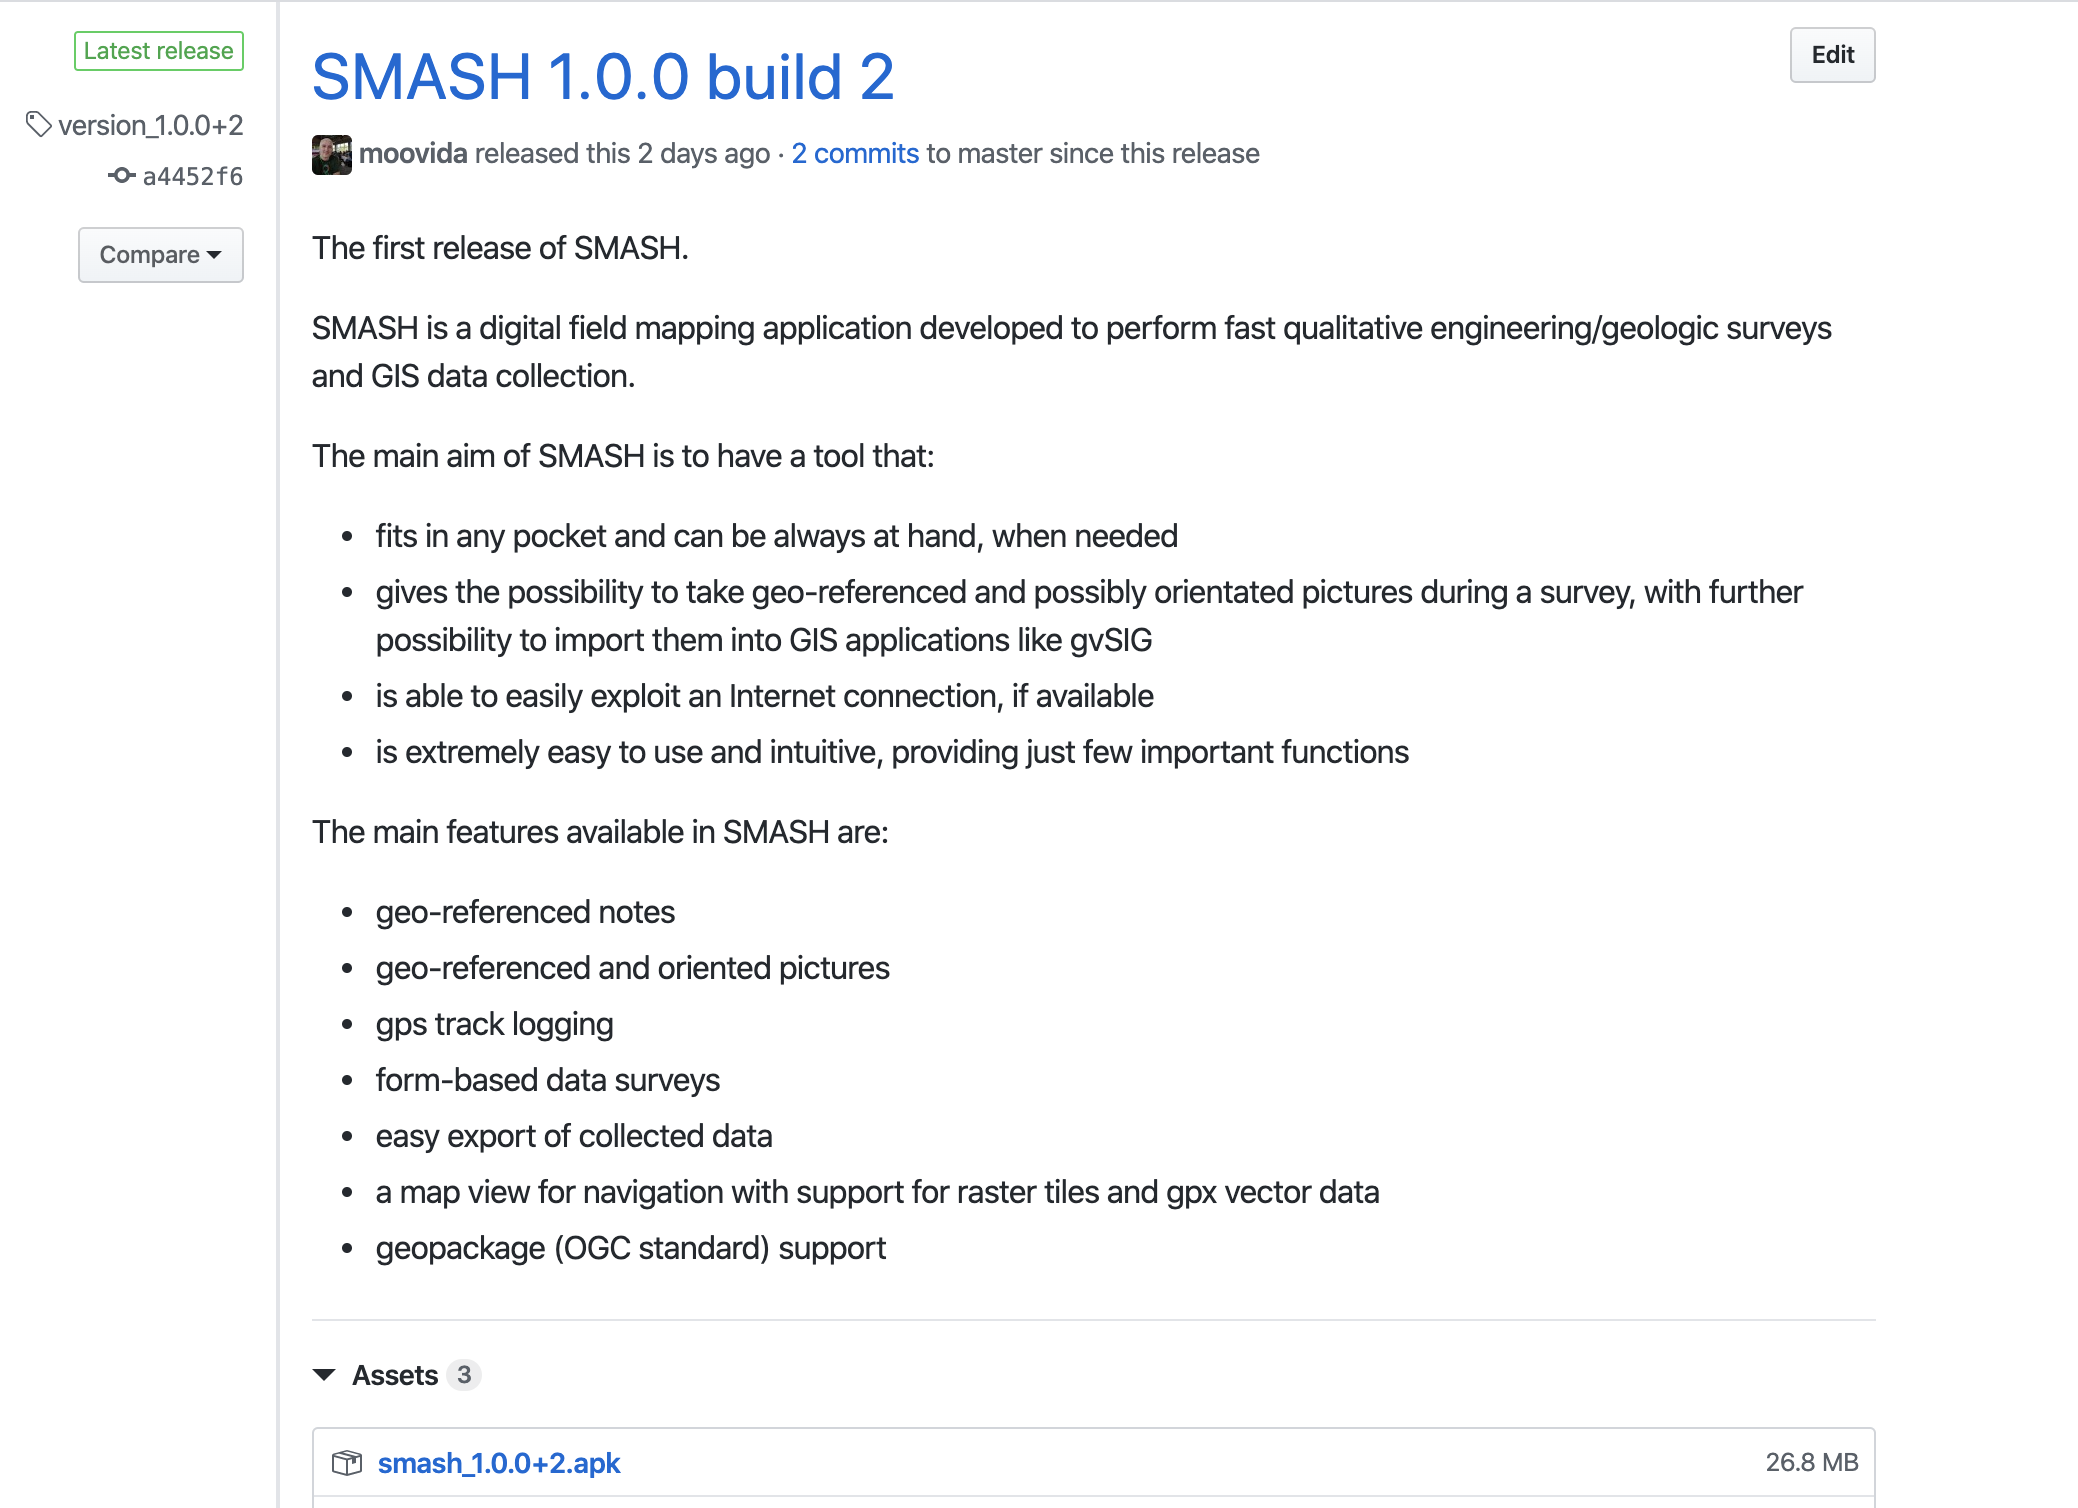
Details of the github release page with the apk to download at the bottom.
3. Launching the app
The first time SMASH is executed a very short overview of the coach markers is run. They can be accessed at any time from the upper right question mark icon:
The selection/creation of the working project at startup.
Once you launch SMASH, the application asks for the possibility to create a new project or open an already existing one. Select the project from your device or define the name of a new one.
If projects have been already opened, a list of recent project will be available for selection.
The selection/creation of the working project at startup.
| SMASH is based on the concept of projects: all the data collected for a project are saved in the same project database file (GPS log, simple notes, images, form notes). |
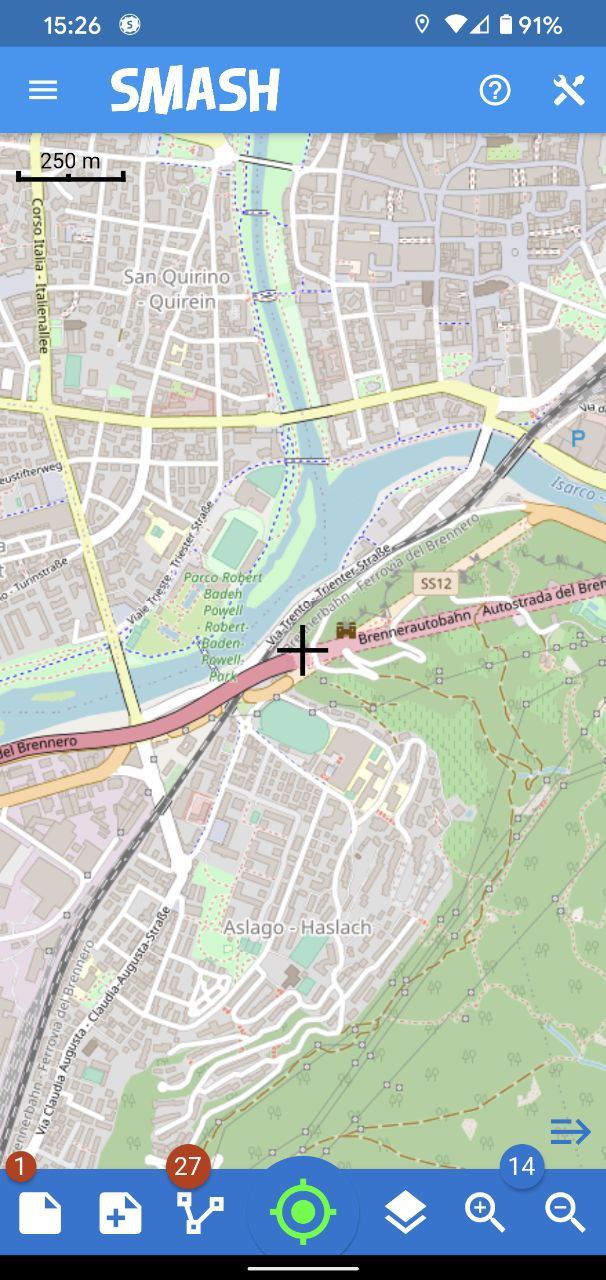
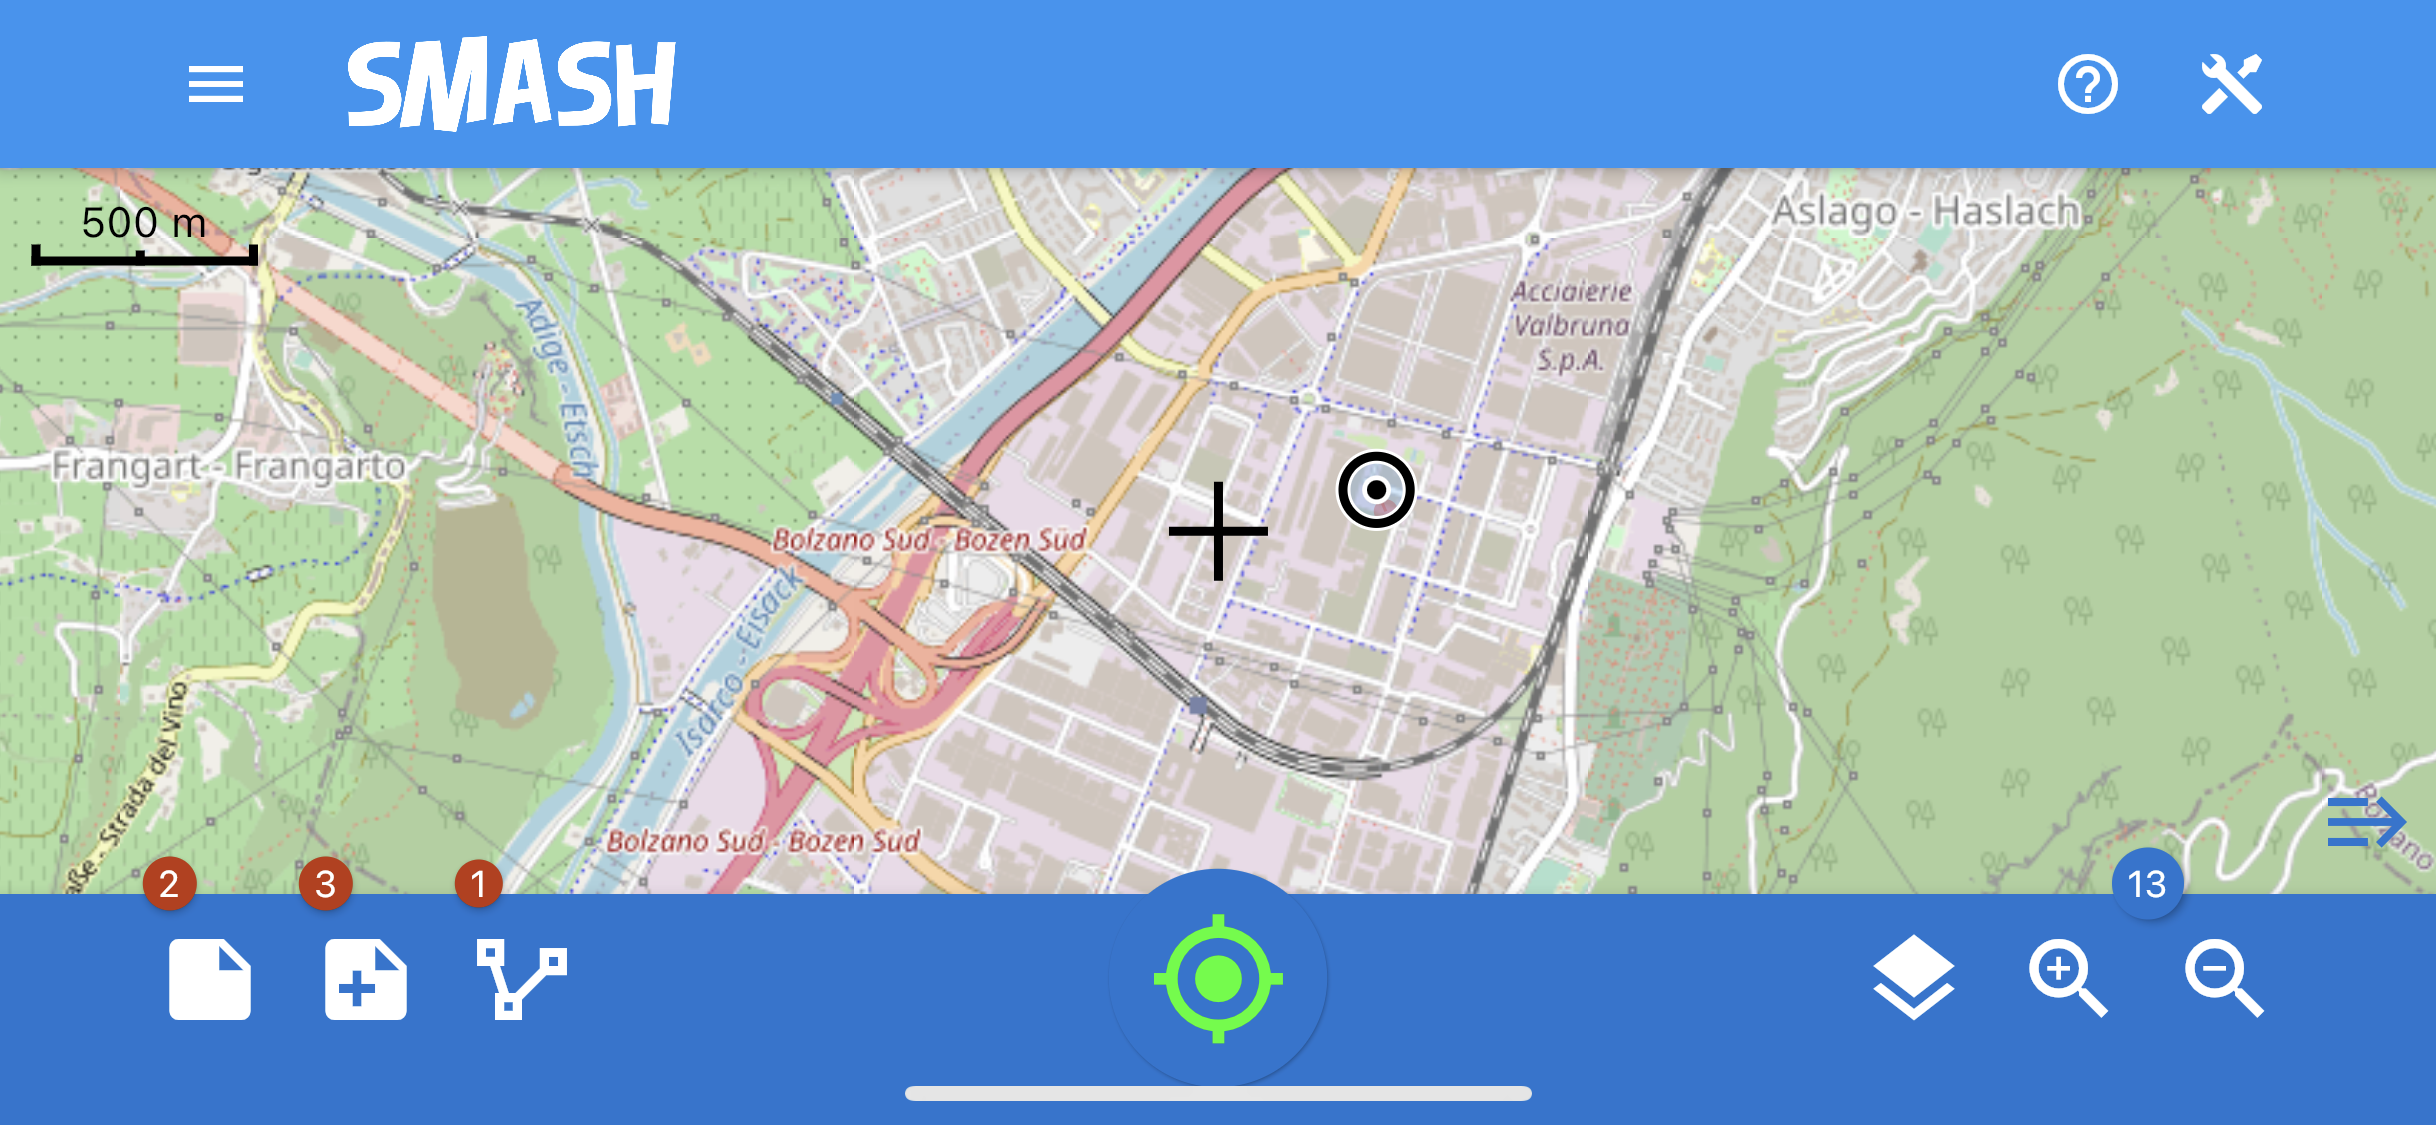
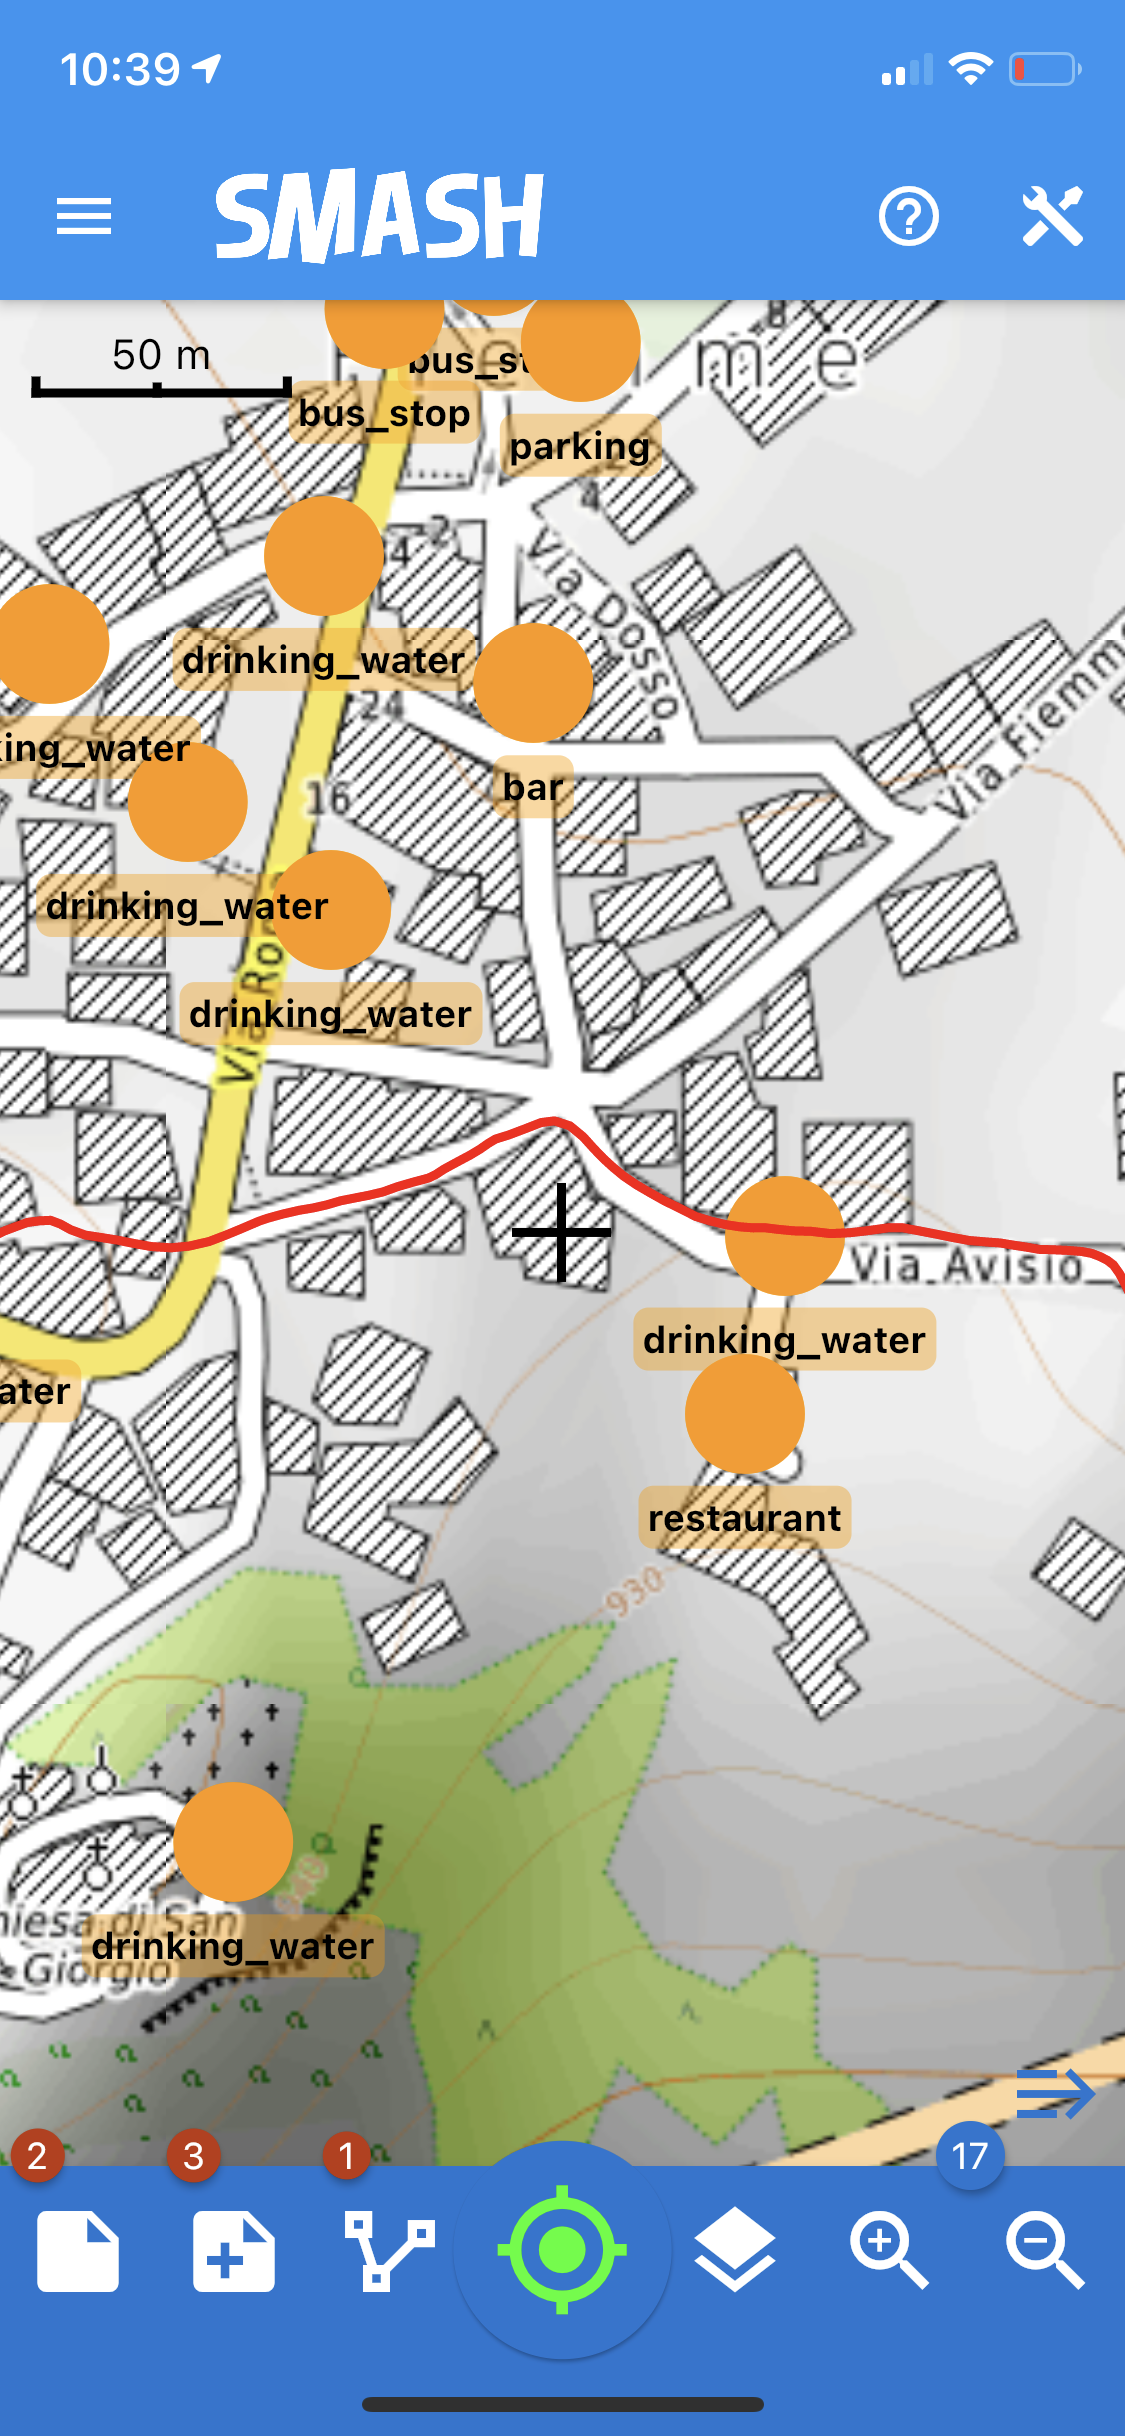
4. The Main View
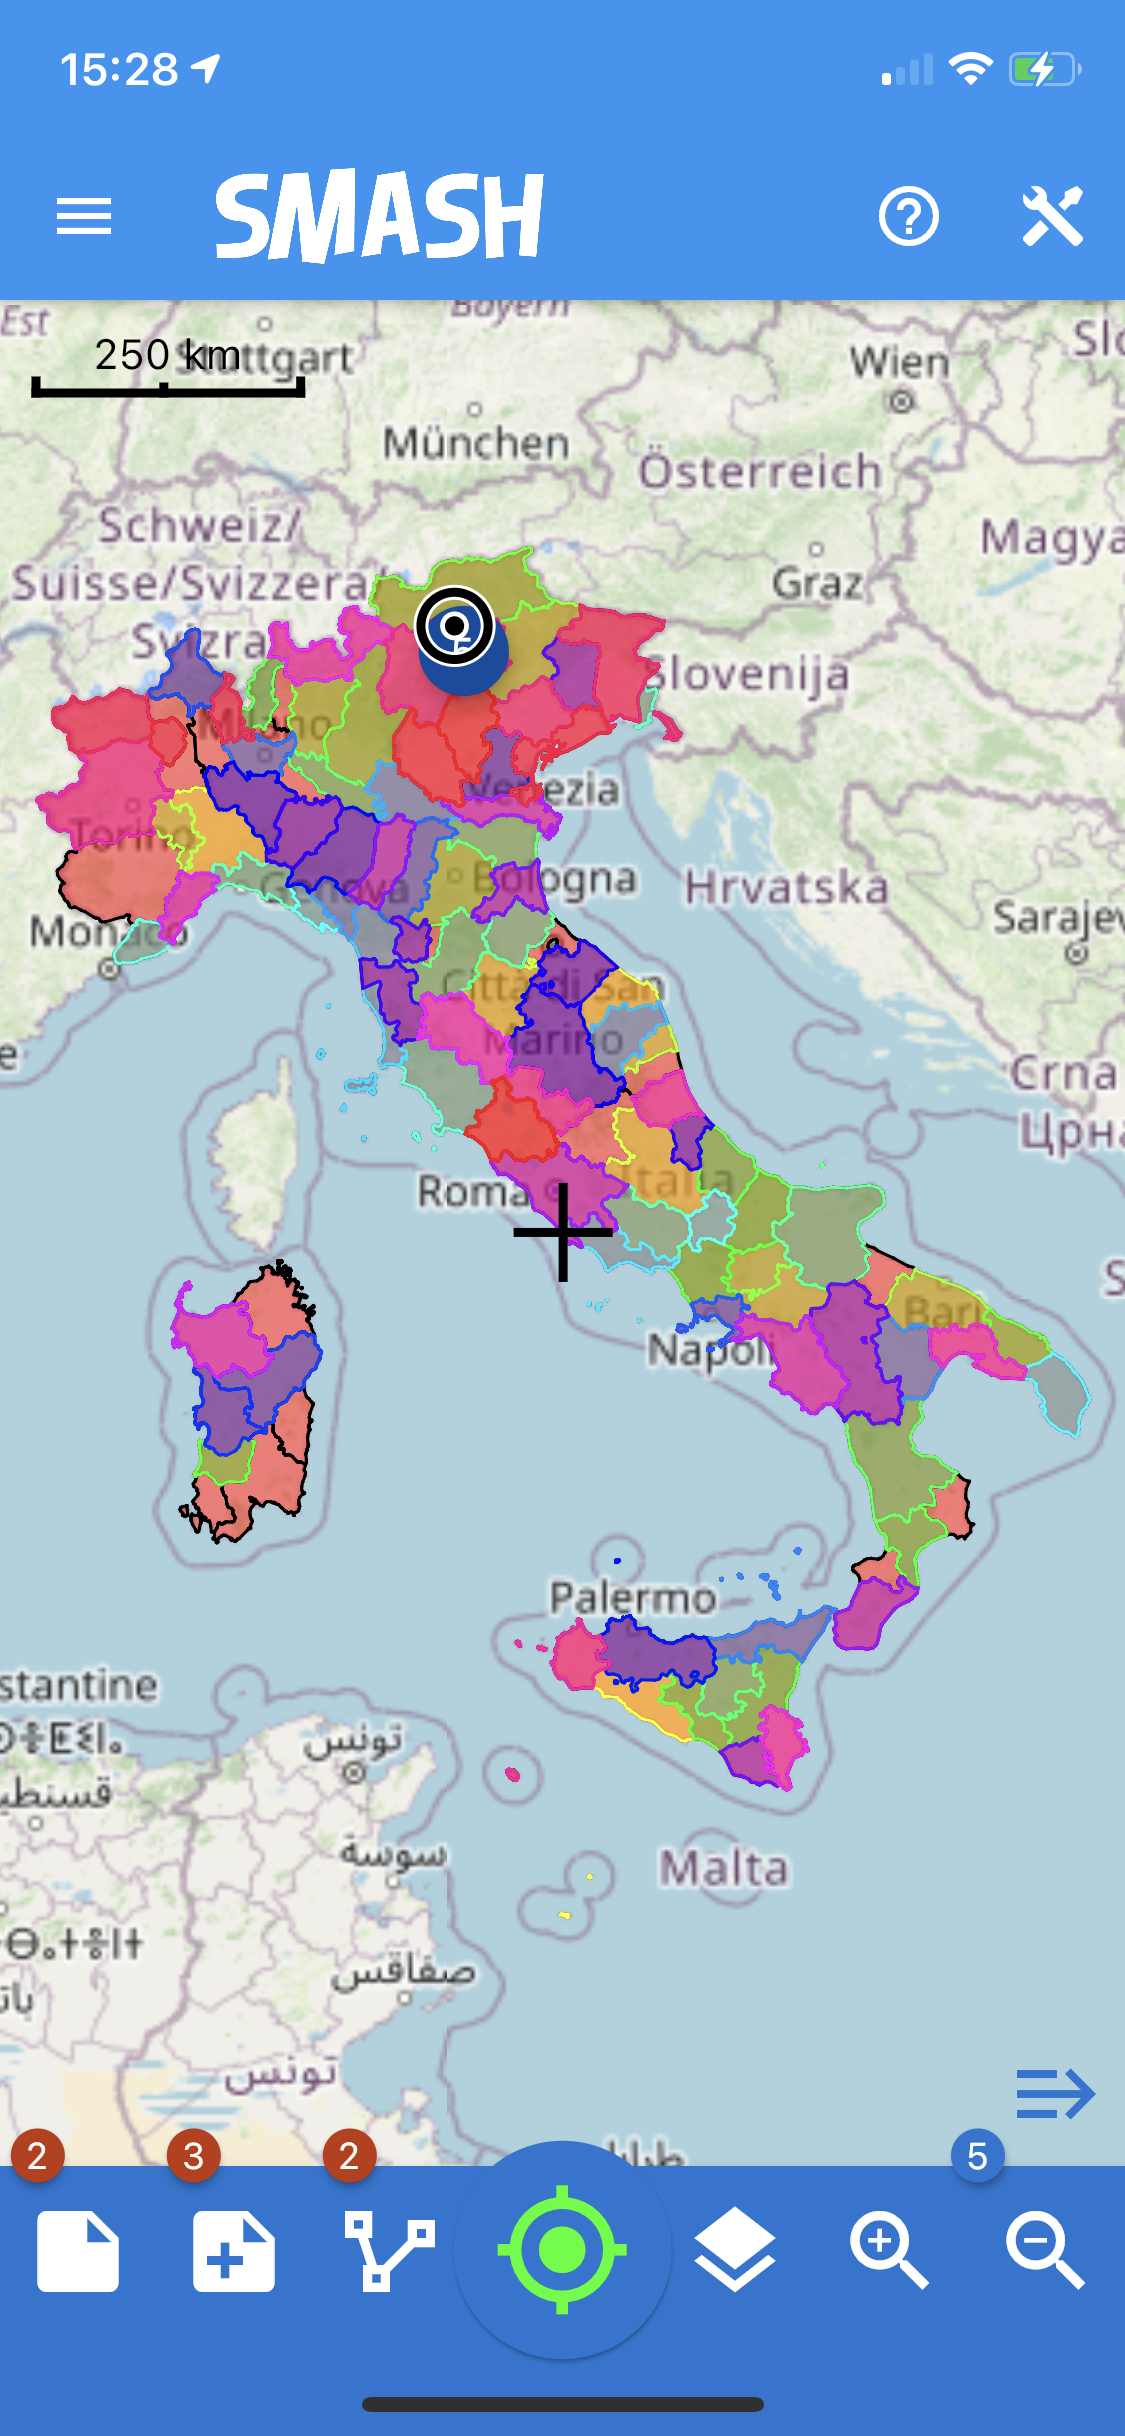
After selecting the project, the main map view appears.
All the features that need to be quickly accessed, such as GPS logging, notes creation, as well as the visualization of the current position on a map are accessible from that view.
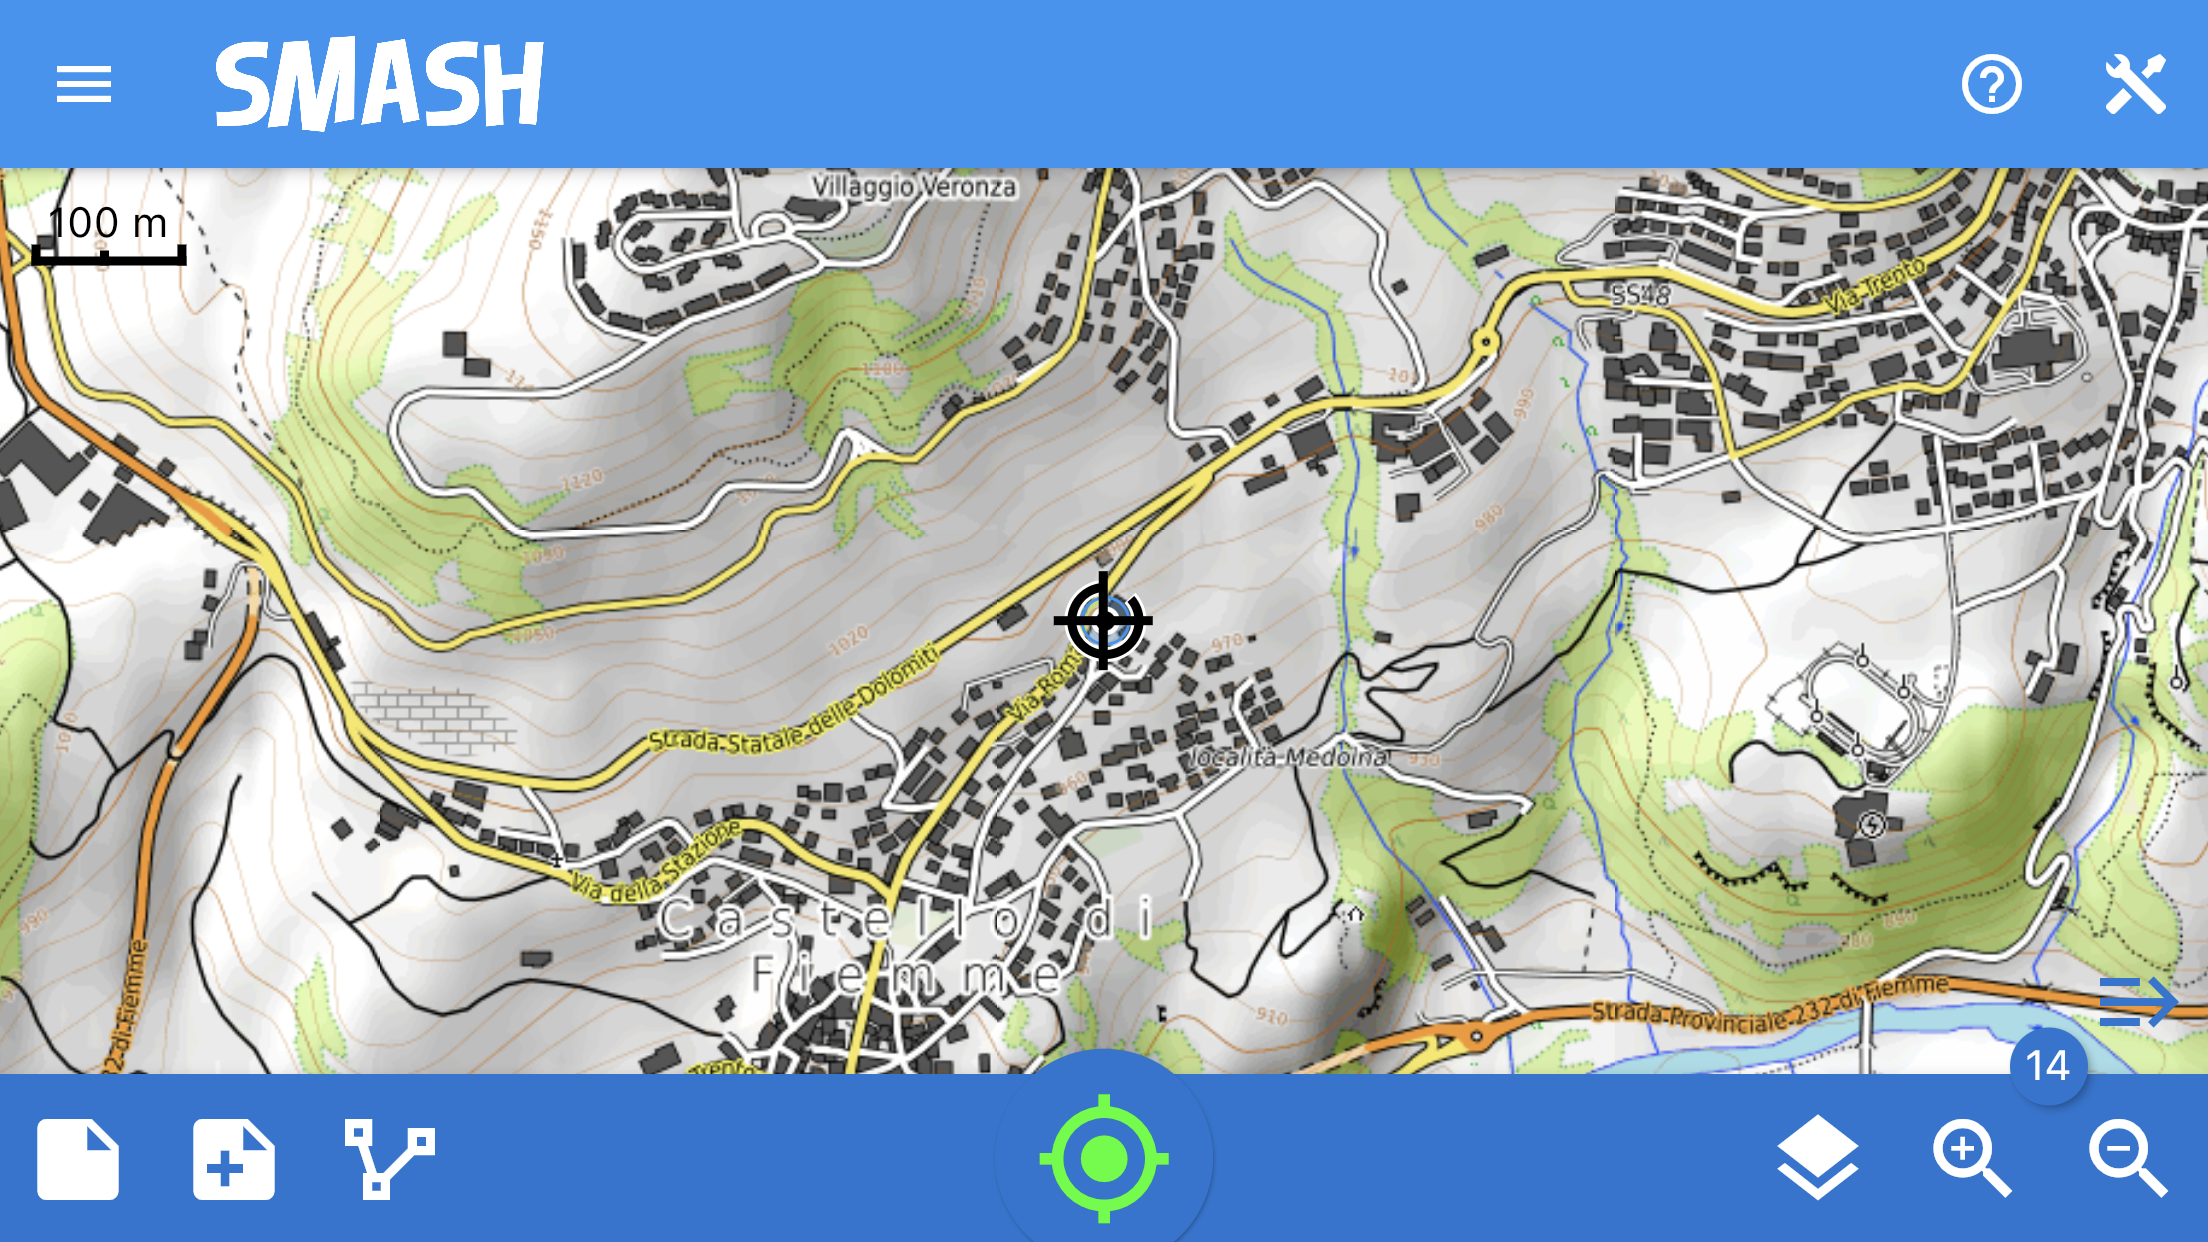
The main view of SMASH.
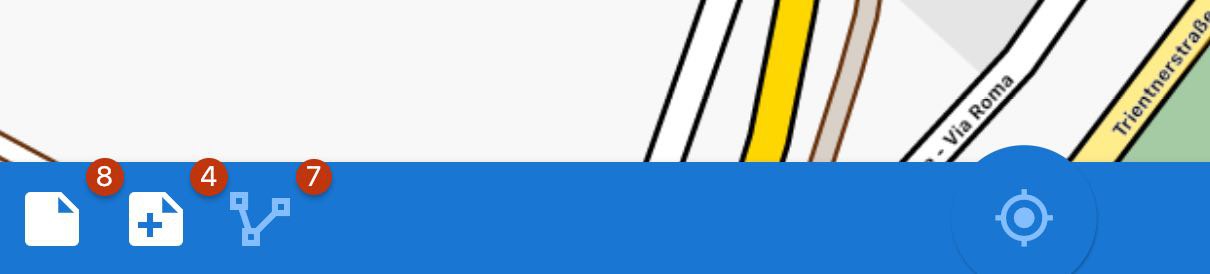
In particular, from the main view the following primary functions can be accessed:
-
center map on GPS, open the GPS info tools and activate the automatic center on GPS
-
take notes, open notes list and select the view mode (for simple notes and form notes)
-
create a GPS log and open the logs list
-
open the layer view and open the map plugins dialog
-
activate the bottom toolbar
-
open the project information and share dialog
-
open the left side drawer with the main menu
-
open the right side drawer with the tools section
-
open the interactive coach marks
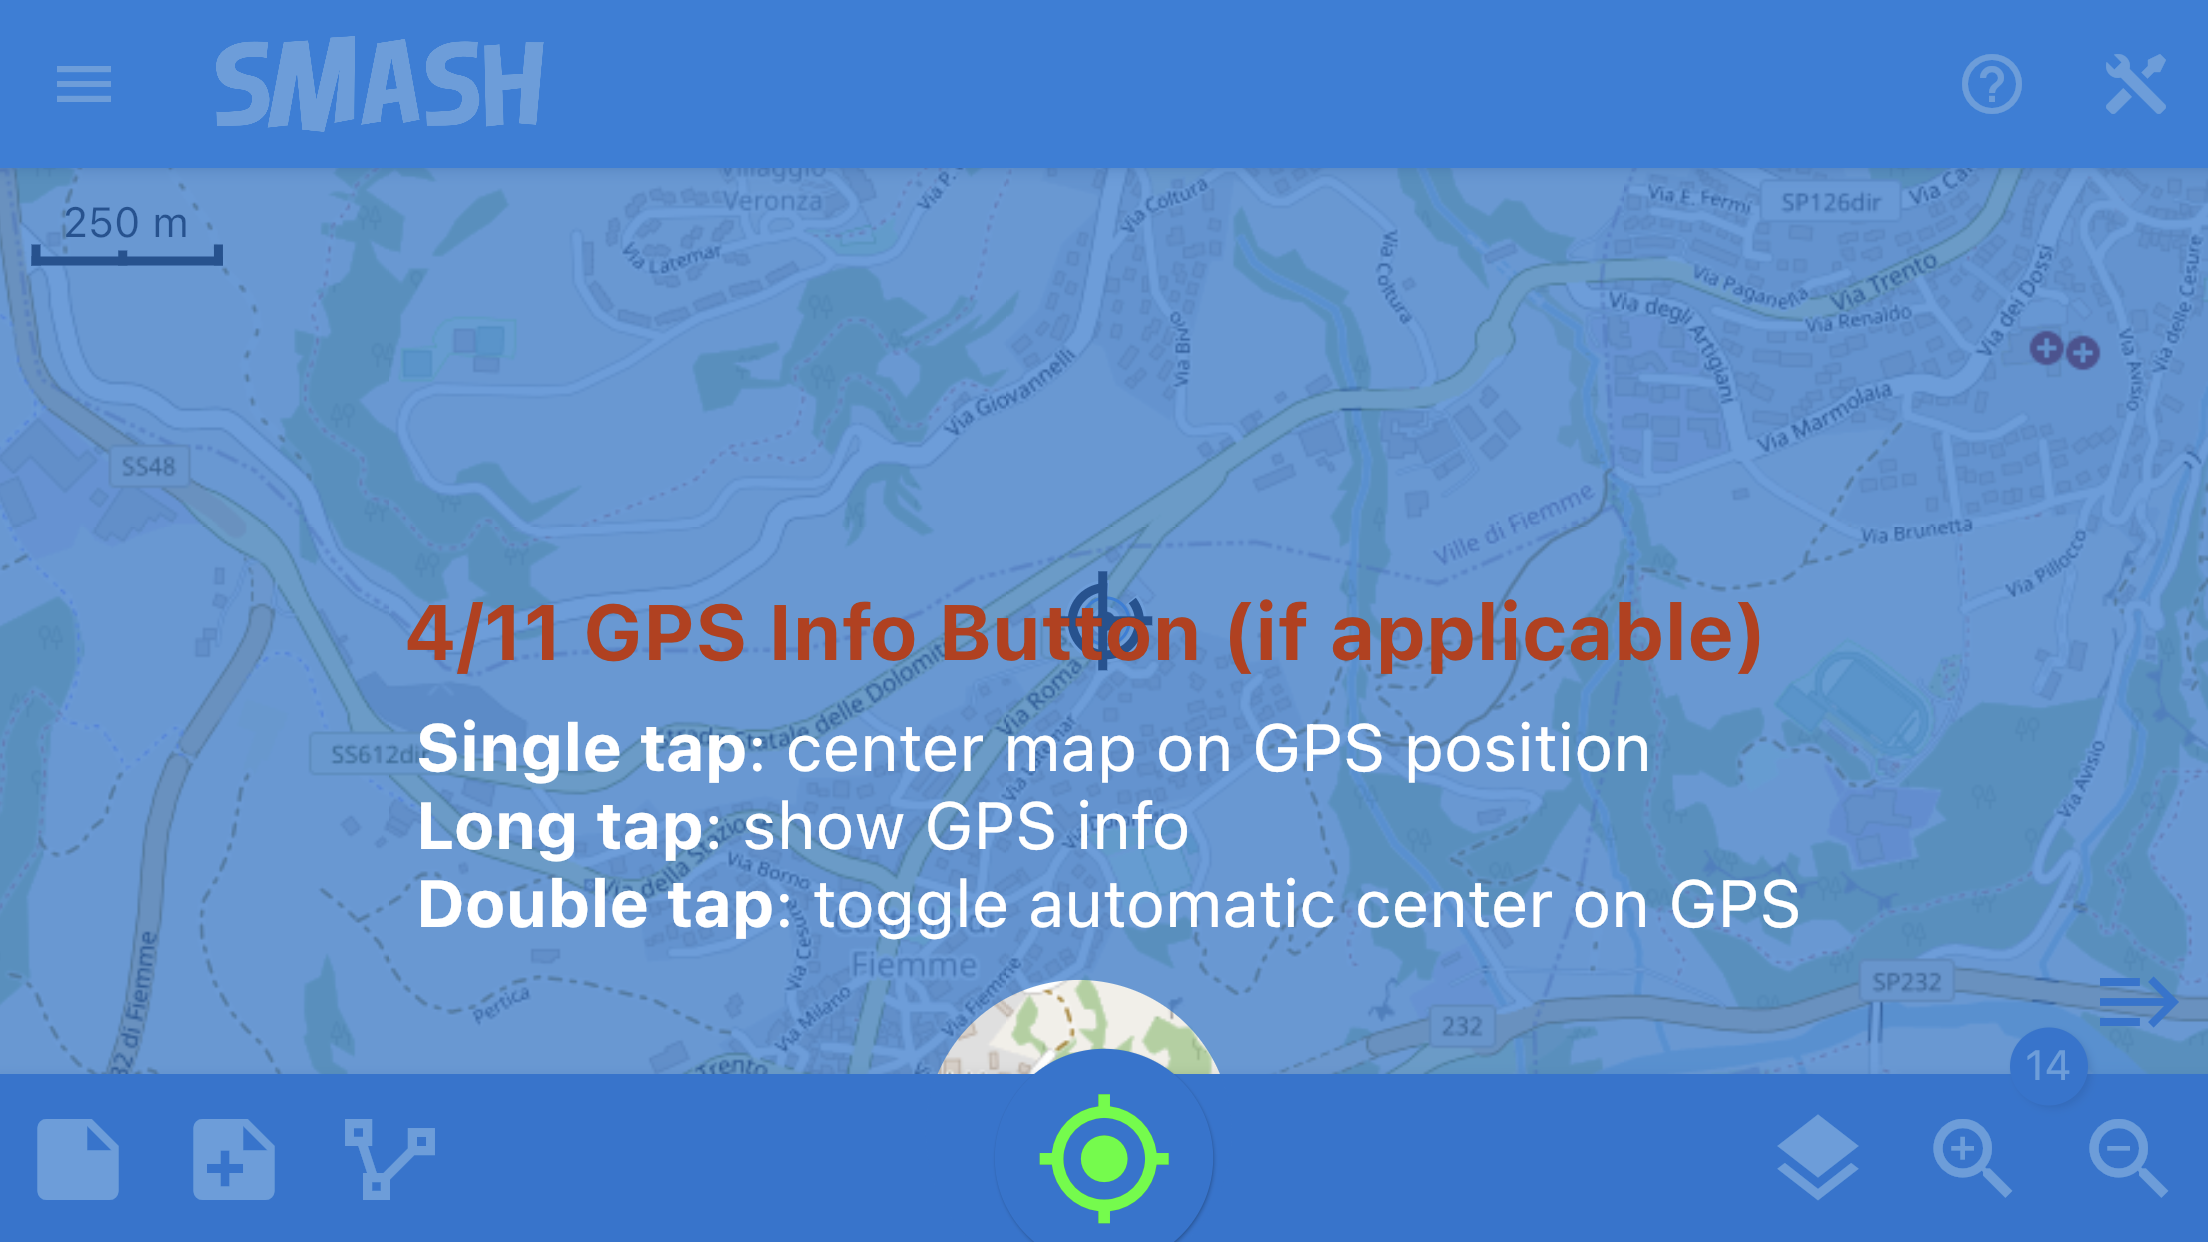
4.1. GPS info button and tools
The central bottom button is the GPS info button.
The icon of the GPS status button can be of the following colors:
-
RED: GPS is switched off, this option is available only on iOS devices
-
ORANGE: GPS is on but no fix was acquired
-
GREEN: GPS is on and has fix, but no log is being recorded
-
BLUE: GPS is on and logging.
By tapping on the button, if the GPS has a fix, the map is centered on the GPS position.
By long tapping on the button, the GPS info and tools are opened:
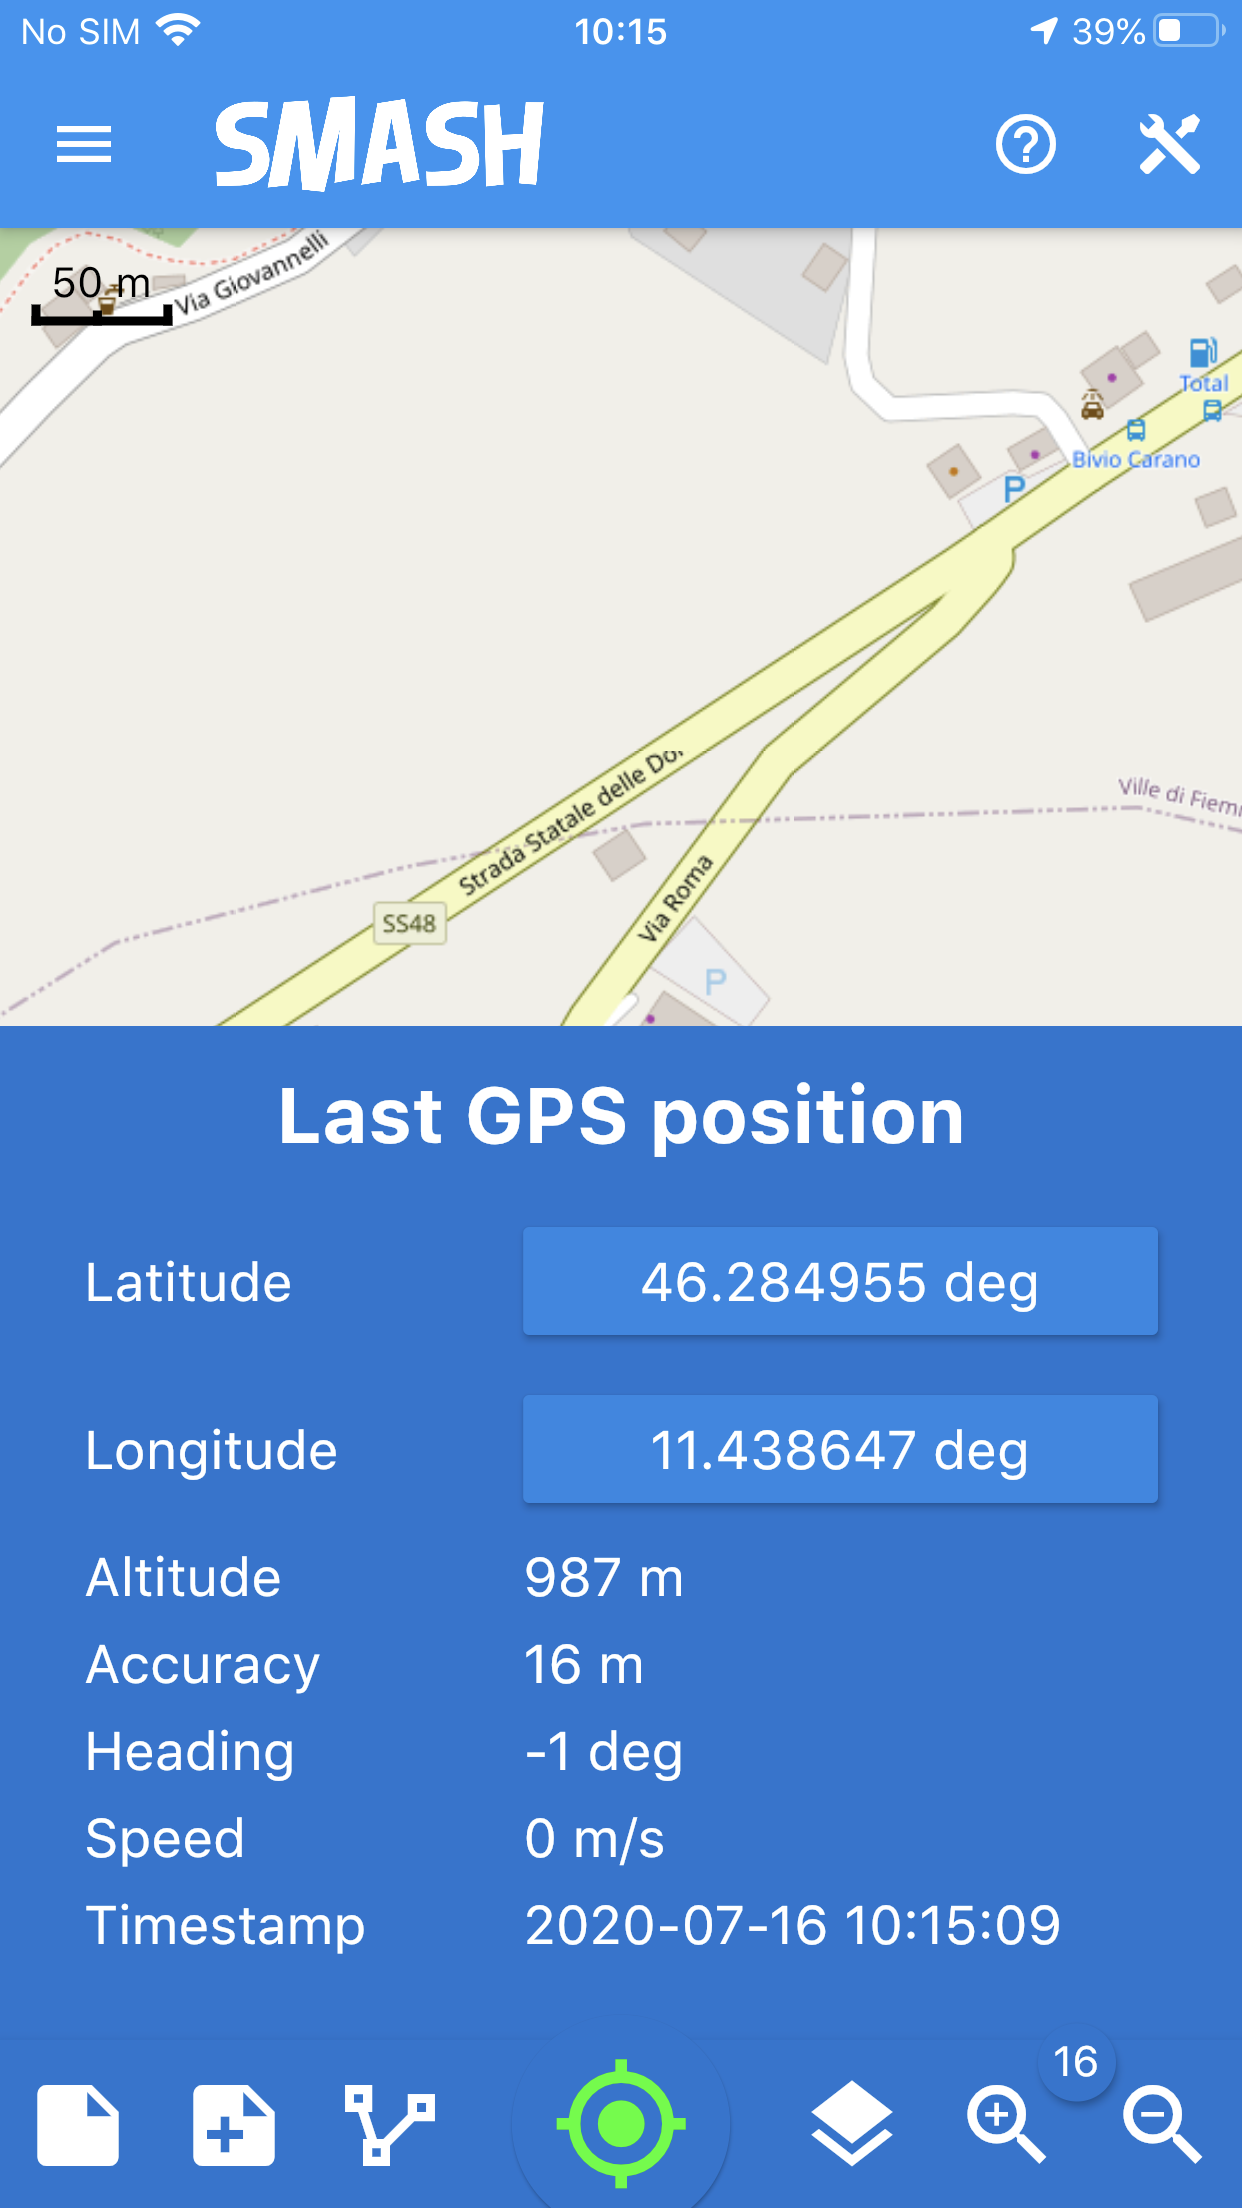
The GPS info and tools.
From here the user can access the current GPS information and copy the coorinates into the device’s clipboard. To do that long tap on the coordinate you want to copy.
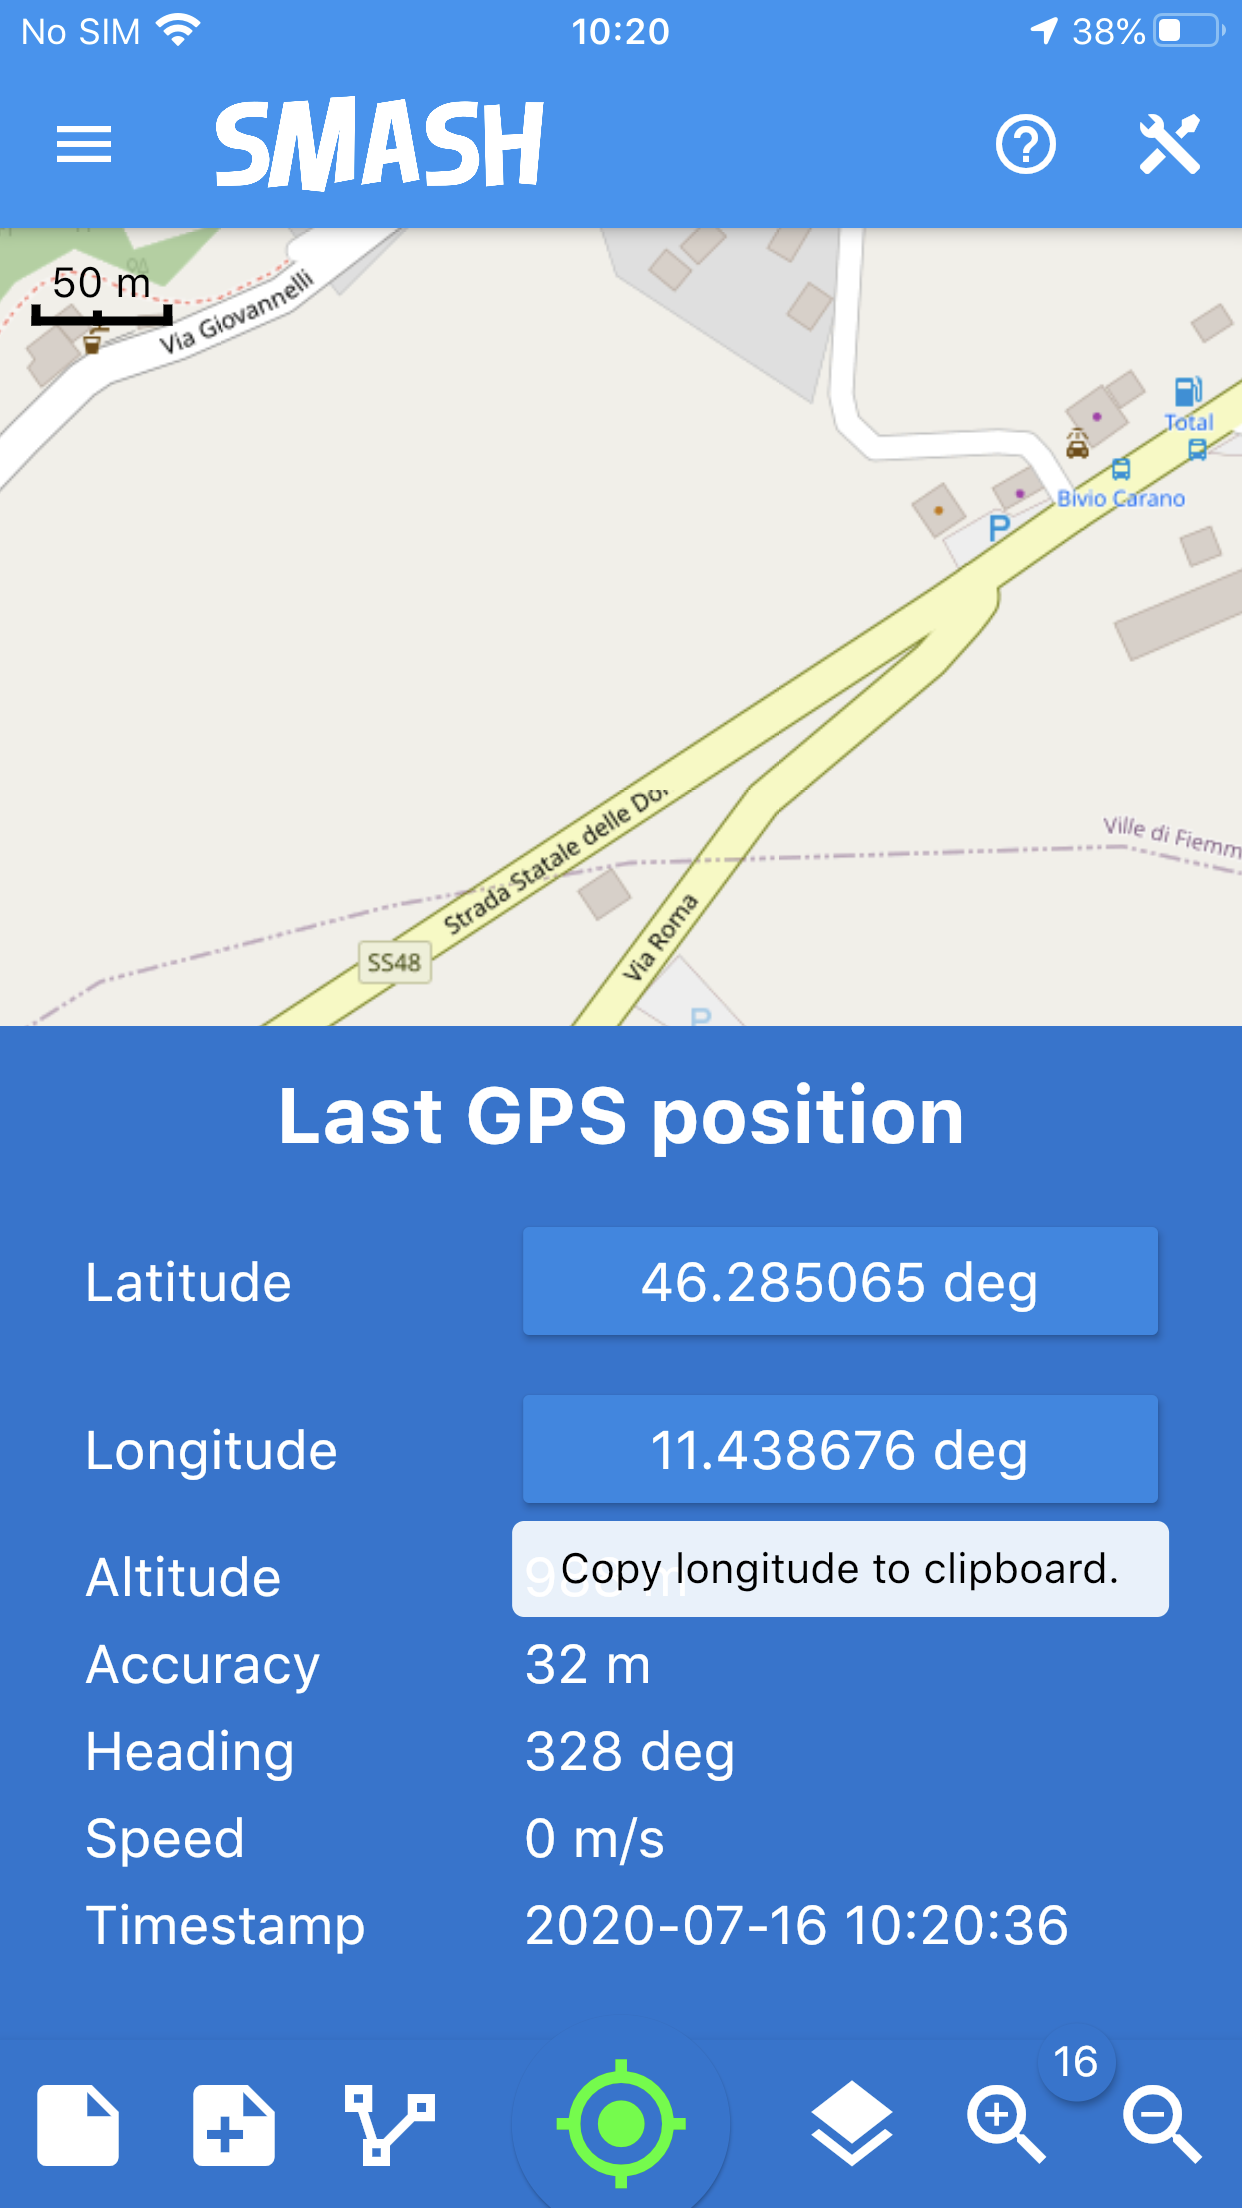
The GPS info and tools copy coordinates.
To close the GPS info and tools panel just swipe it down.
By double tapping the GPS button the automatic map centering on GPS is toggled.
On Android devices the GPS position notification message is dynamic. In the notification of the device there are all the information about the GPS status (position and logging).
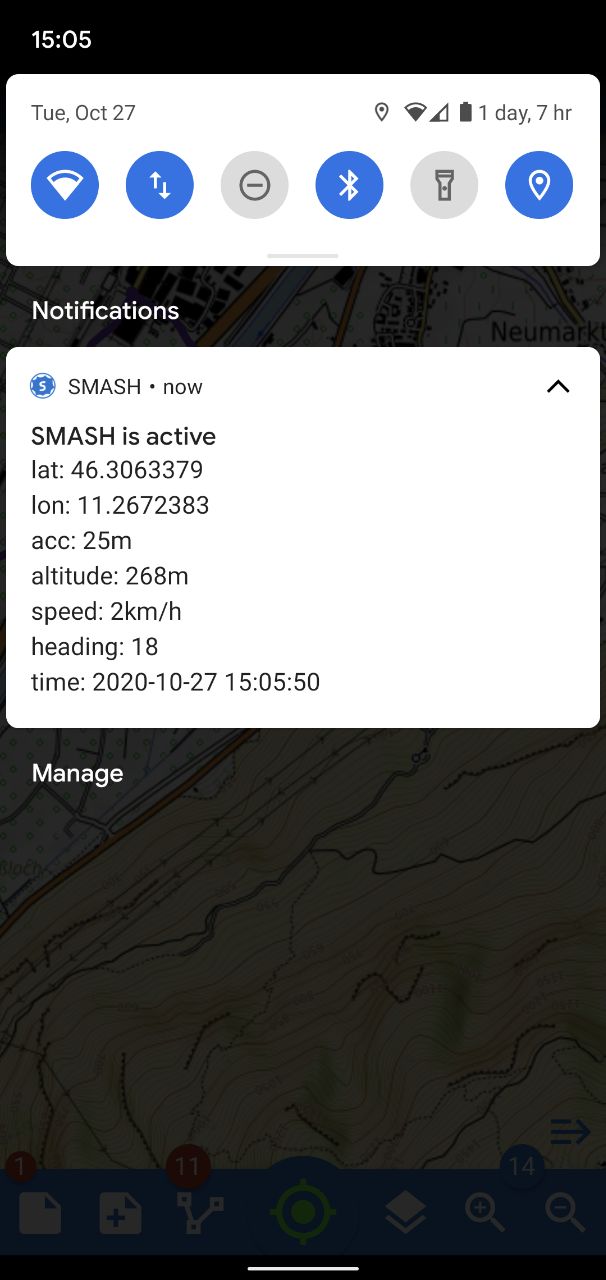
The visualization of the GPS notification on an Android device.
4.2. Notes
SMASH supports different types of notes:
-
simple notes
-
simple text notes
-
simple picture notes
-
-
form-based notes
4.2.1. Simple Notes
To create simple notes tap on the first icon of the lower toolbar. The Simple Notes dialog appears, allowing to choose between:
-
text or image notes
-
to place the note in the current GPS position or in Map Center.
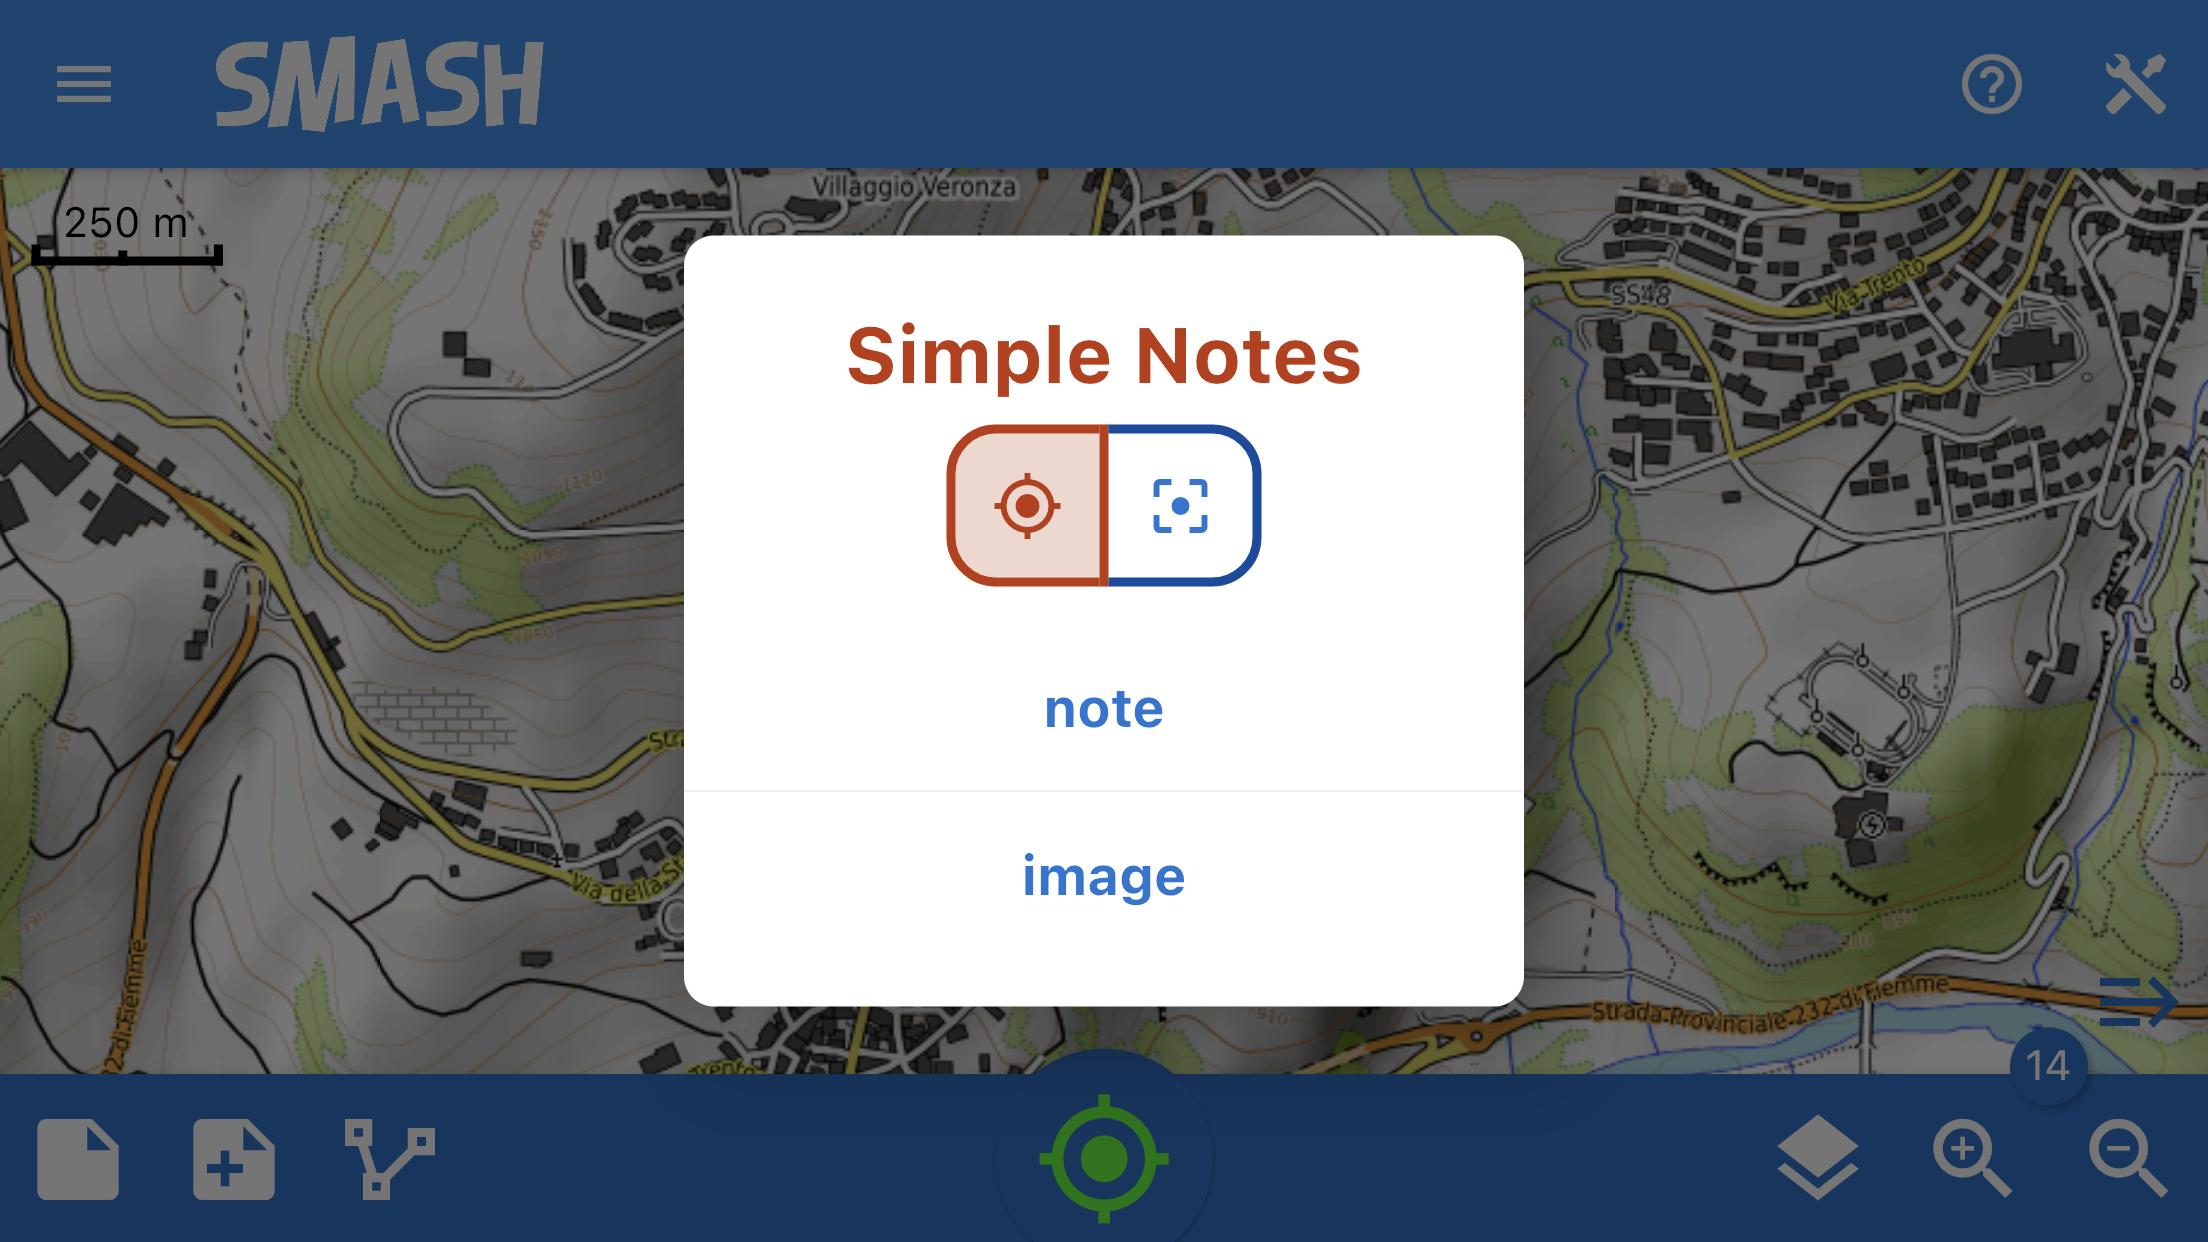
Adding simple notes to the project. The note will be placed in the GPS position.
The highlighted icon at the top of the dialog tells the user whether the note will be inserted in the current GPS position or in the current map center.
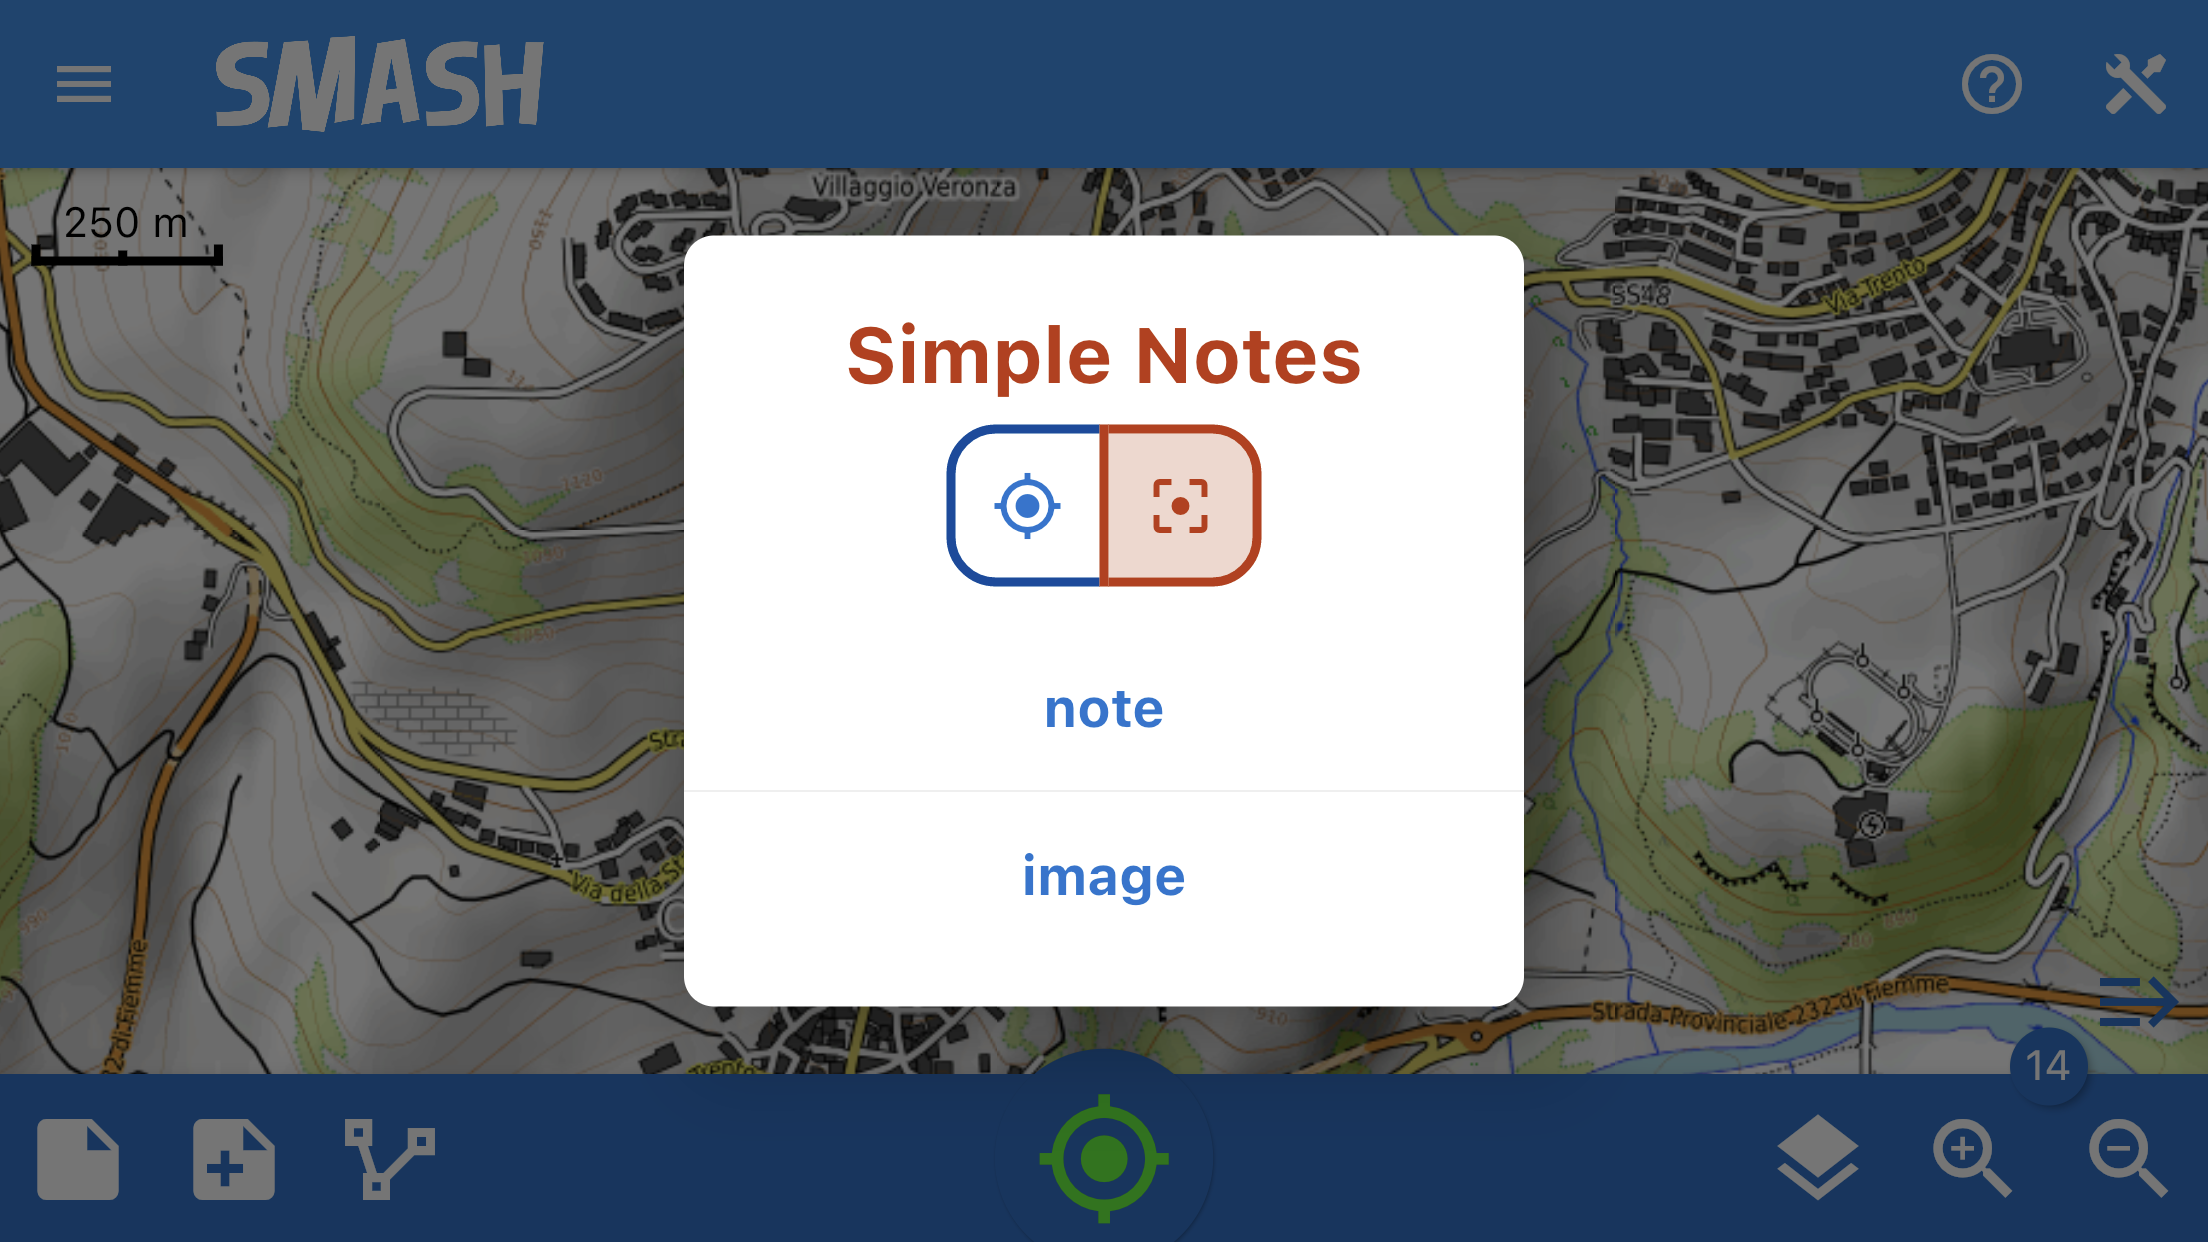
Adding simple notes to the project. The note will be placed in the current center of the map.
When the text note entry is selected, the note properties view opens:
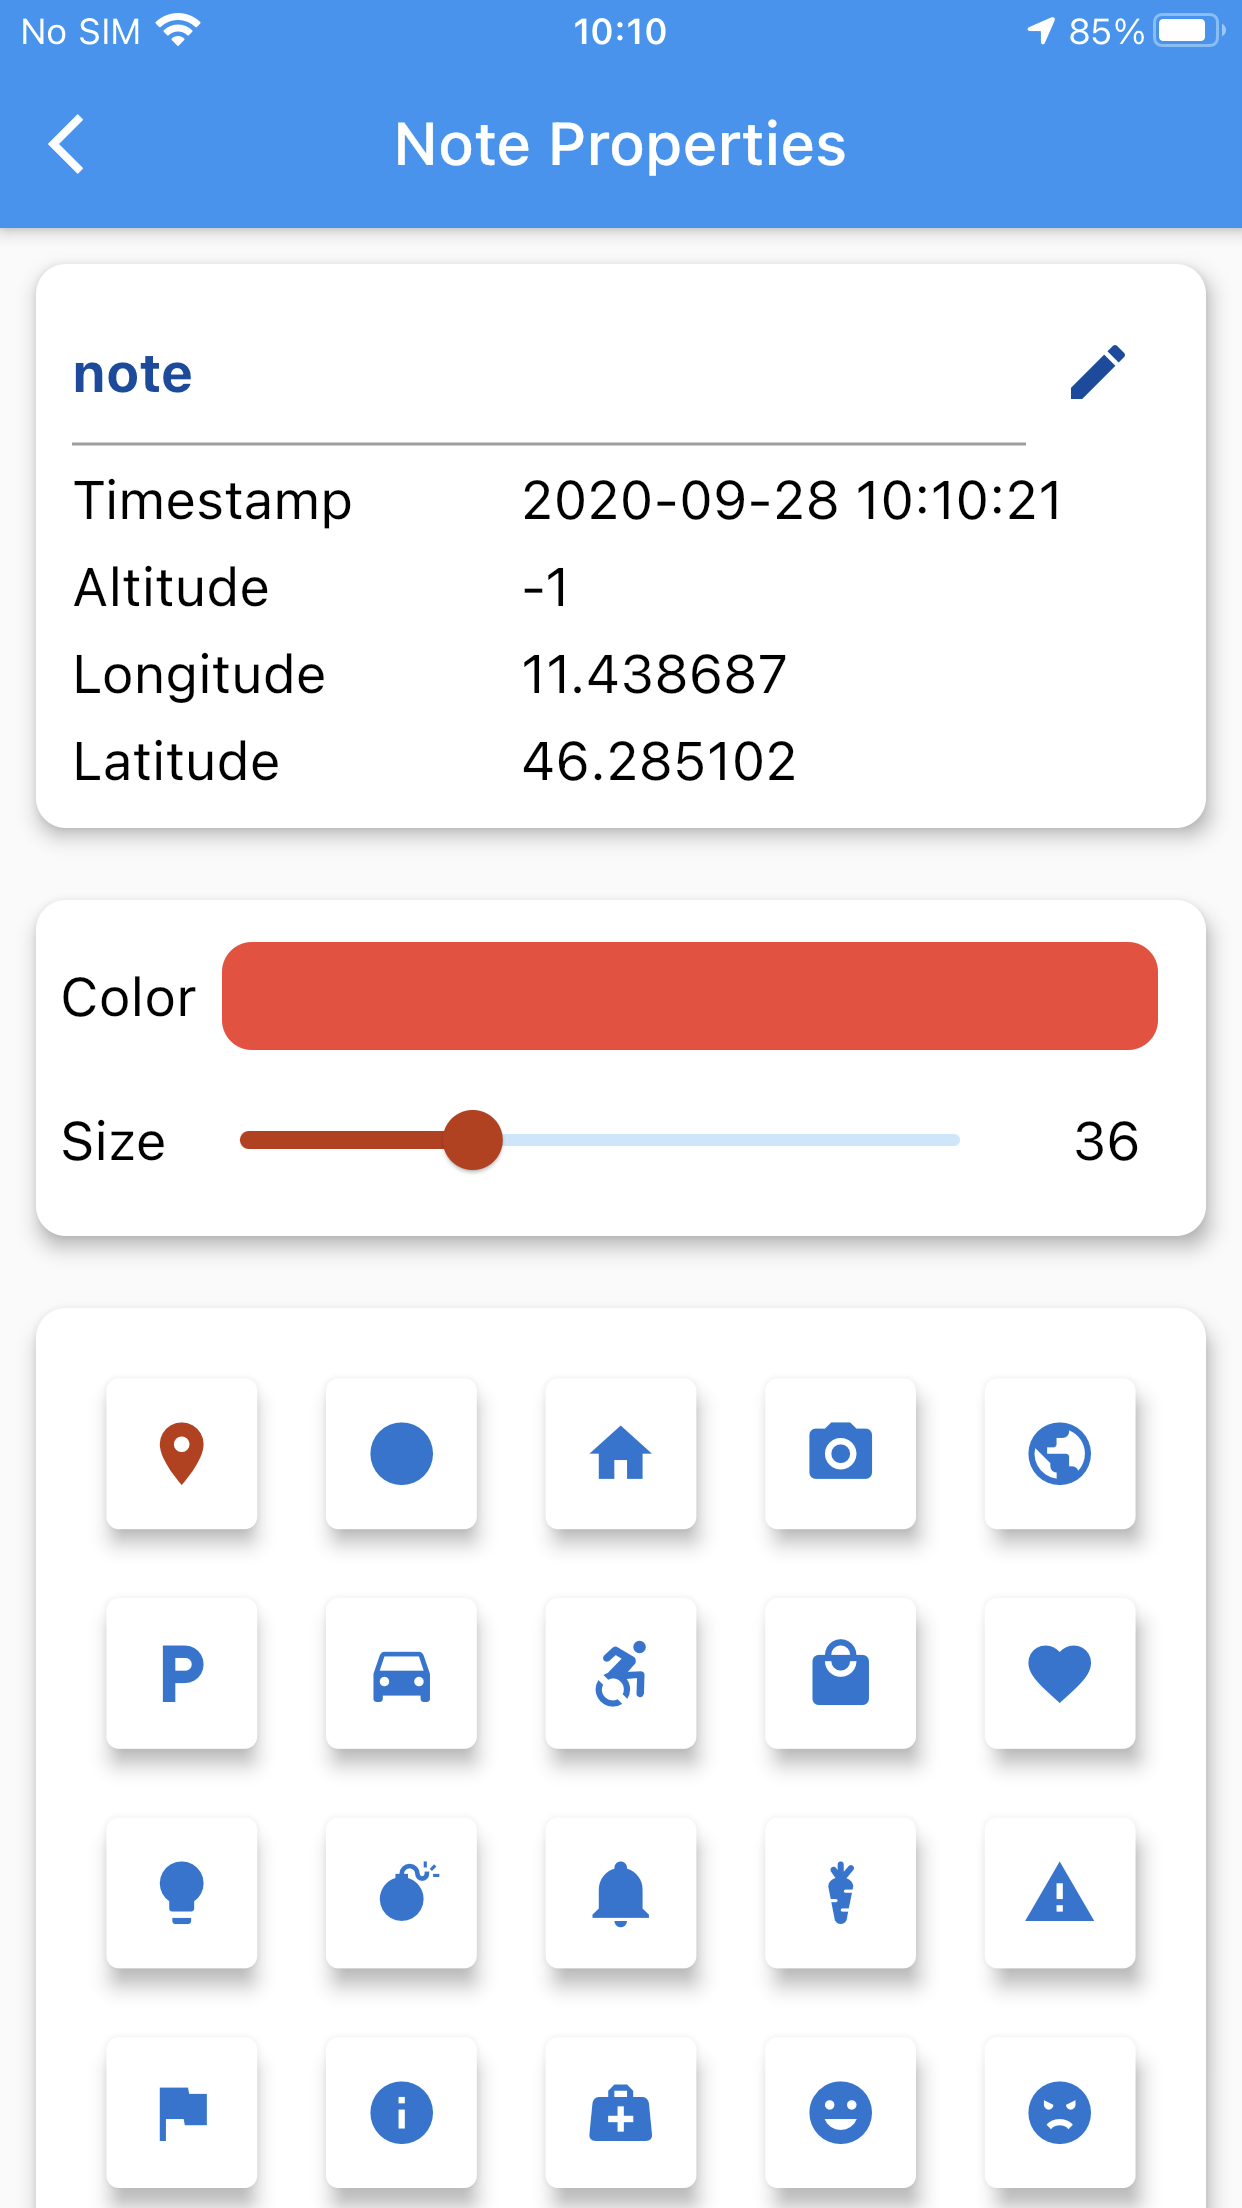
The text properties view.
By tapping on the pencil right to the first table entry, it is possible to enter the text of the note.
Moreover it is possible to select color, size and icon for the note.
When the image note is used instead, the camera opens and allows the user to save a picture to the project.
If a note is tapped on from the map view, a snackbar opens, allowing to share, delete or edit the selected note:
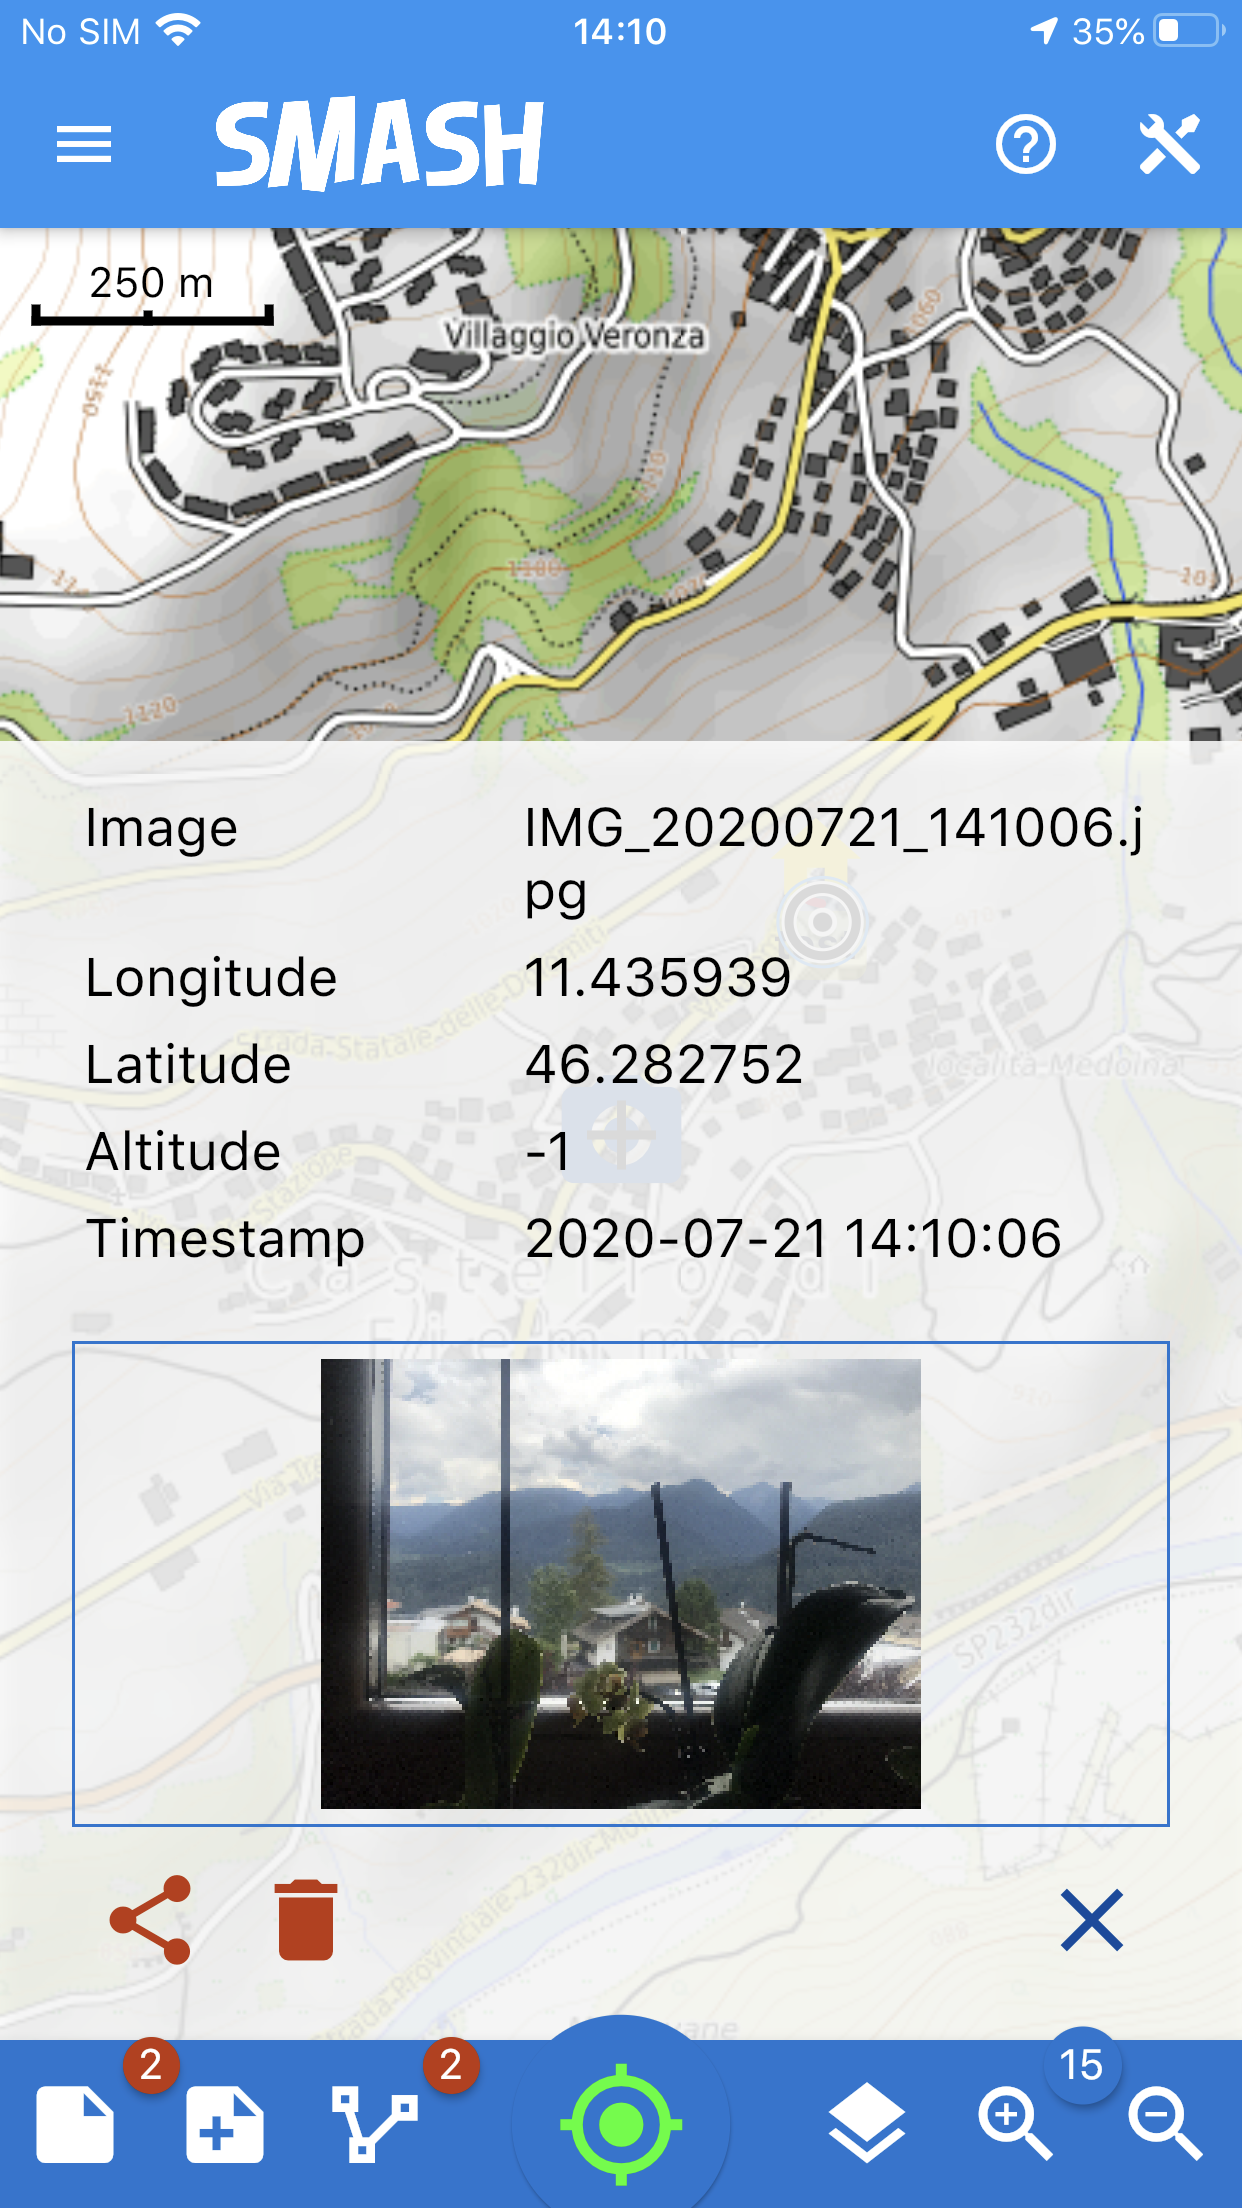
The quick note info snackbar.
If the note is an image note, a thumbnail of the note is shown.
4.2.2. Simple Notes List
By long tapping on the add note button, the notes list opens:
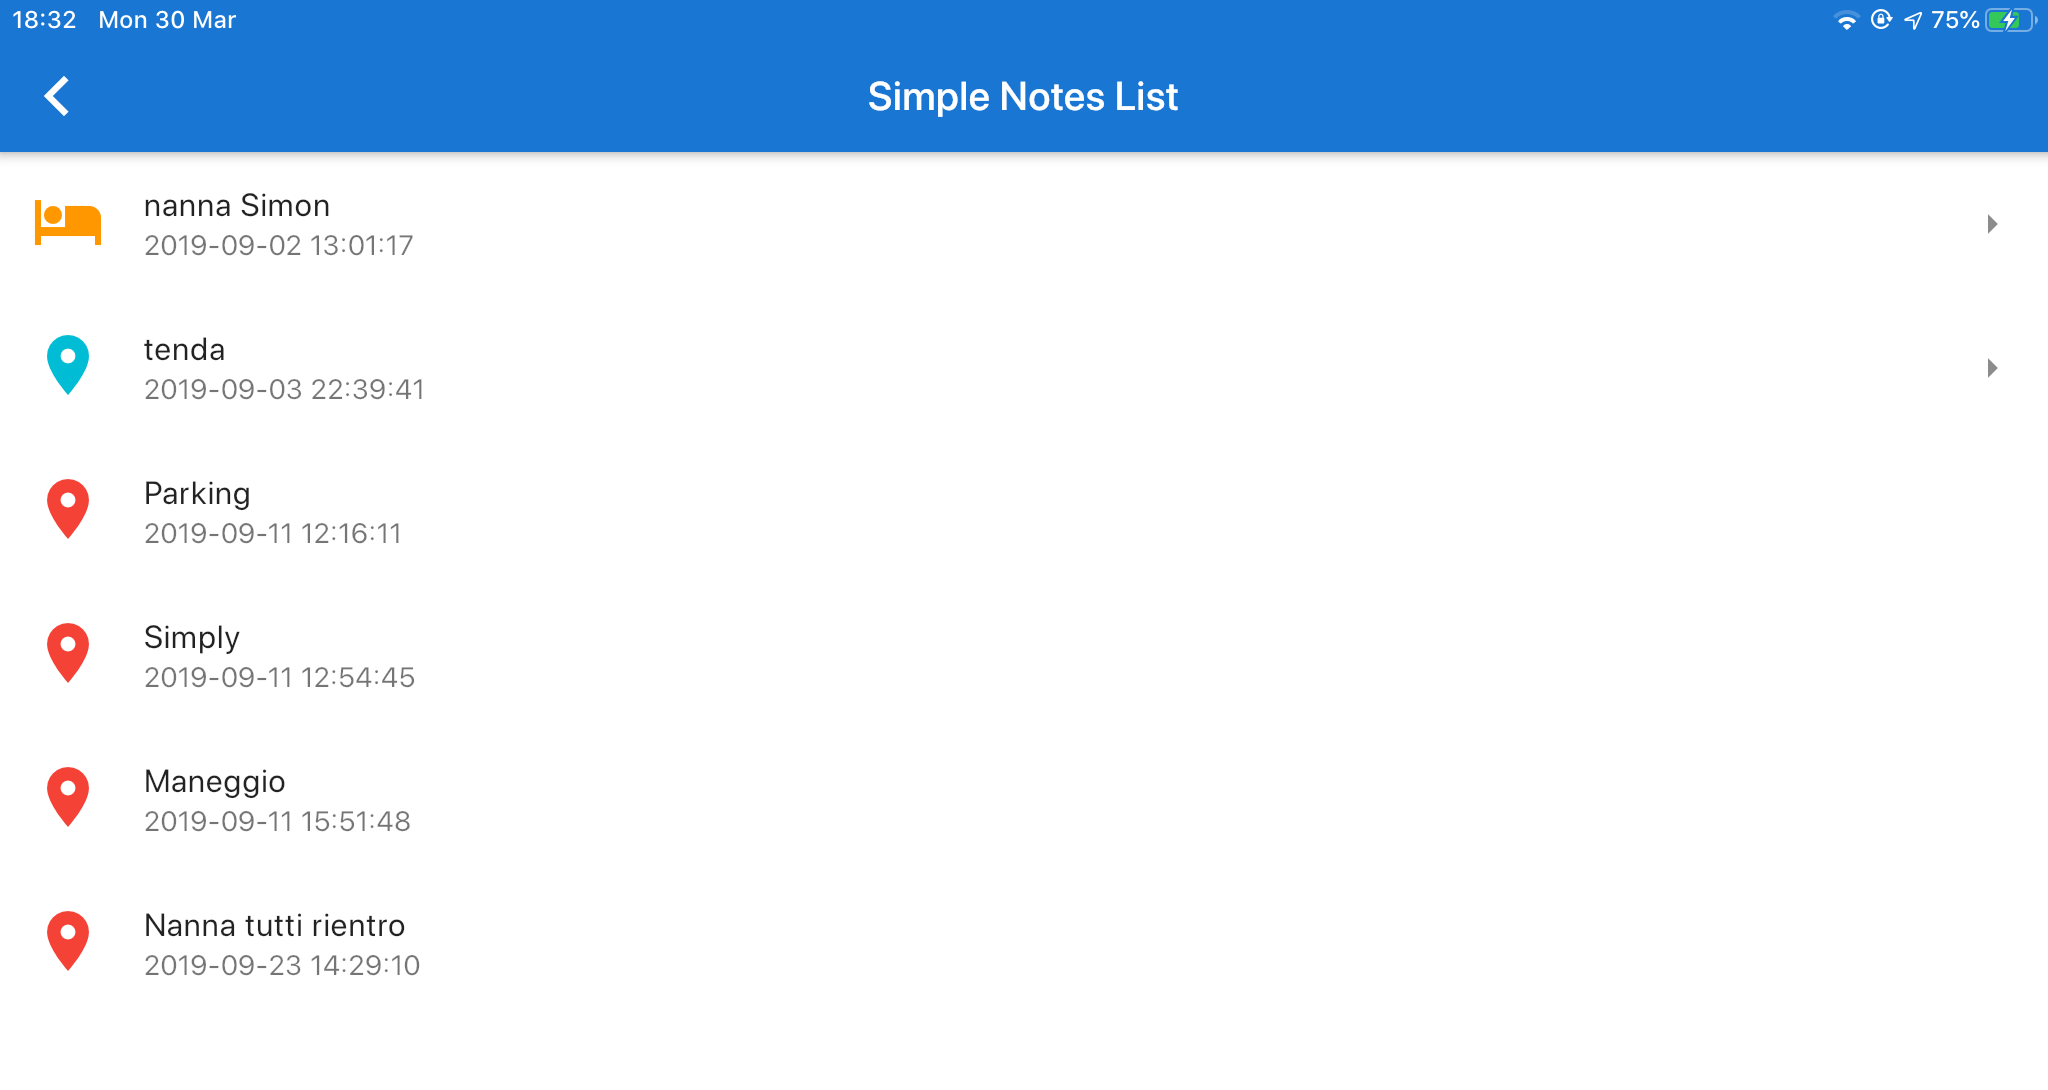
The notes list view.
From here notes can be modified or zoom to the selected note (swipe note to the right) or deleted (swipe note to the left).
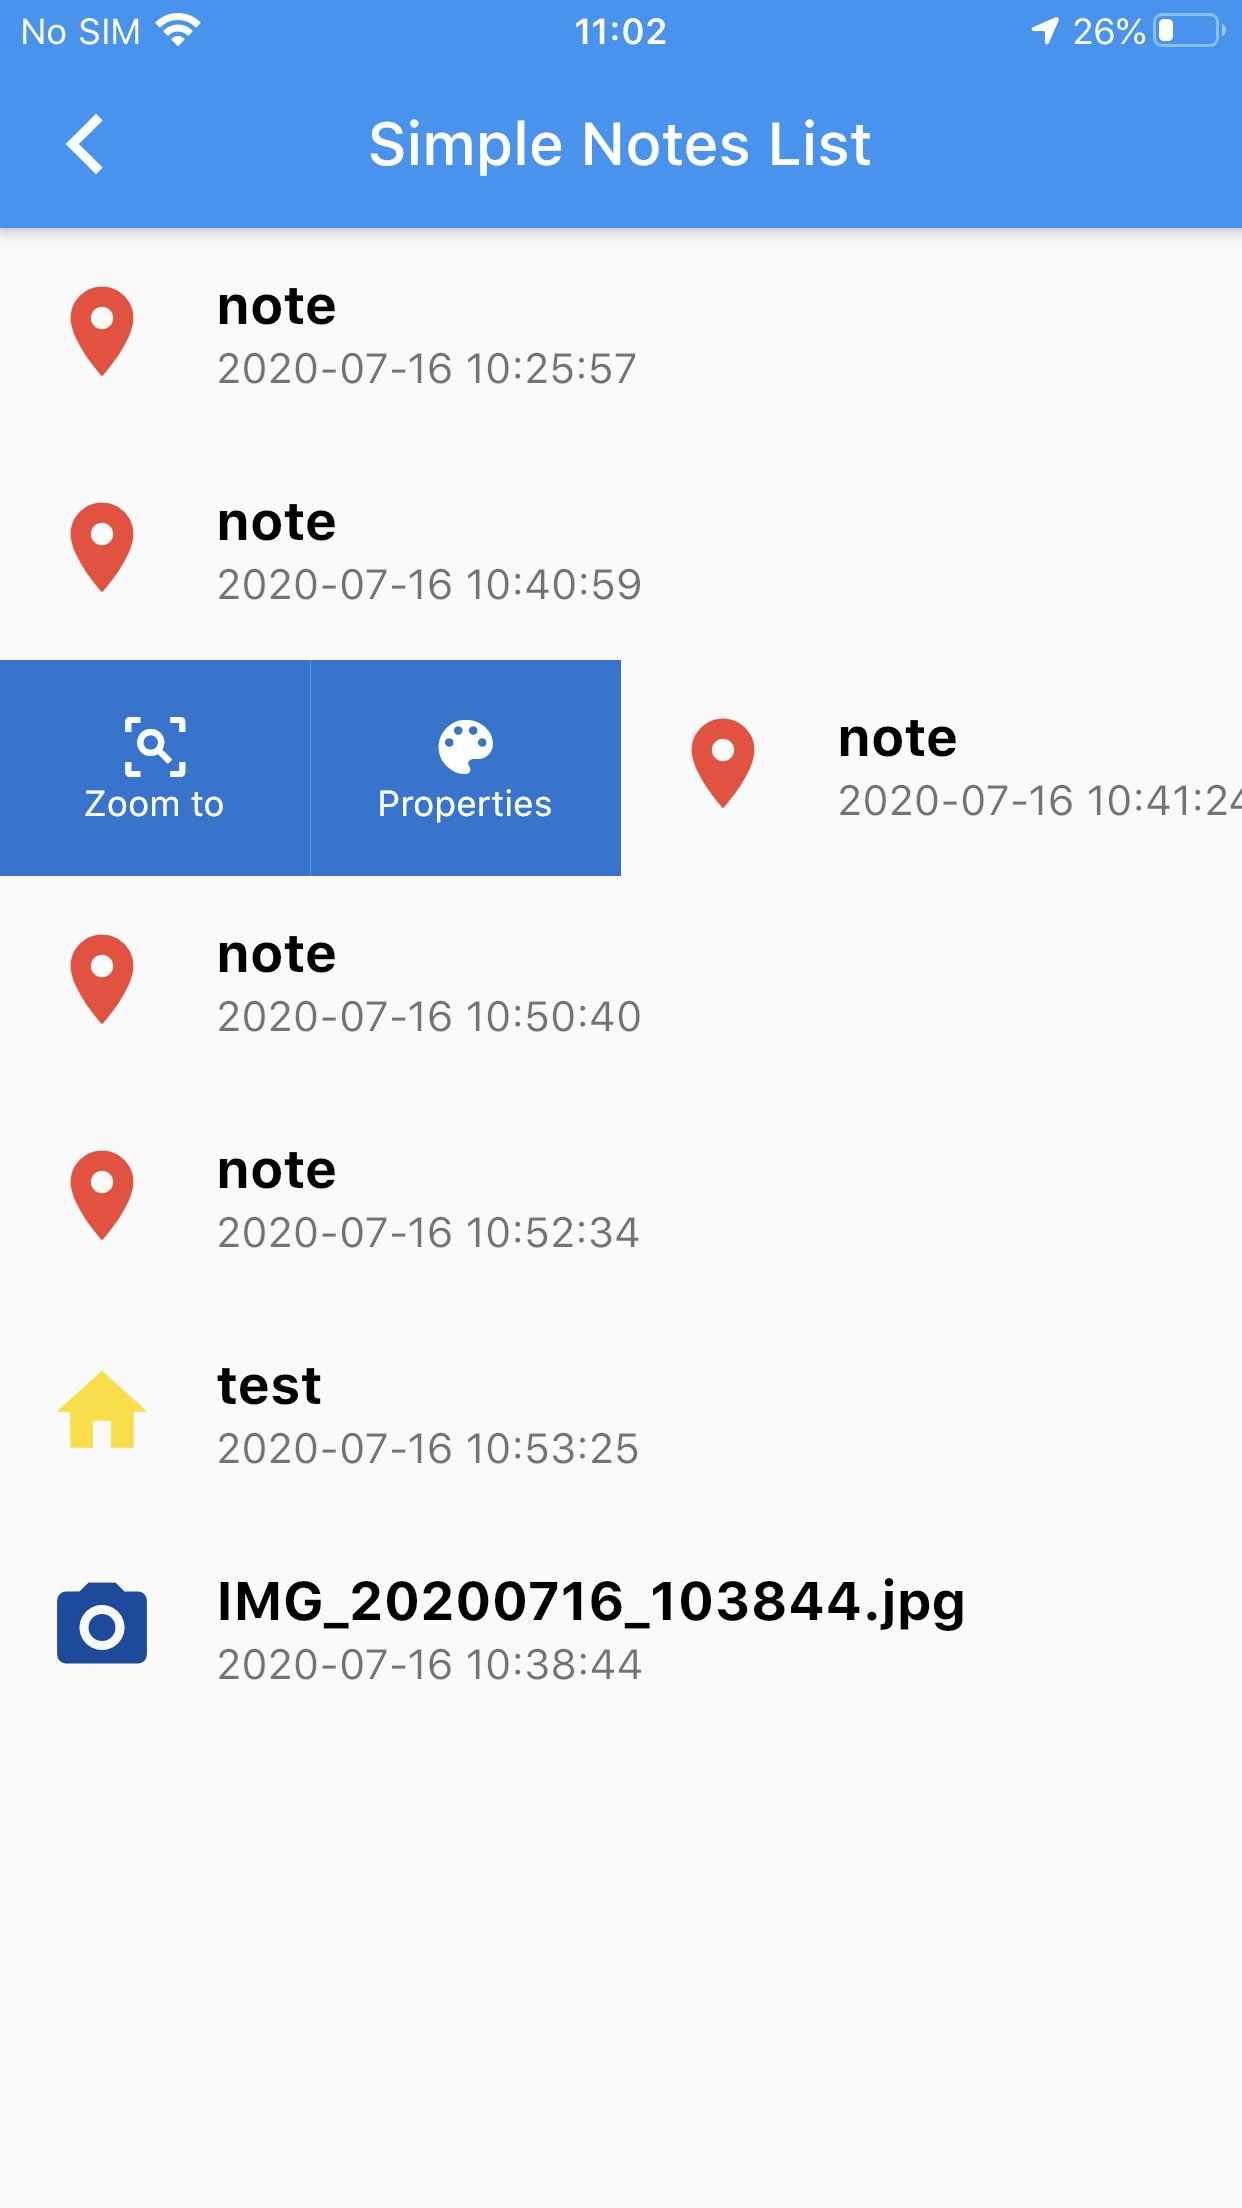
The options available for a single note in the notes list.
4.2.3. Simple Notes visualization
By tapping twice on the add note button, the settings for the notes view mode opens:
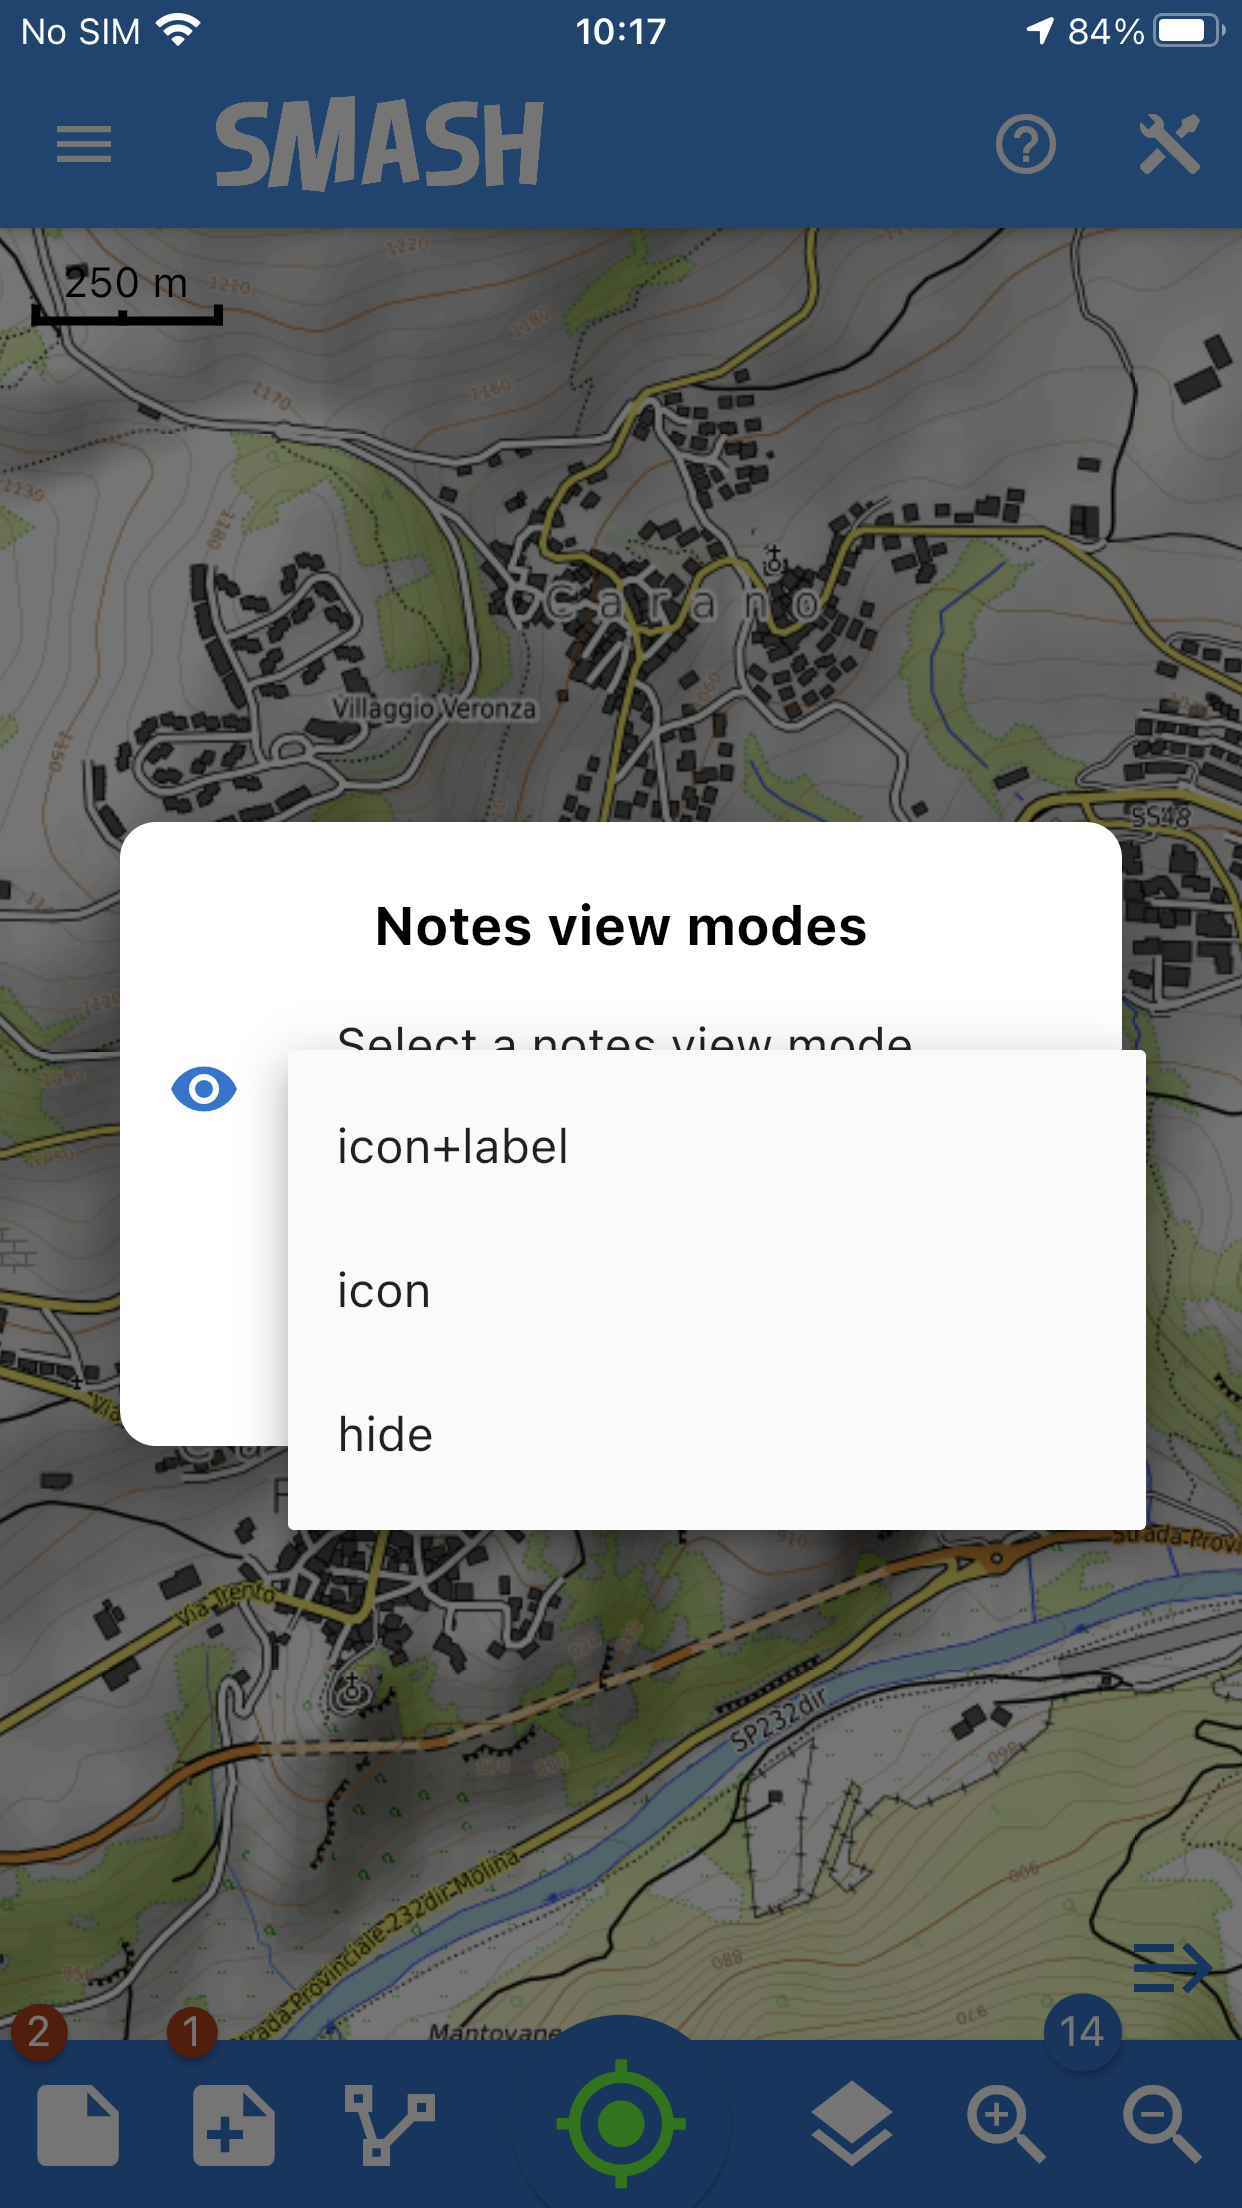
The notes list view.
From here you can decide what to visualize for that kind of note (icon, label or nothing).
4.2.4. Form based notes
The second icon from left on the lower toolbar is for form based notes.
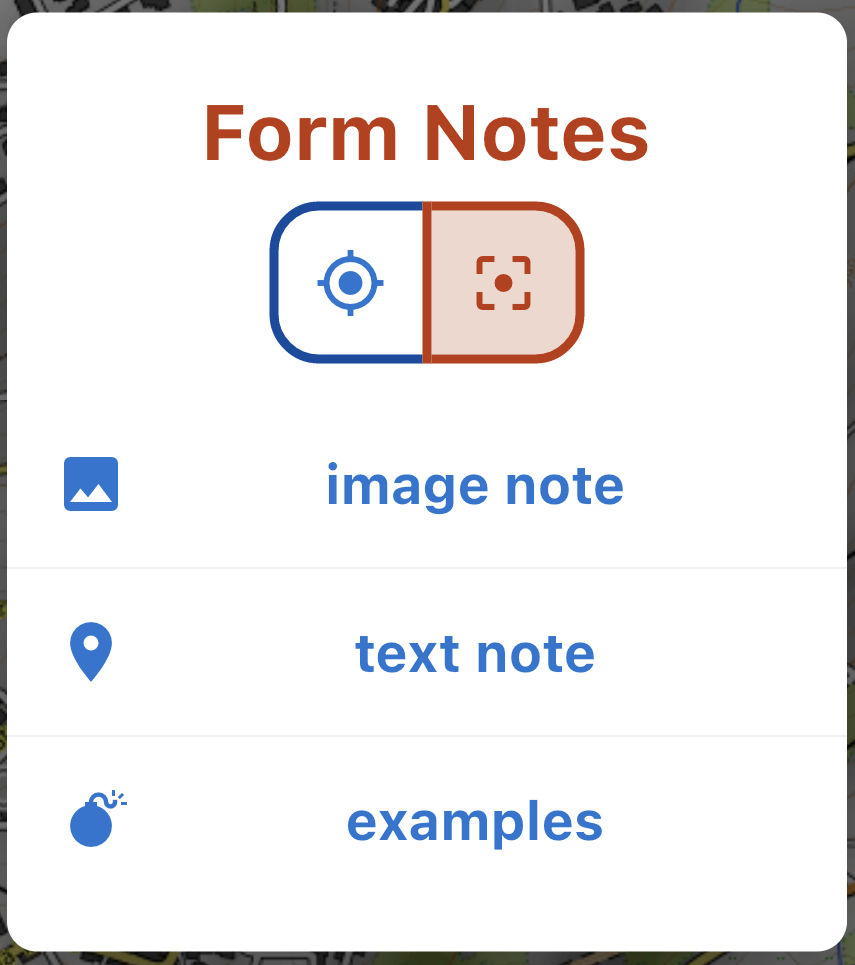
The add form note dialog. Icons are supported.
Form based notes allow you to take complex notes containing detailed information. Some example forms are included in the installation of SMASH.
The examples entry in particular shows all the possible form widgets available:
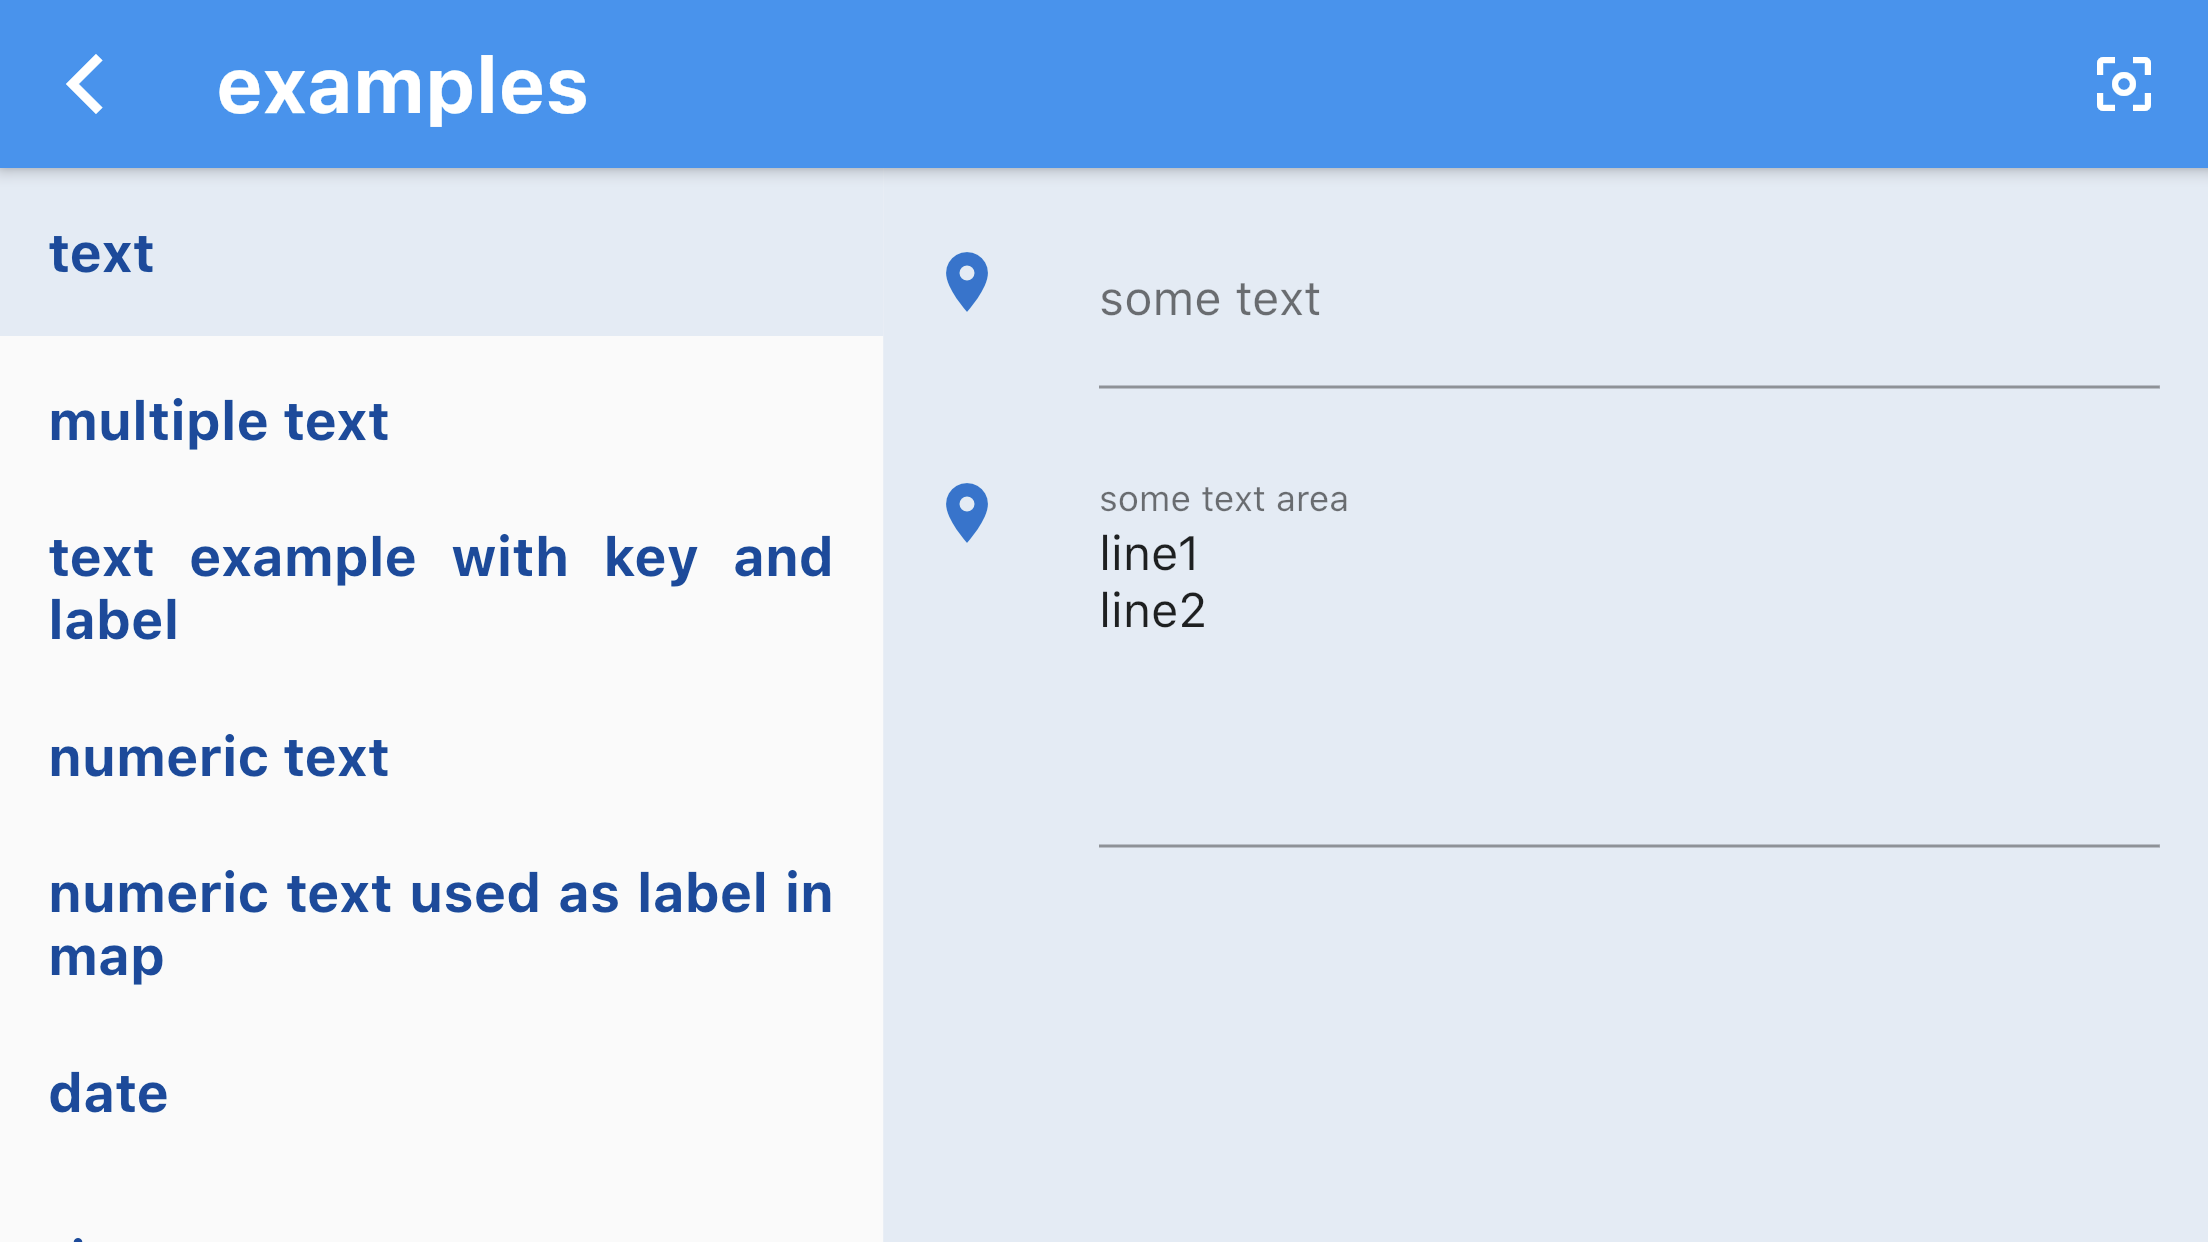
An example of form based notes.
The notes can be saved and modified at any time.
To understand how to create forms, have a look at the dedicated section in the geopaparazzi project. The two projects share the exact same project and form format.
There is only one thing in which SMASH And geopaparazzi forms differ and that is icons. SMASH supports icons in the single note definition but also in the definition of each widget.
To add an icon to the form definition, a tag sectionicon needs to be added to the section. This can be seen in the example forms, ex:
...
  {
    "sectionname": "text note",
    "sectiondescription": "a simple text note",
    "sectionicon": "fileAlt",
    "forms": [
      {
        "formname": "text note",
        "formitems": [
          {
            "key": "title",
            "value": "",
            "icon": "font",
            "islabel": "true",
            "type": "string",
            "mandatory": "no"
          },
          {
            "key": "description",
            "value": "",
            "icon": "infoCircle",
            "type": "string",
            "mandatory": "no"
          }
        ]
      }
    ]
  },
...
The same goes for formitems, that can feature an icon tag.
The icon name itself can be looked up in the [icon section] of SMASH.
4.2.5. Form Based Notes List
Same as for simple notes, when long tapping on the button, the user is led to the list of form notes.
4.2.6. Form Based Notes visualization
Same as for simple notes, when tapping twice on the button, the settings for the notes view mode opens.
4.3. GPS Logging
To start logging, the user simply has to push the GPS log button.
Once it is tapped, the user is prompted to insert a name for the log or to accept the one generated based on the current date and time (log_YYYYMMDD_HHMMSS).
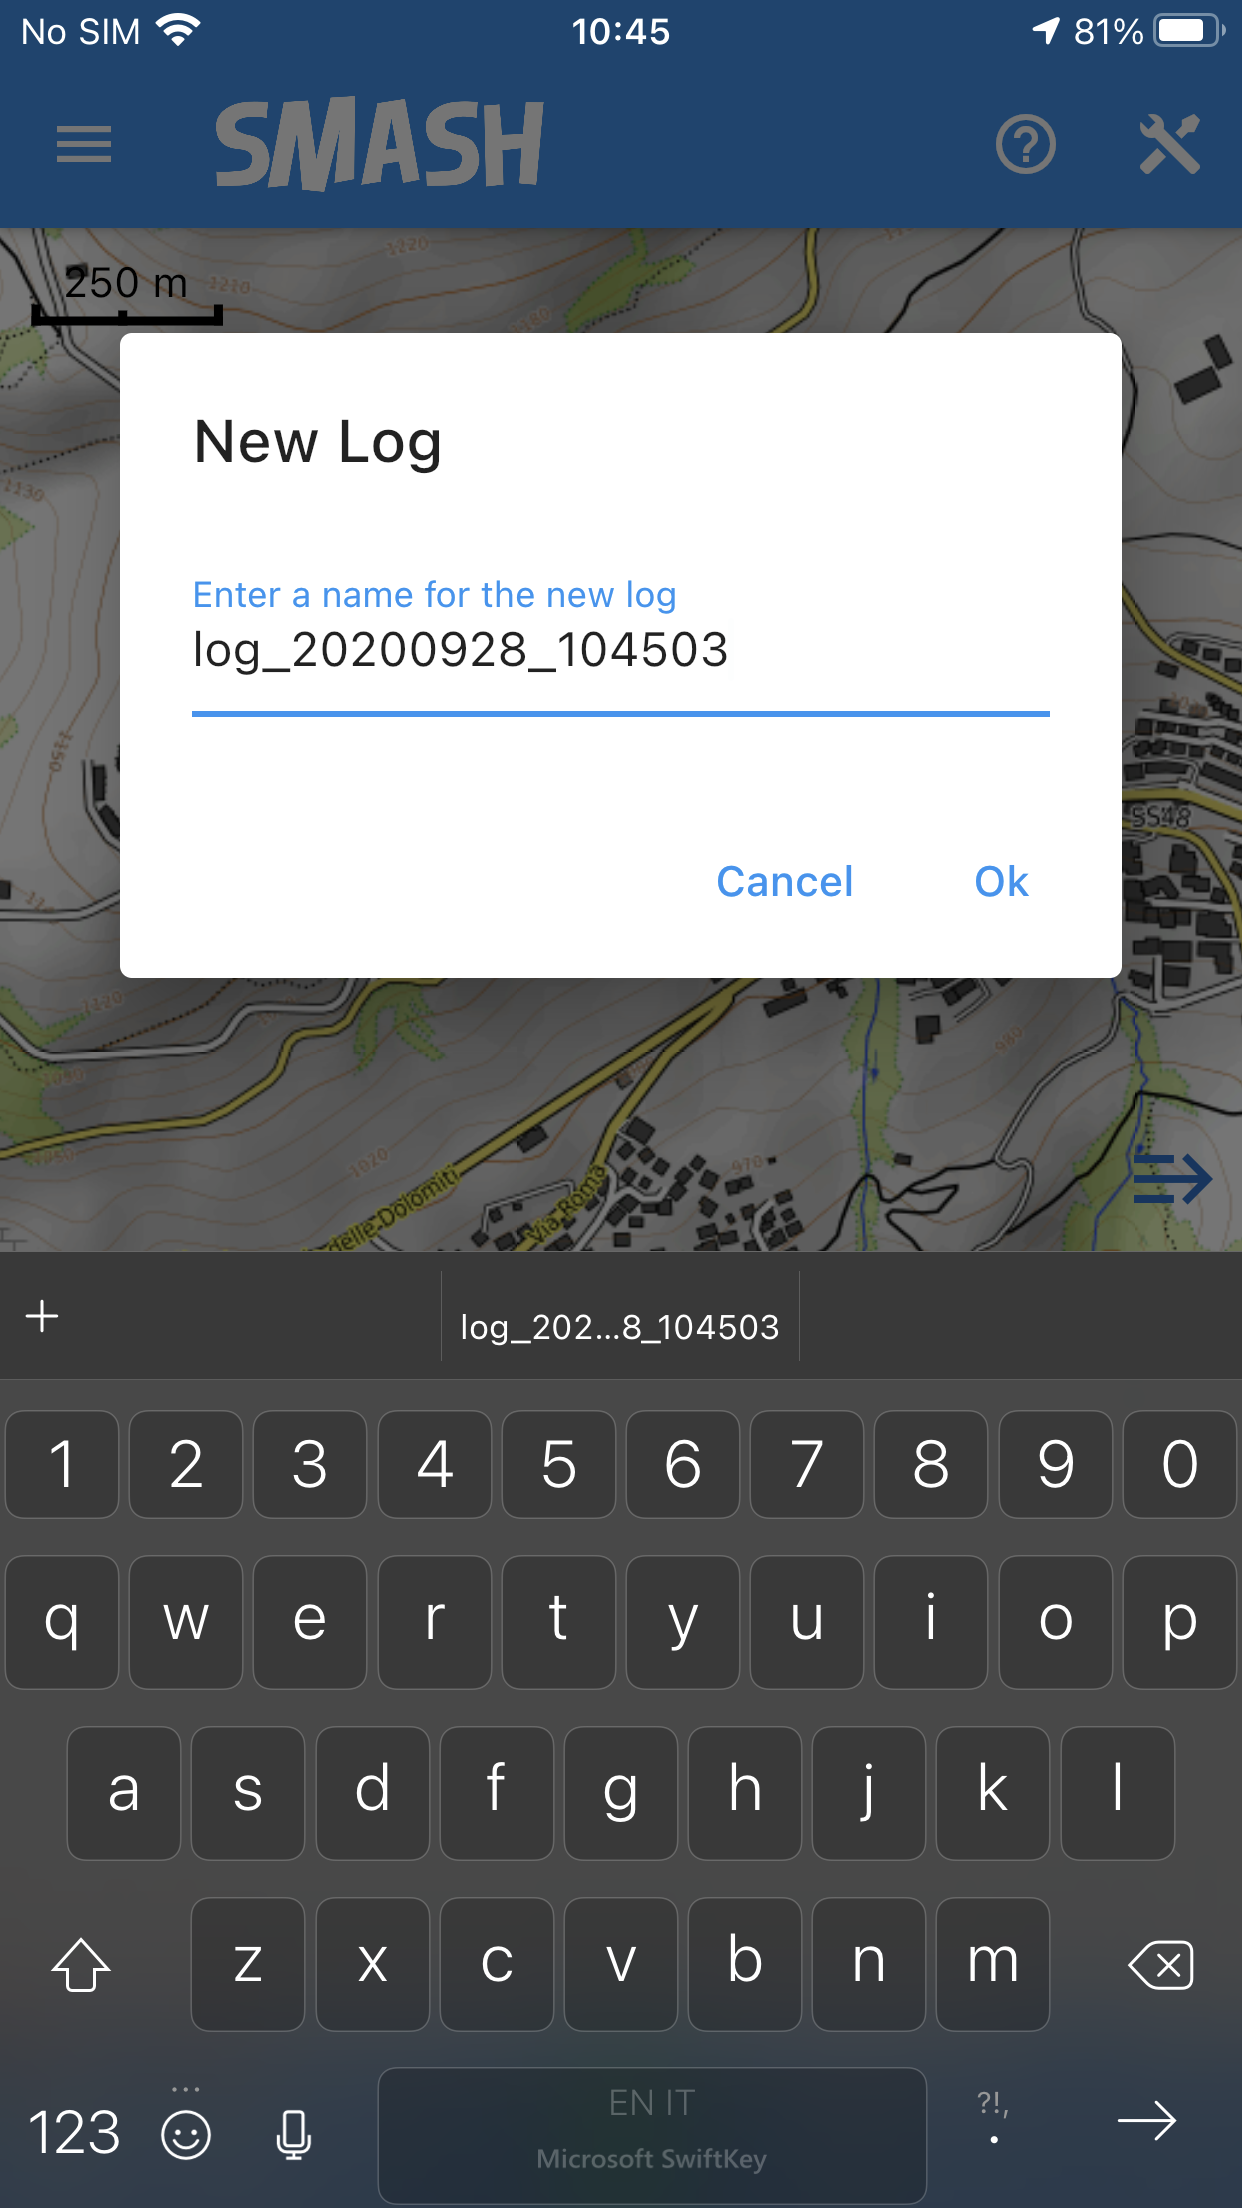
The new GPS log dialog.
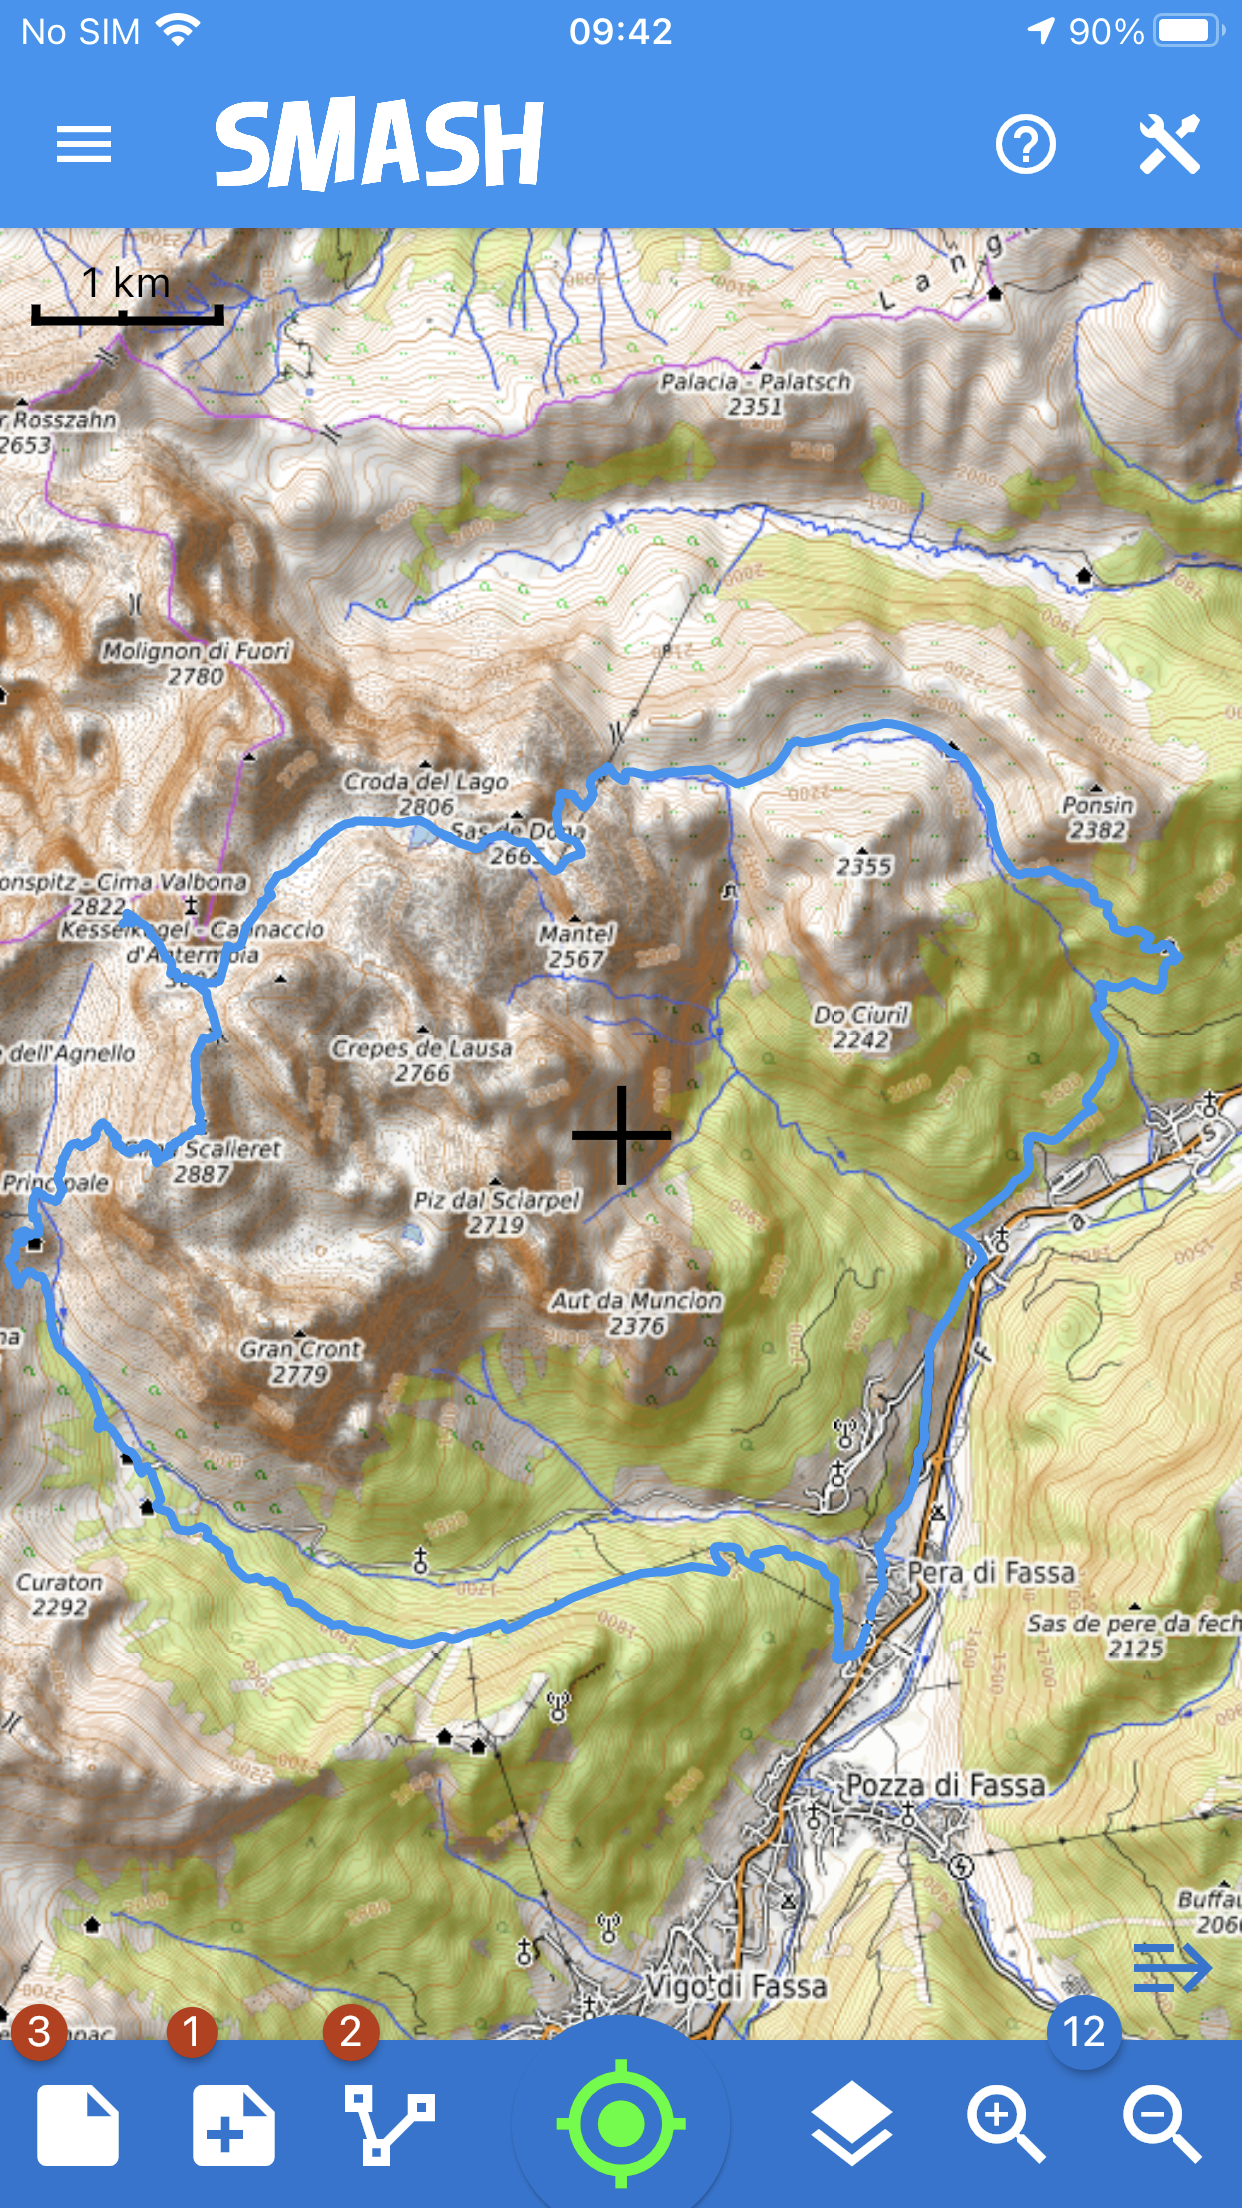
Once logging has started, both the GPS logging button and the GPS status icon will turn blue.
The GPS logging button with its blue (currently logging) color.
While logging some log information are displayed in a box on the top right of the application window. This information are about the cumulated time and distance of the log. The distance has two values, one calculated with raw data and the other by applying the Kalman filter (see GPS Settings). The first value is the one defined in the settings and the other one is indicated in brackets.

The GPS logging info box.
On Android devices where the GPS position notification message is dynamic, in the notifications of the device there are all the information about the GPS status and logging information. The title of the notification shows the logging operation and in the second line time and distance from starting point of the current log is displayed.
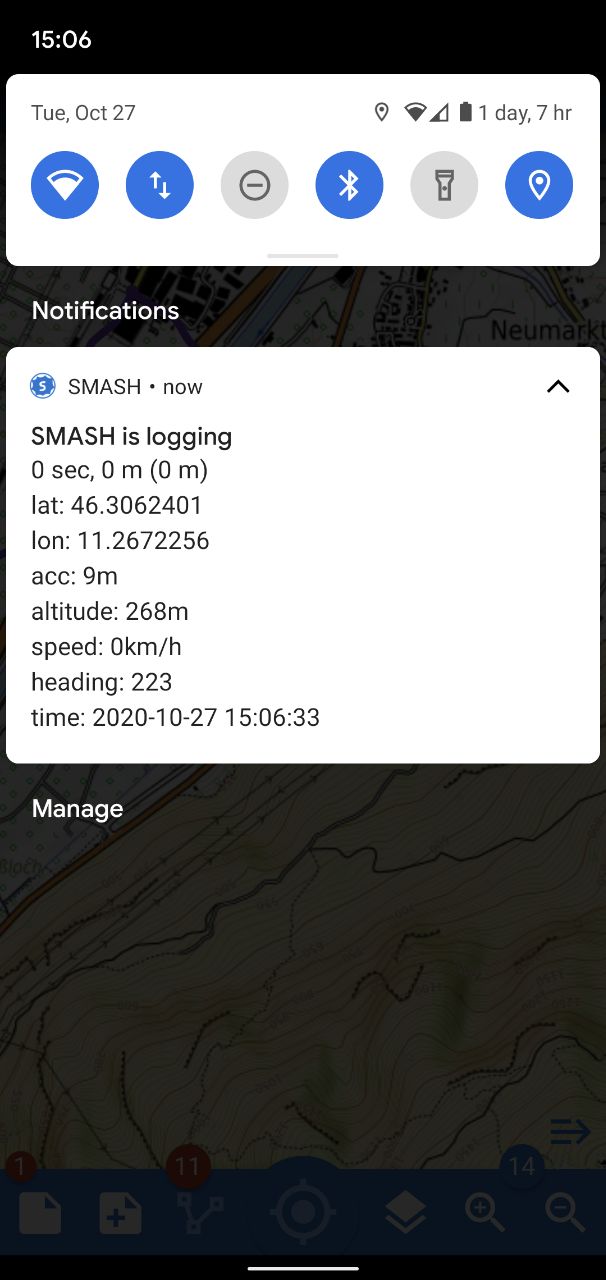
The visualization of the GPS notification on an Android device.
To stop logging, the same button is used. Once tapped, you are prompted to verify the action.
4.3.1. GPS Logging List
Same as for the notes, when long tapping on the GPS log button, the user is led to the list of GPS logs.
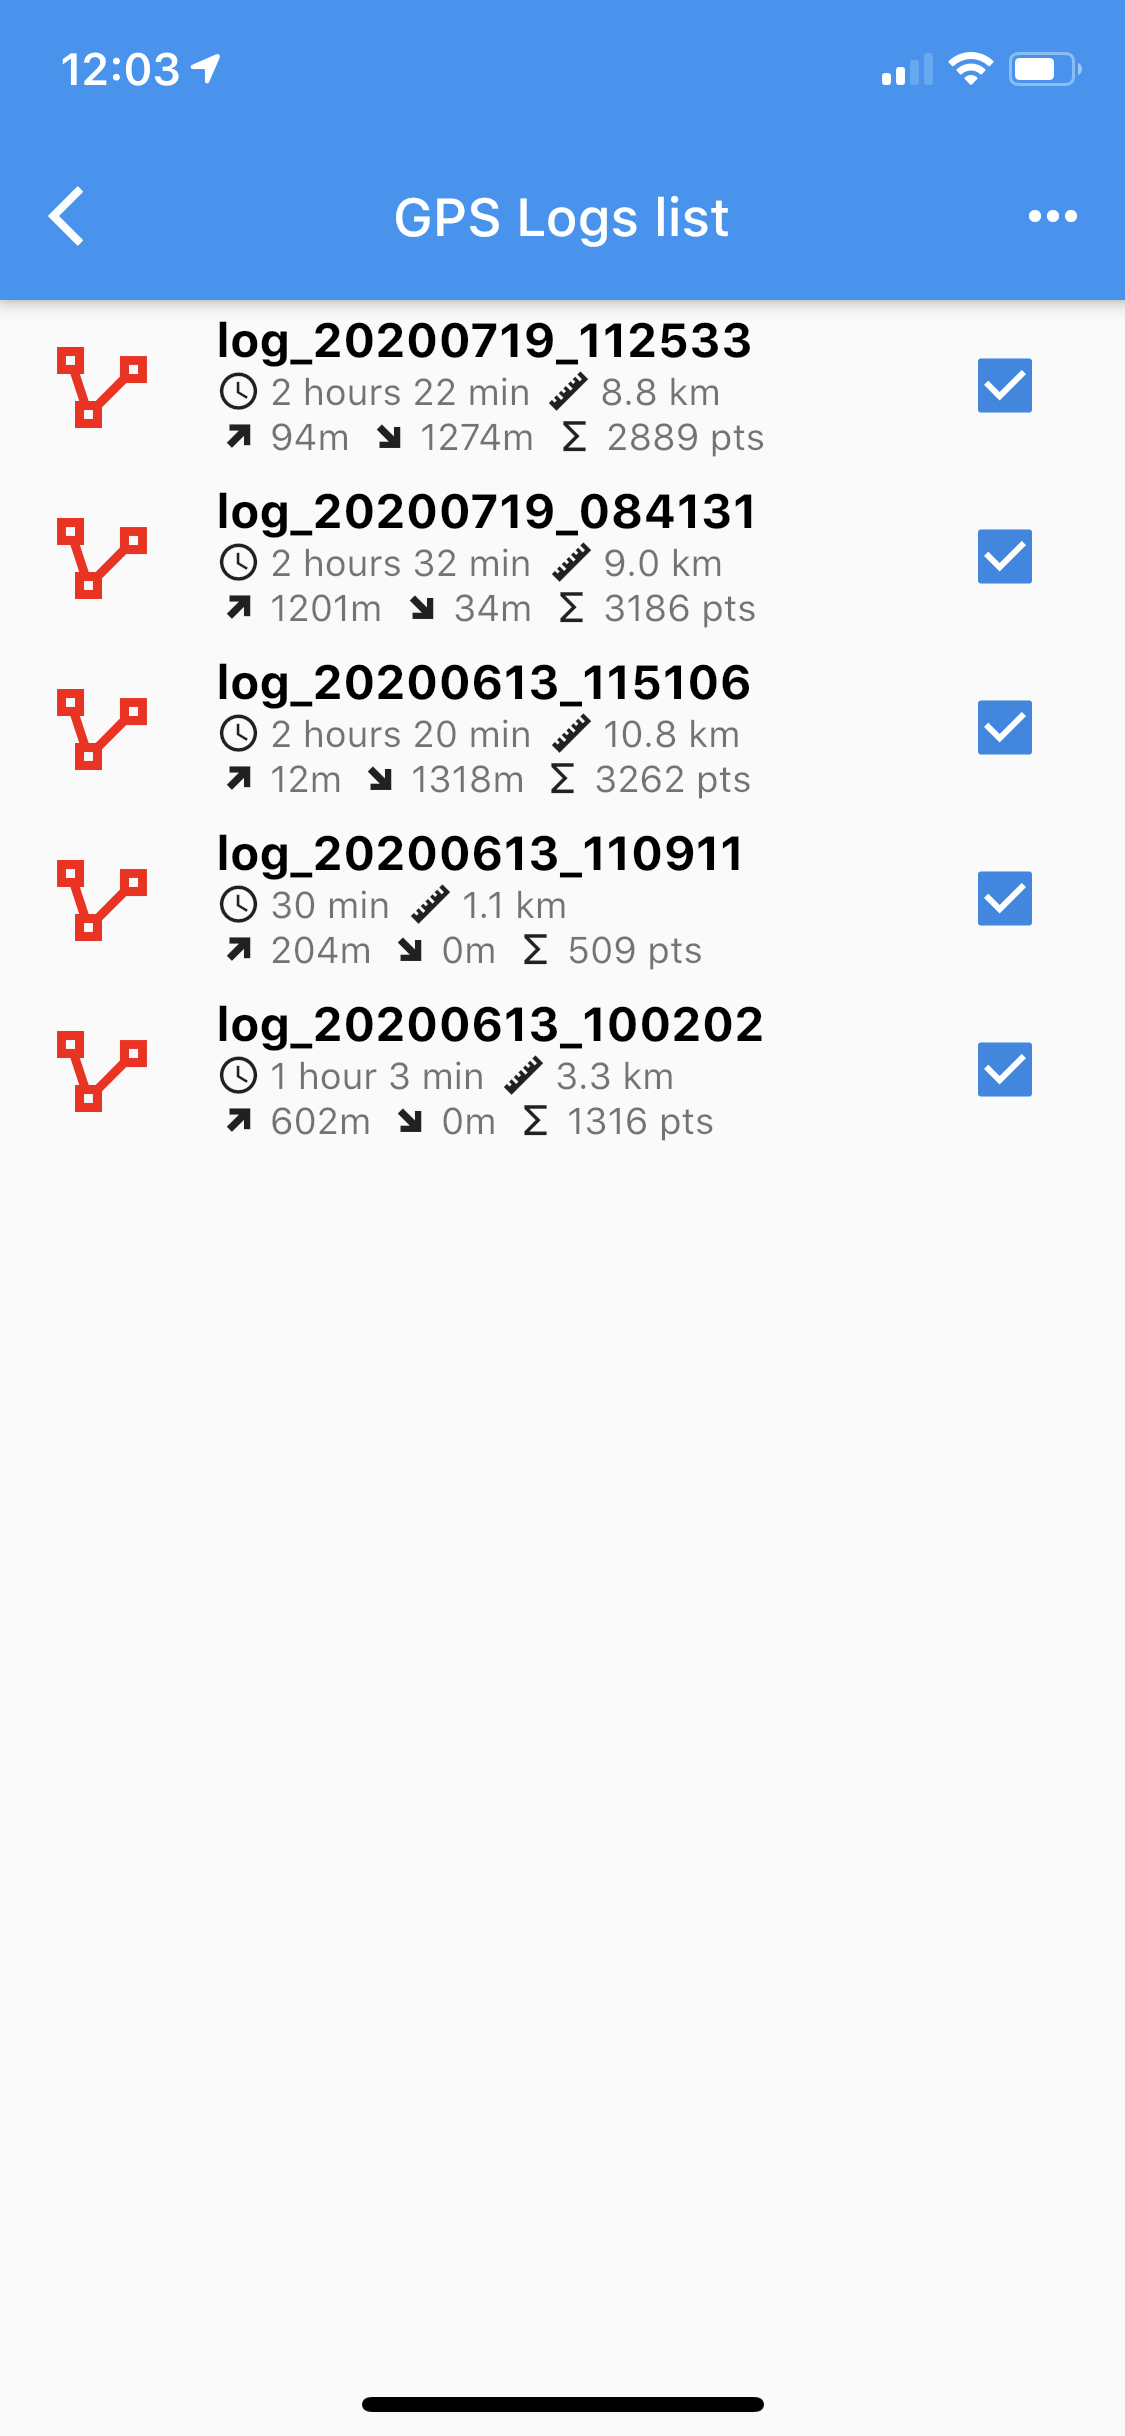
The GPS logging list view.
From here GPS logs can be zoom to or it is possible to modify the style of the selected GPS log and visualize the profile (swipe log to the right), and export to GPX or delete it (swipe log to the left).
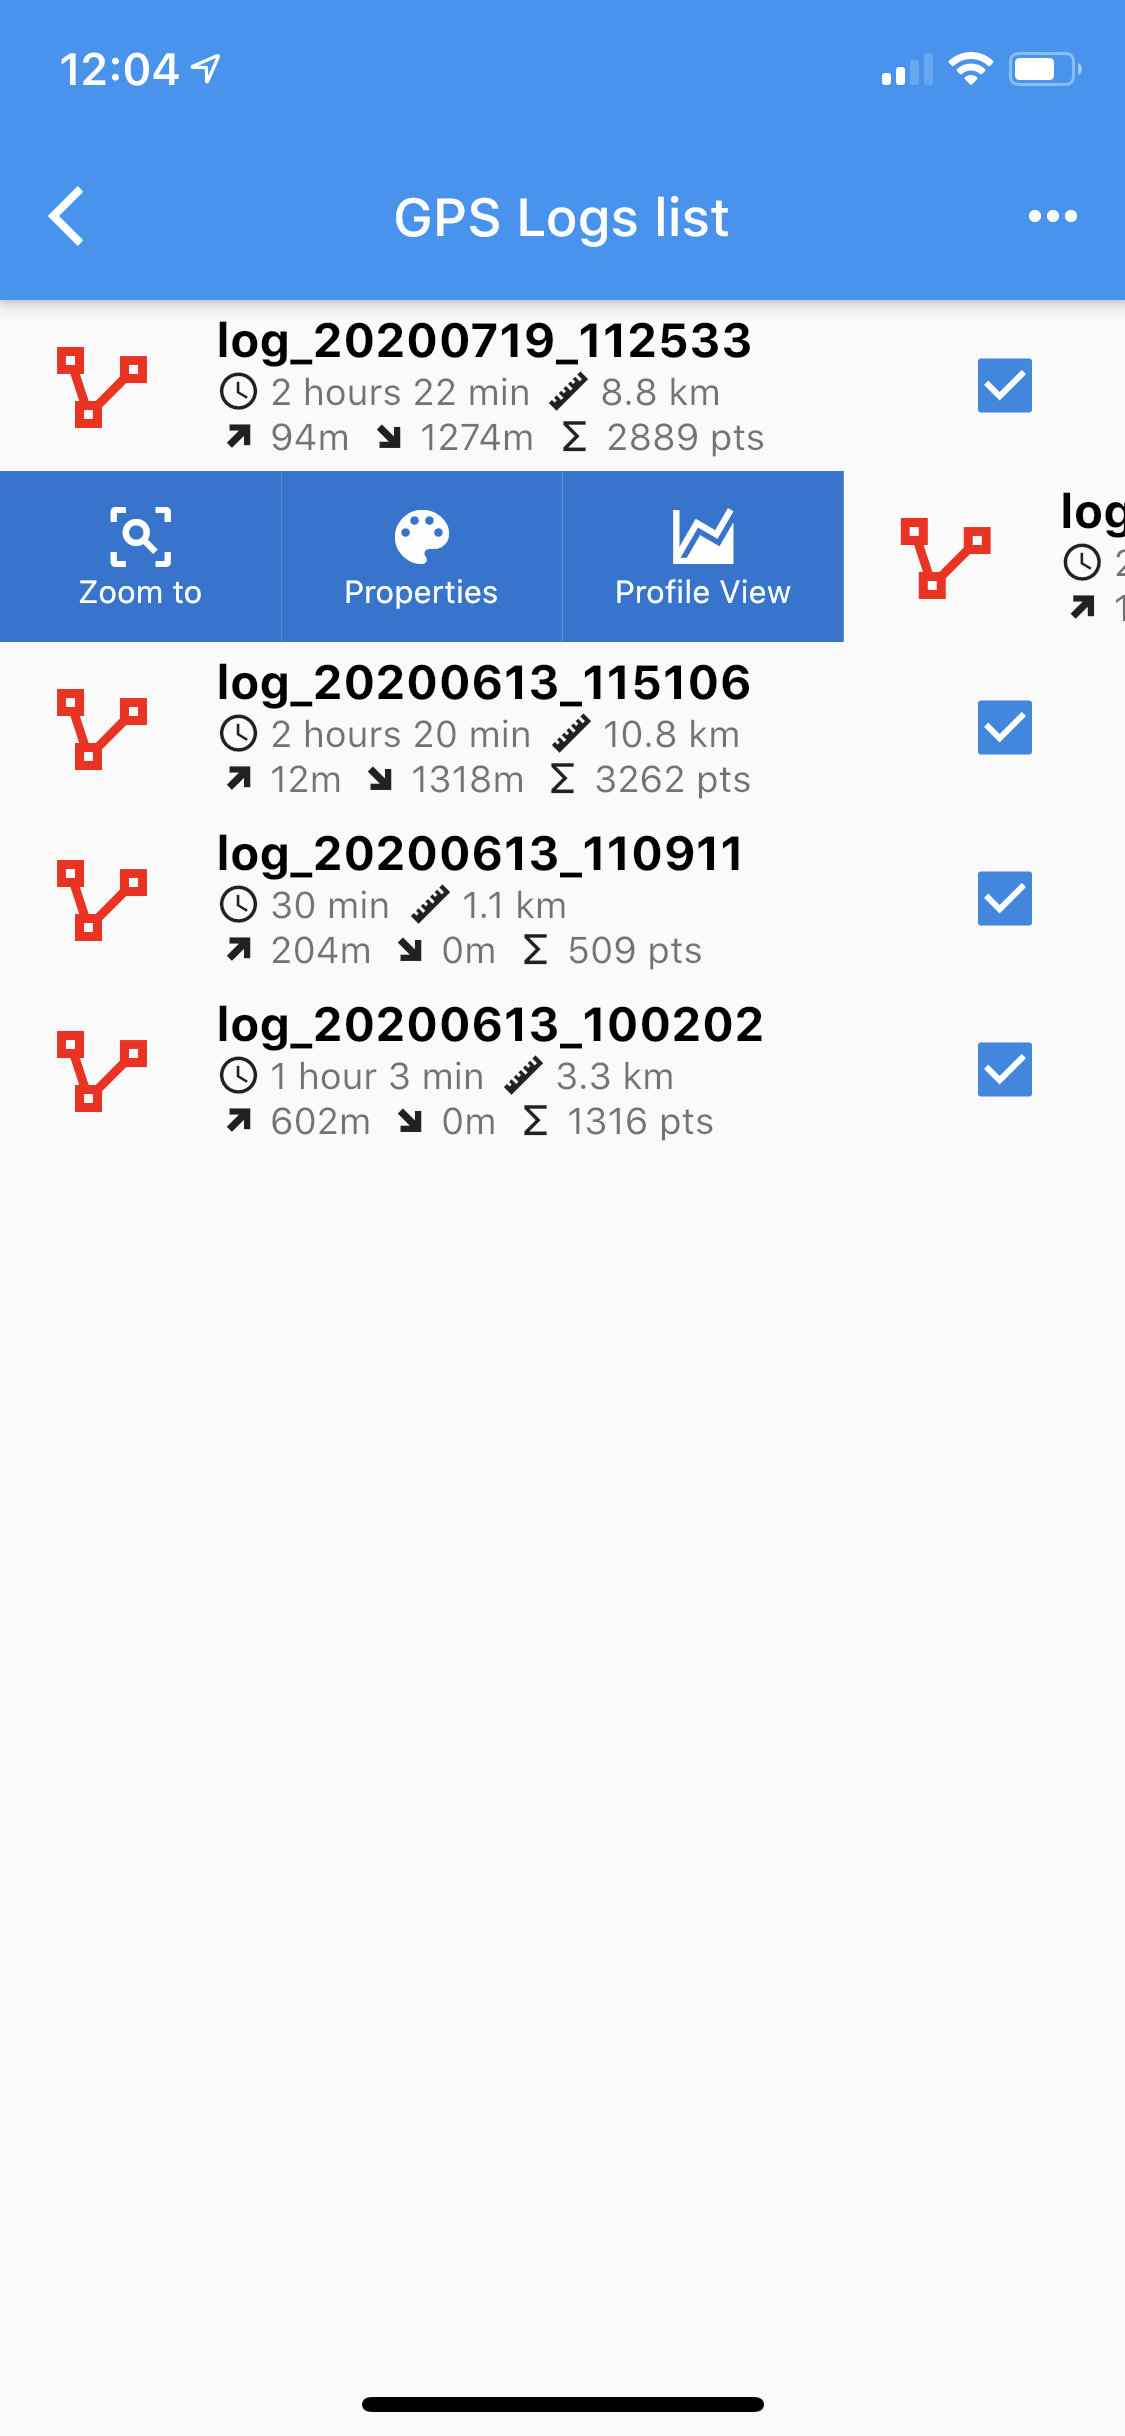
The options available for a single GPS log in the GPS logs list.
The visualization of the profile opens the GPS Log Profile View where it is possible to analyze the profile and navigate it.
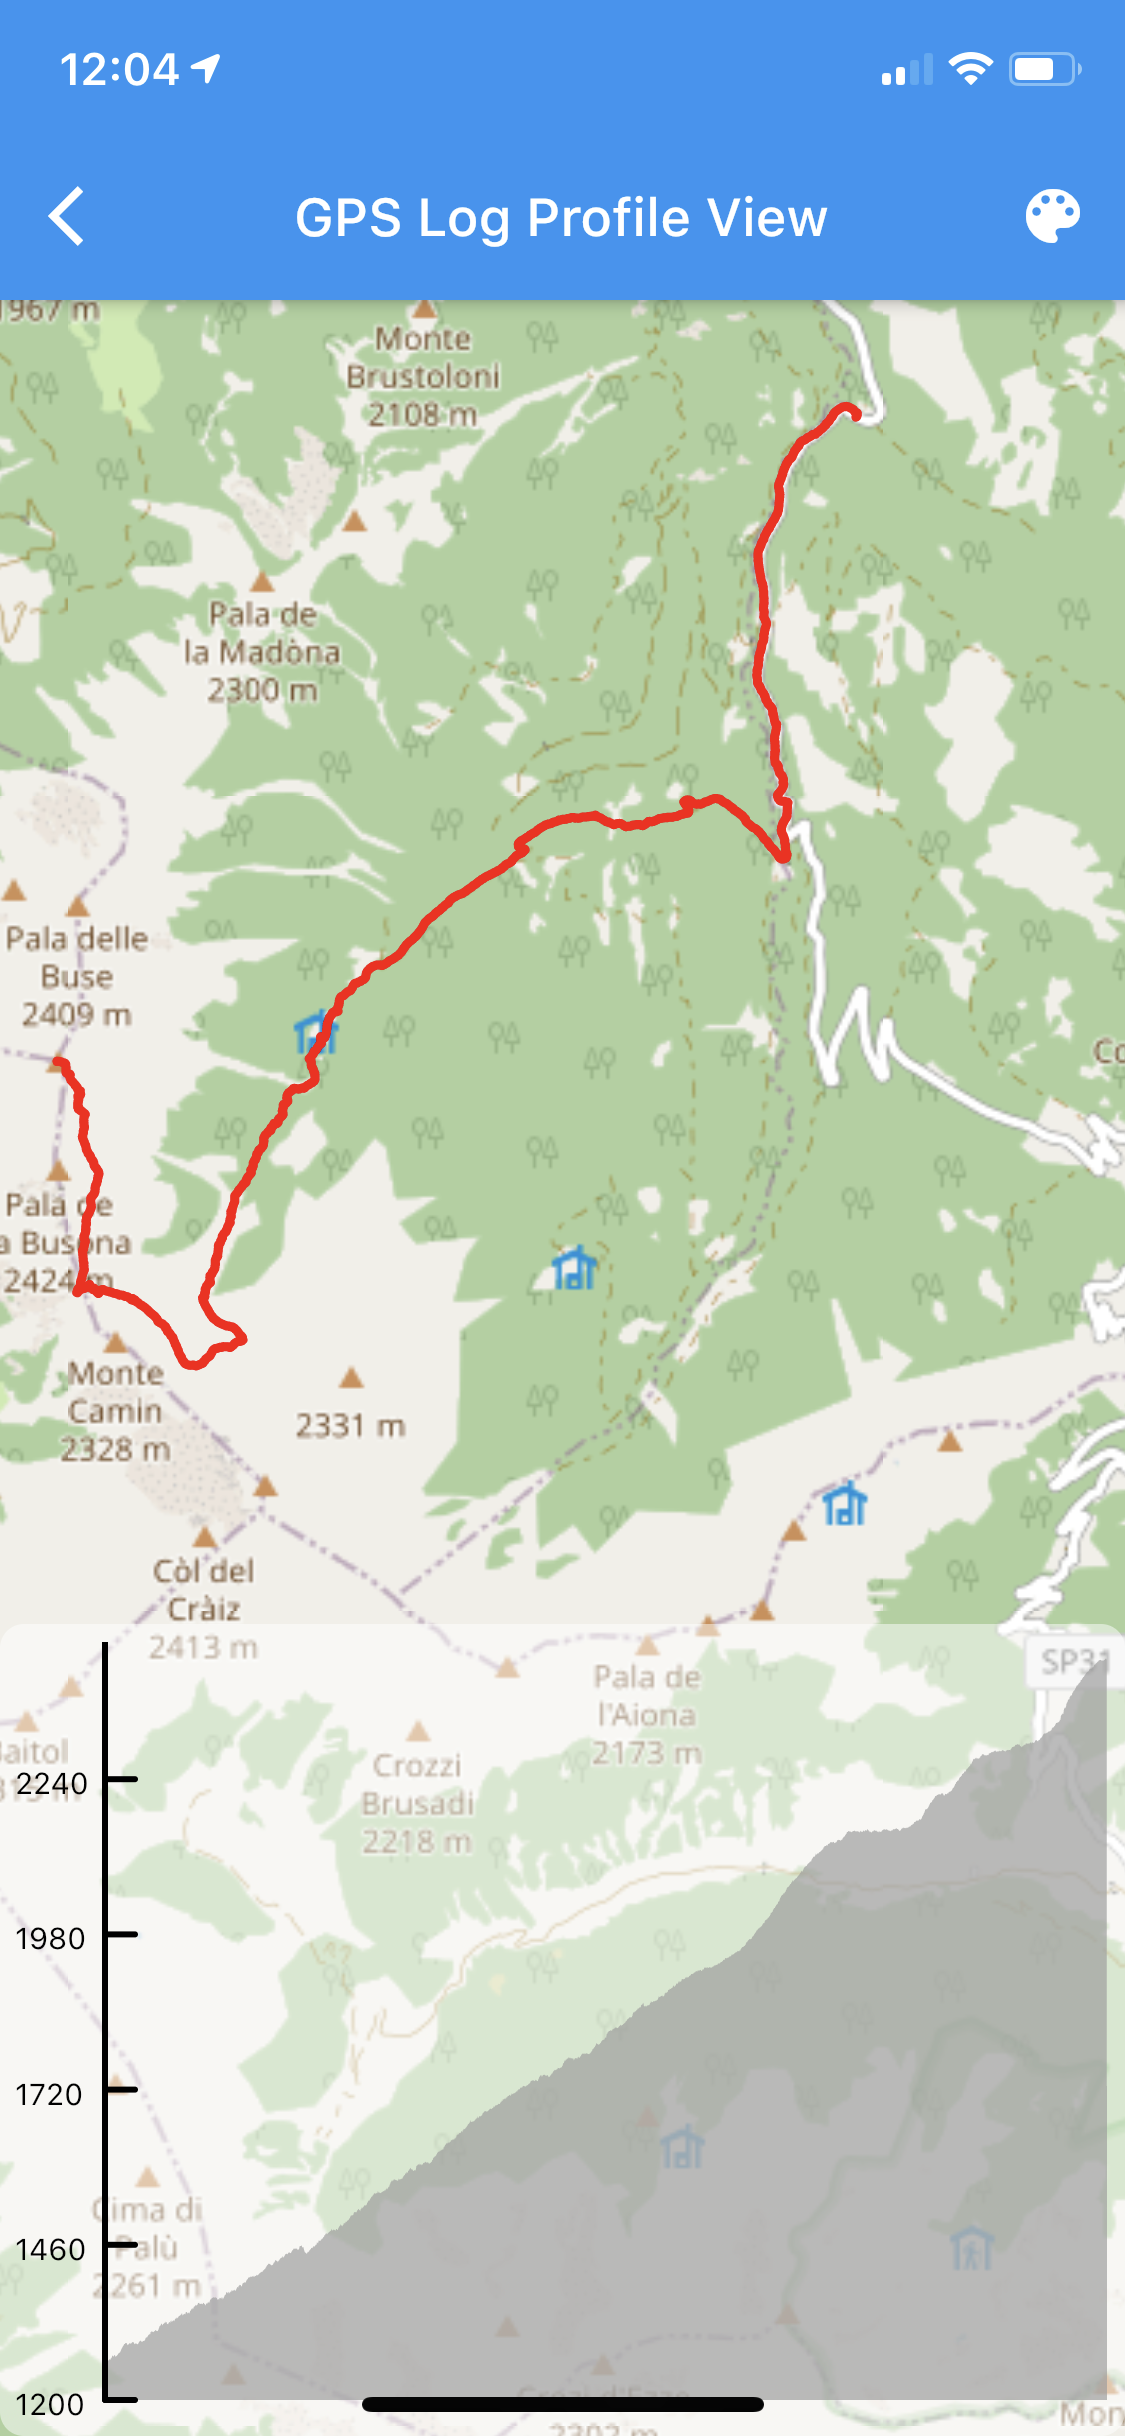
The start of the GPS Profile View.
To query each single moment of the profile just tap and move on the profile chart. All the GPS information and the exact position will be highlited on the map.
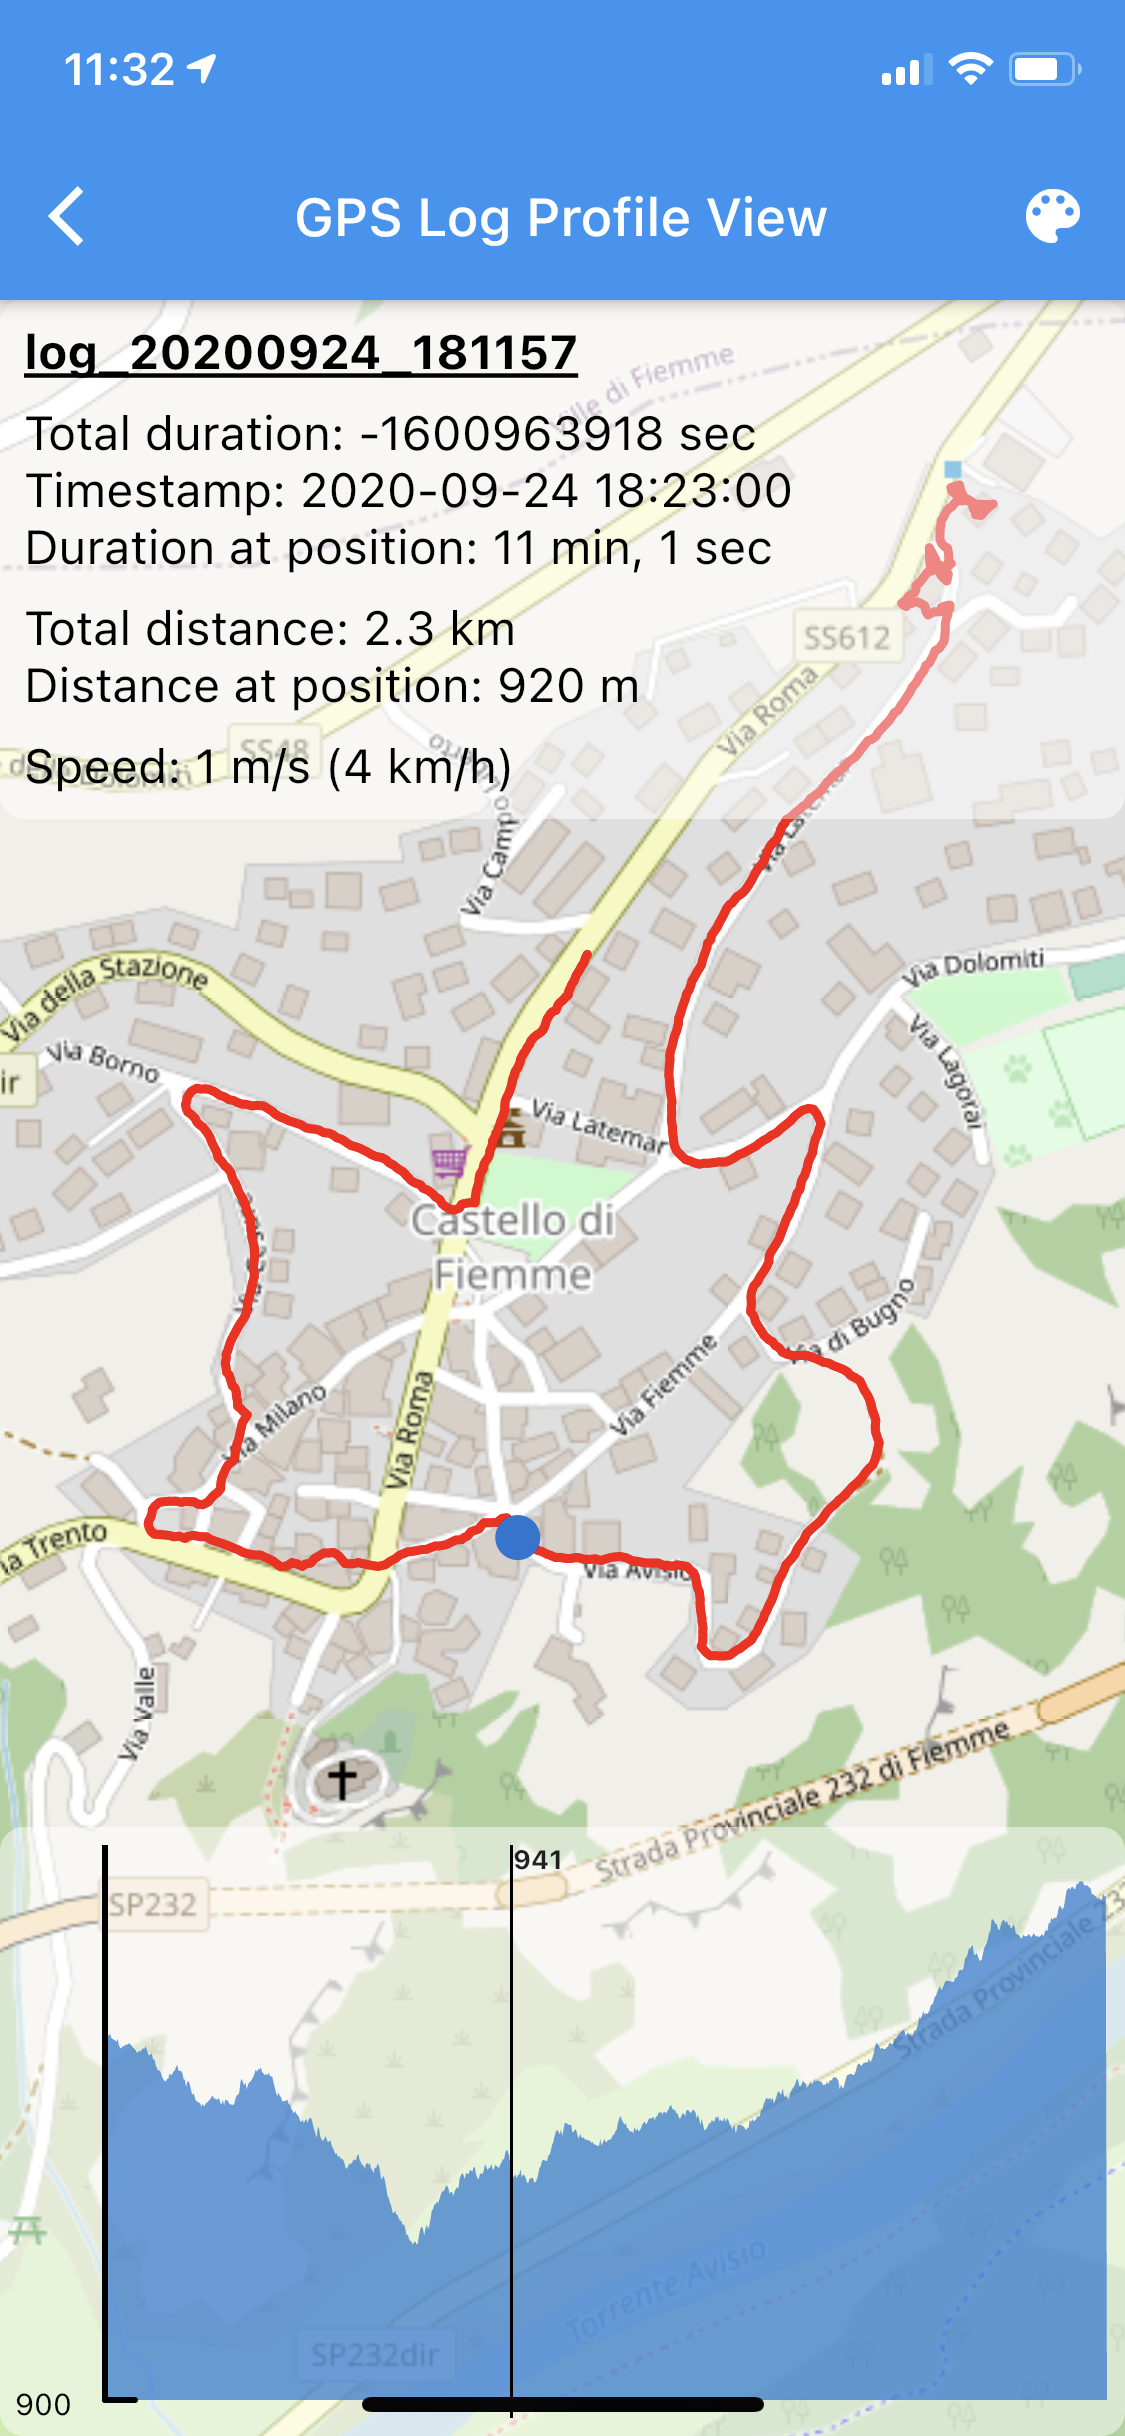
The navigation of the profile of a GPS log.
It is now possible to decide if to use the filtered or the raw data logs in the logs list. Just enter the [GPS settings] and enable the option.
4.3.2. GPS Logging visualization
Same as for the notes, when tapping twice on the GPS log button, the settings for the GPS logs view mode opens.
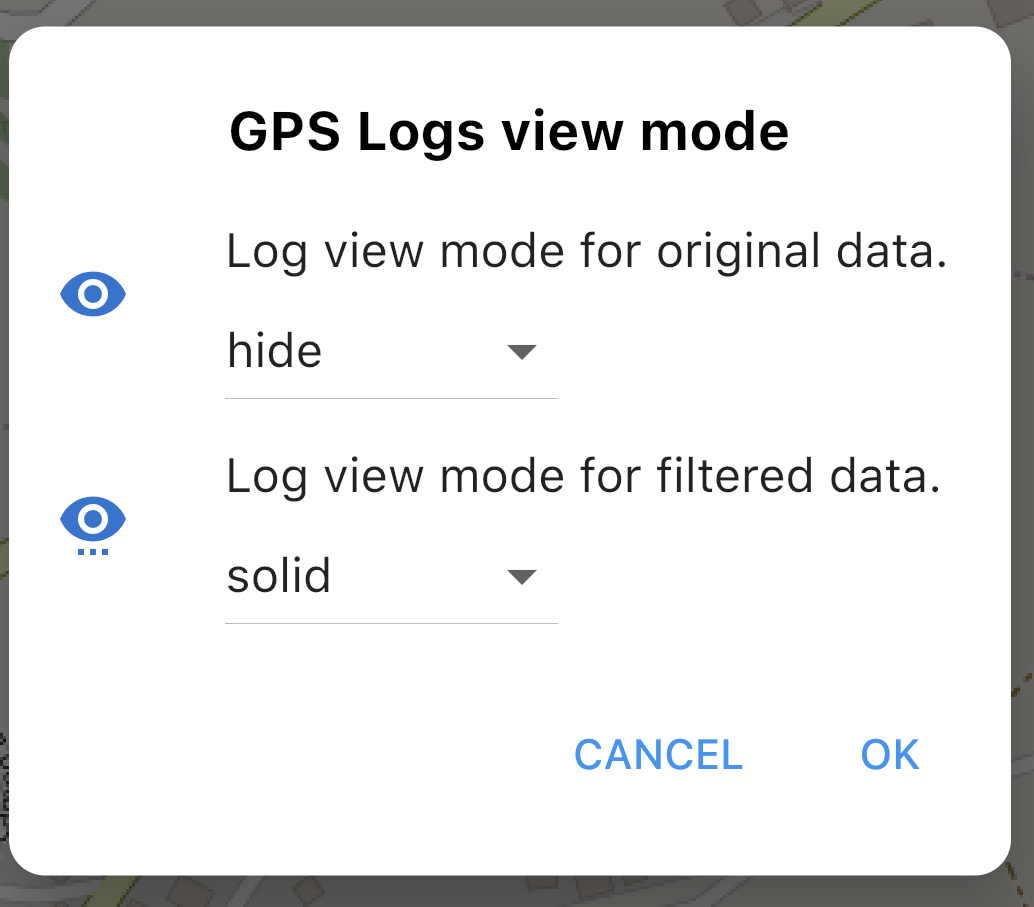
The options available to set the GPS logs view mode.
SMASH uses a mathematical filter on GPS data to correct and homogenize the logs (actually the Kalman filter). In any case the application saves also the original data.
The user can decide how to visualize the filtered and the original data (hide, solid, transparent):
-
visualize the filtered data while hiding the original GPS data
The options available to set the GPS logs view mode.
-
visualize the original and hide the filtered
The options available to set the GPS logs view mode.
-
have the original in transparency and see the filtered
The options available to set the GPS logs view mode.
4.4. The layers list view
The layers list view features the currently visible layers. Since layers on bottom cover layers above them in the map, there is the possibility to change the layers order simply by dragging the selected layer to the new position. The order defines the visualization of all the layers in the map (raster and vector, online and local).
The layers list view.
From this view it is possible to add new layers from the supported map types using the two icons on the top right of the current panel  : the first one to add an online resource and the second one to add a local resource.
If a layer features a bounding area (as vector maps or mbtiles layers), sliding it to the right will zoom the map on the bounding area. The right sliding also enables the possibility to set some visualization properties of the selected layer.
Sliding the layer to the left, allows to remove the layer.
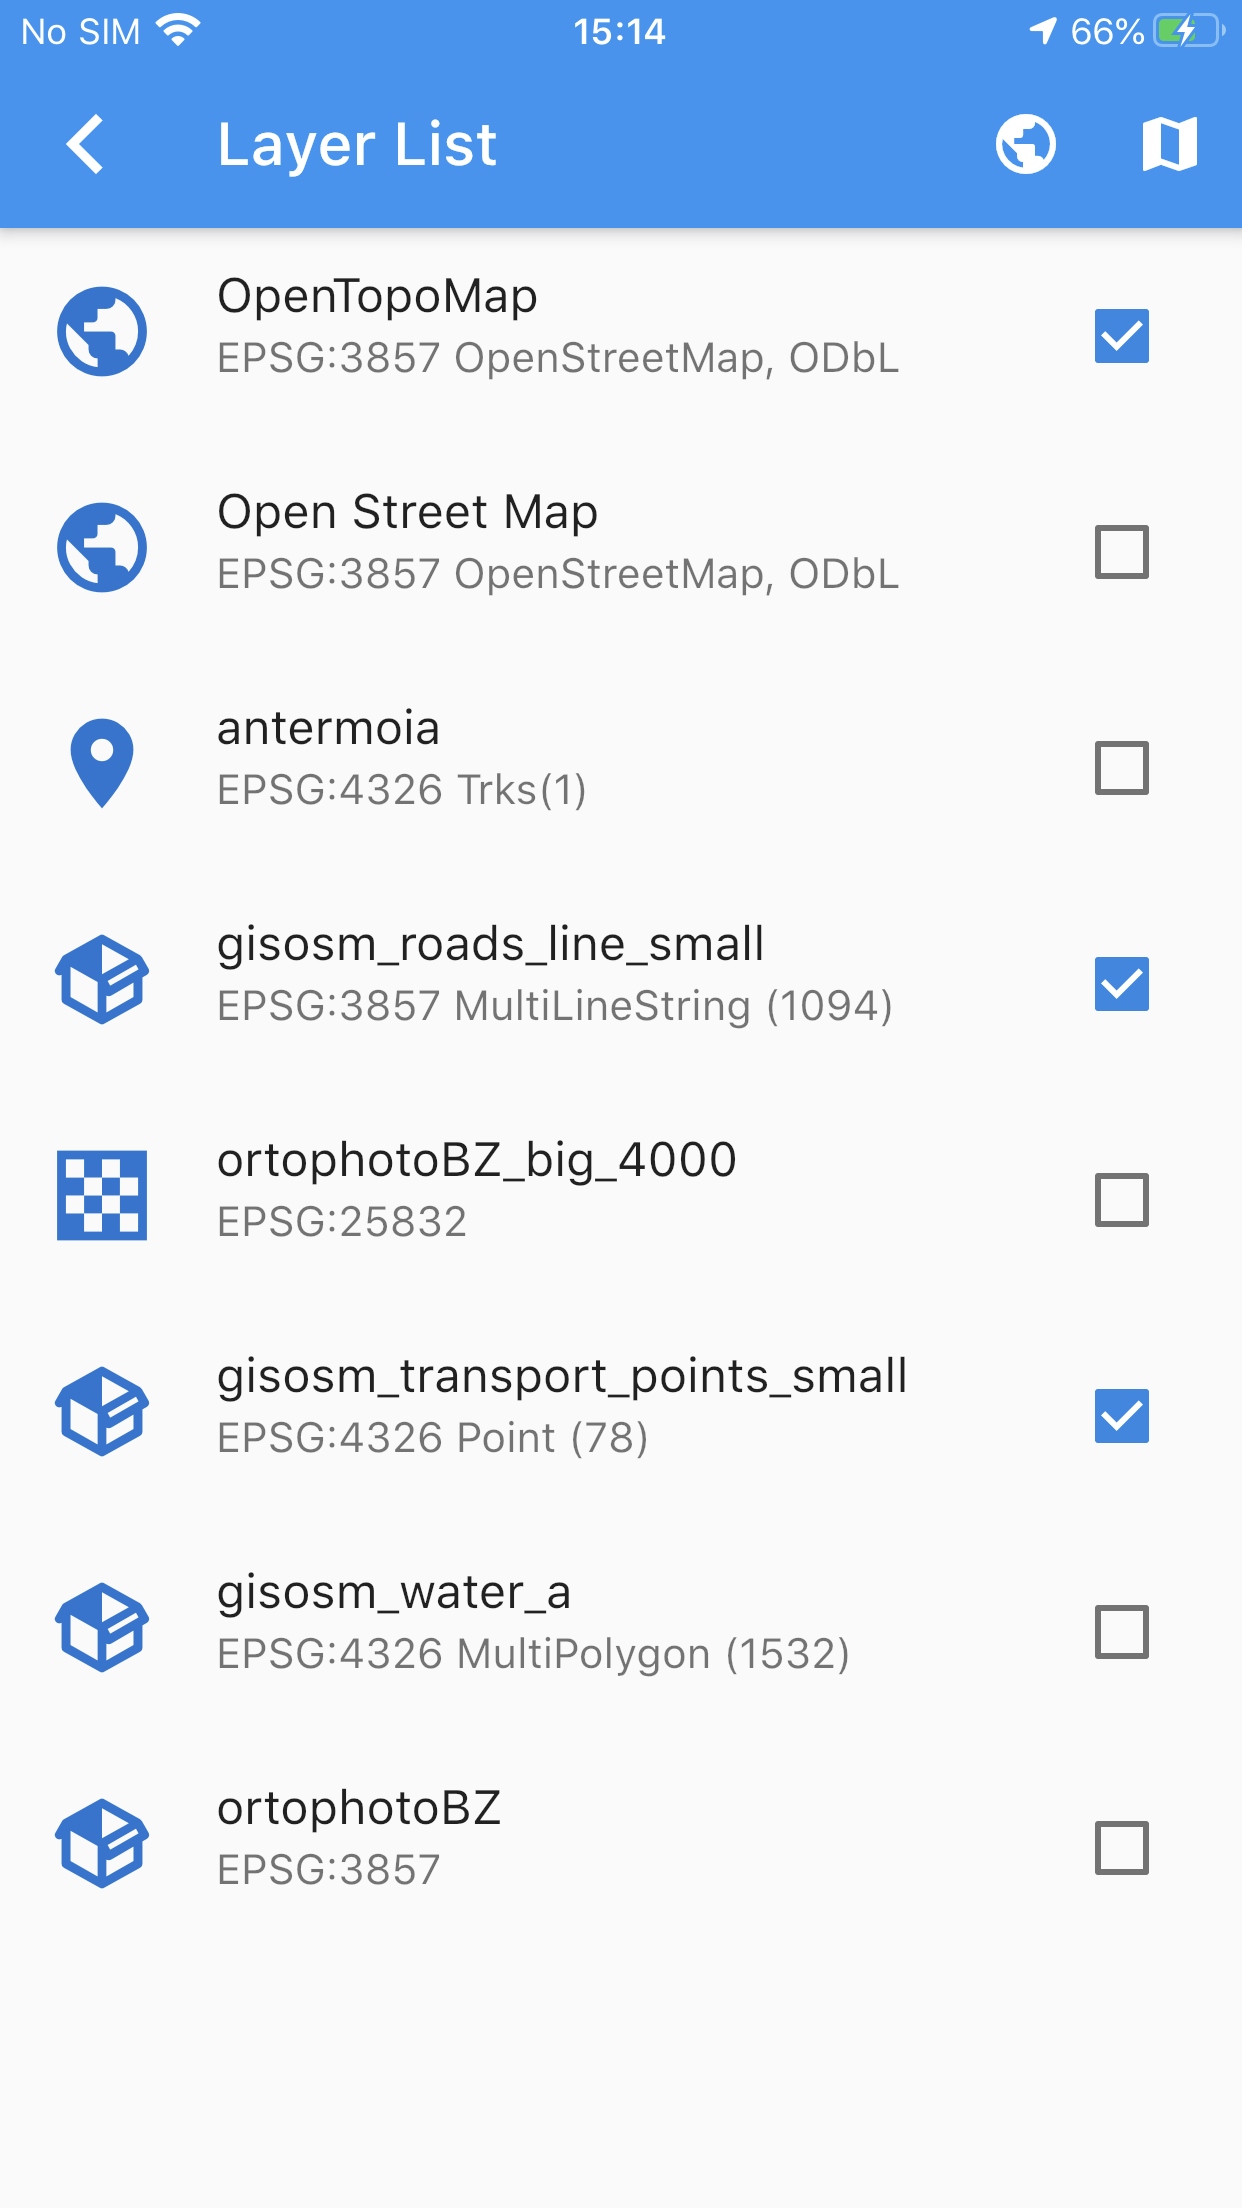
| Local data must have its own projection information file (.prj) both for rasters and for vectors. SMASH supports reprojecting and some CRS are loaded in the application by default. For those projection not yet supported just tap on the layer and follow the instructions. |
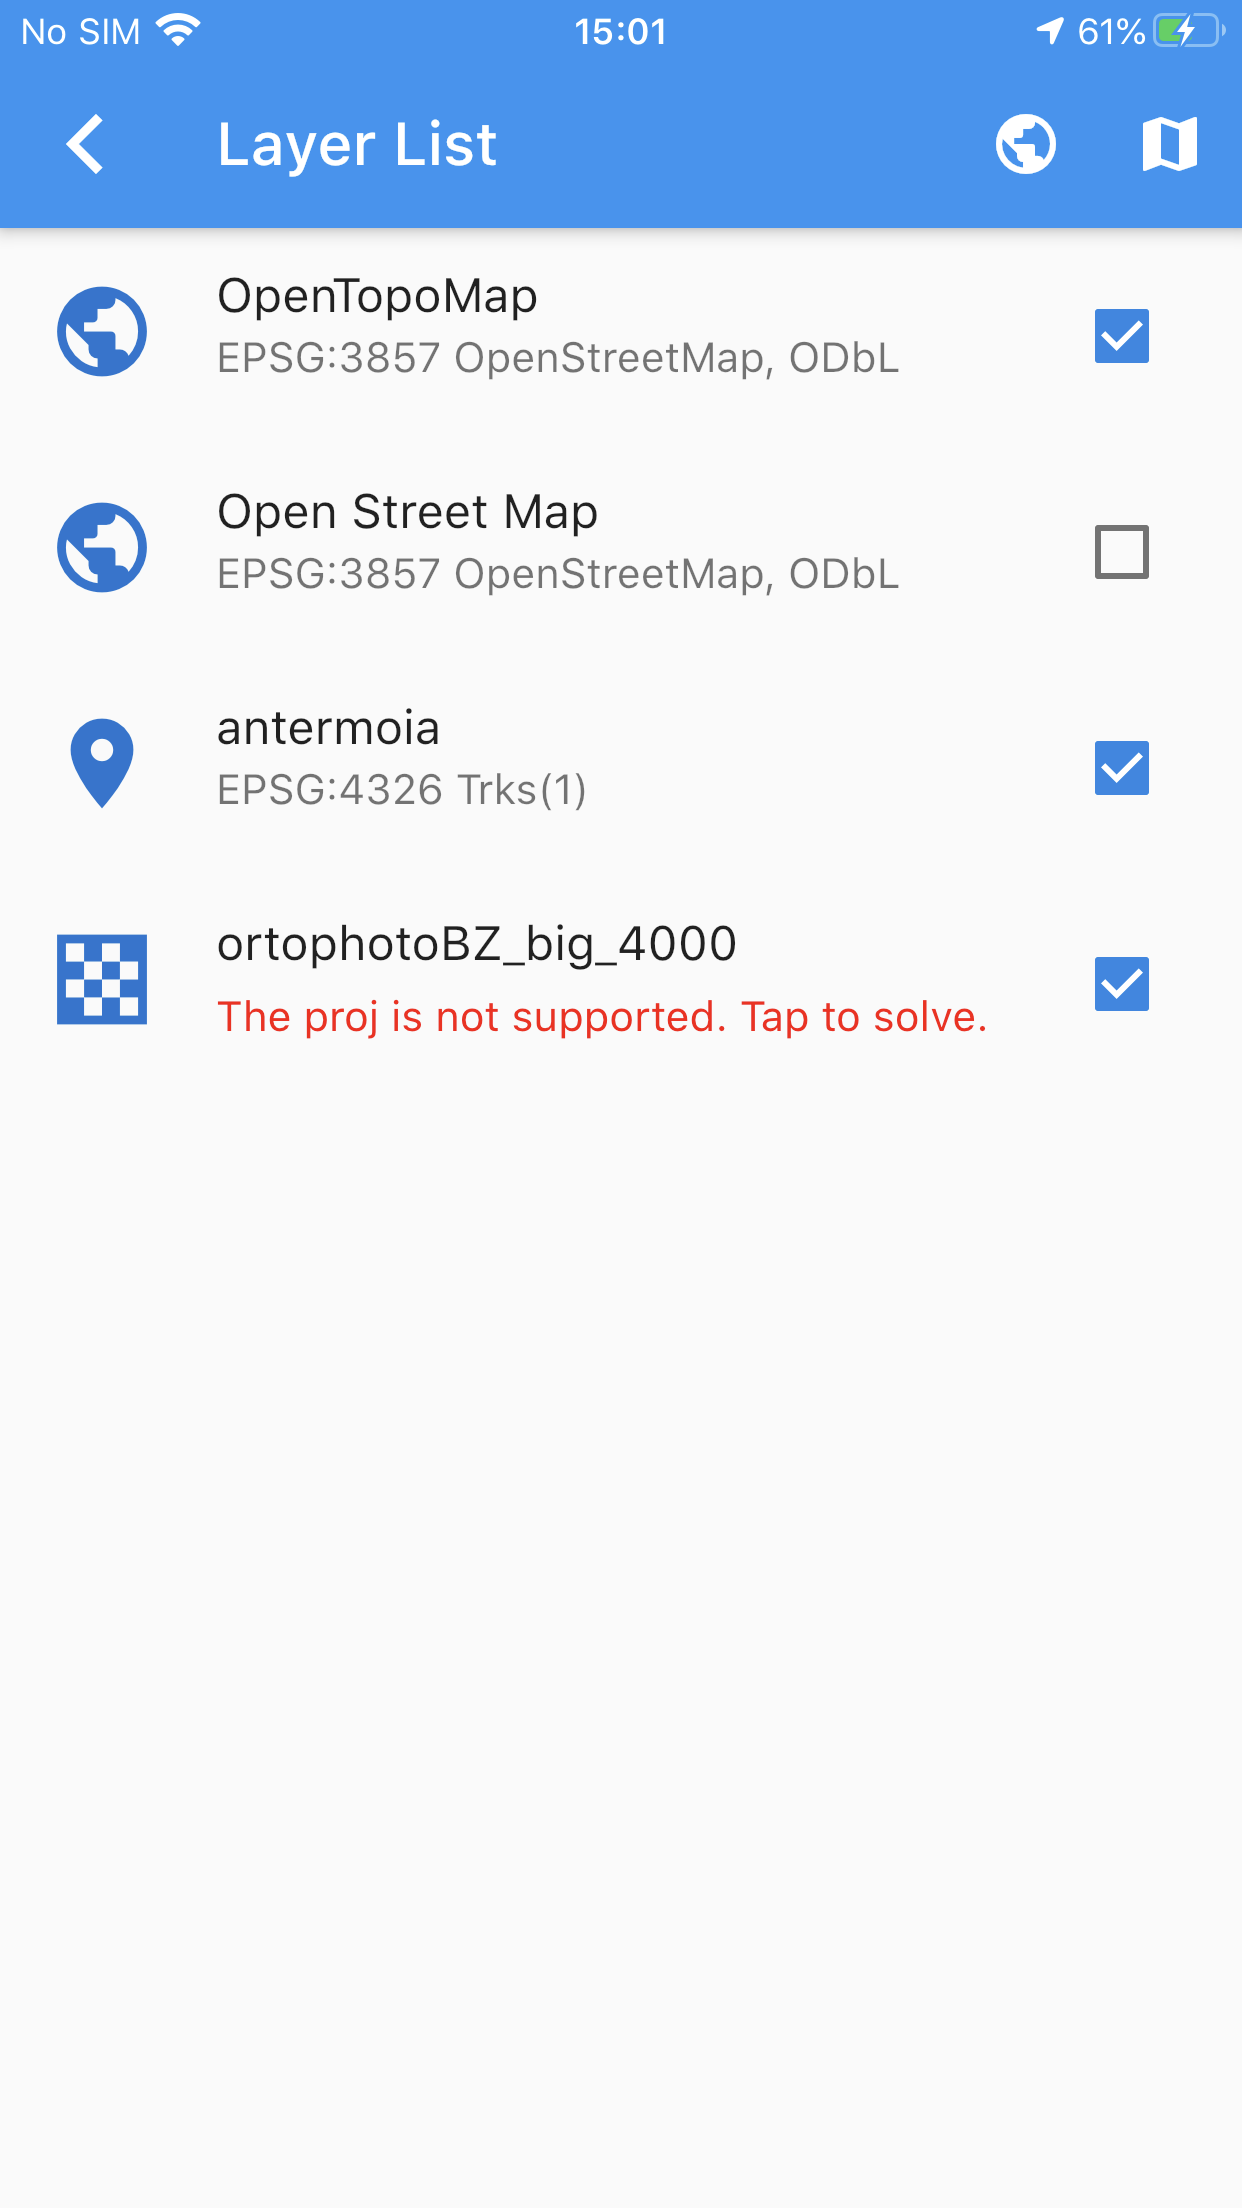
The layers list shows a layer with a projection not supported.
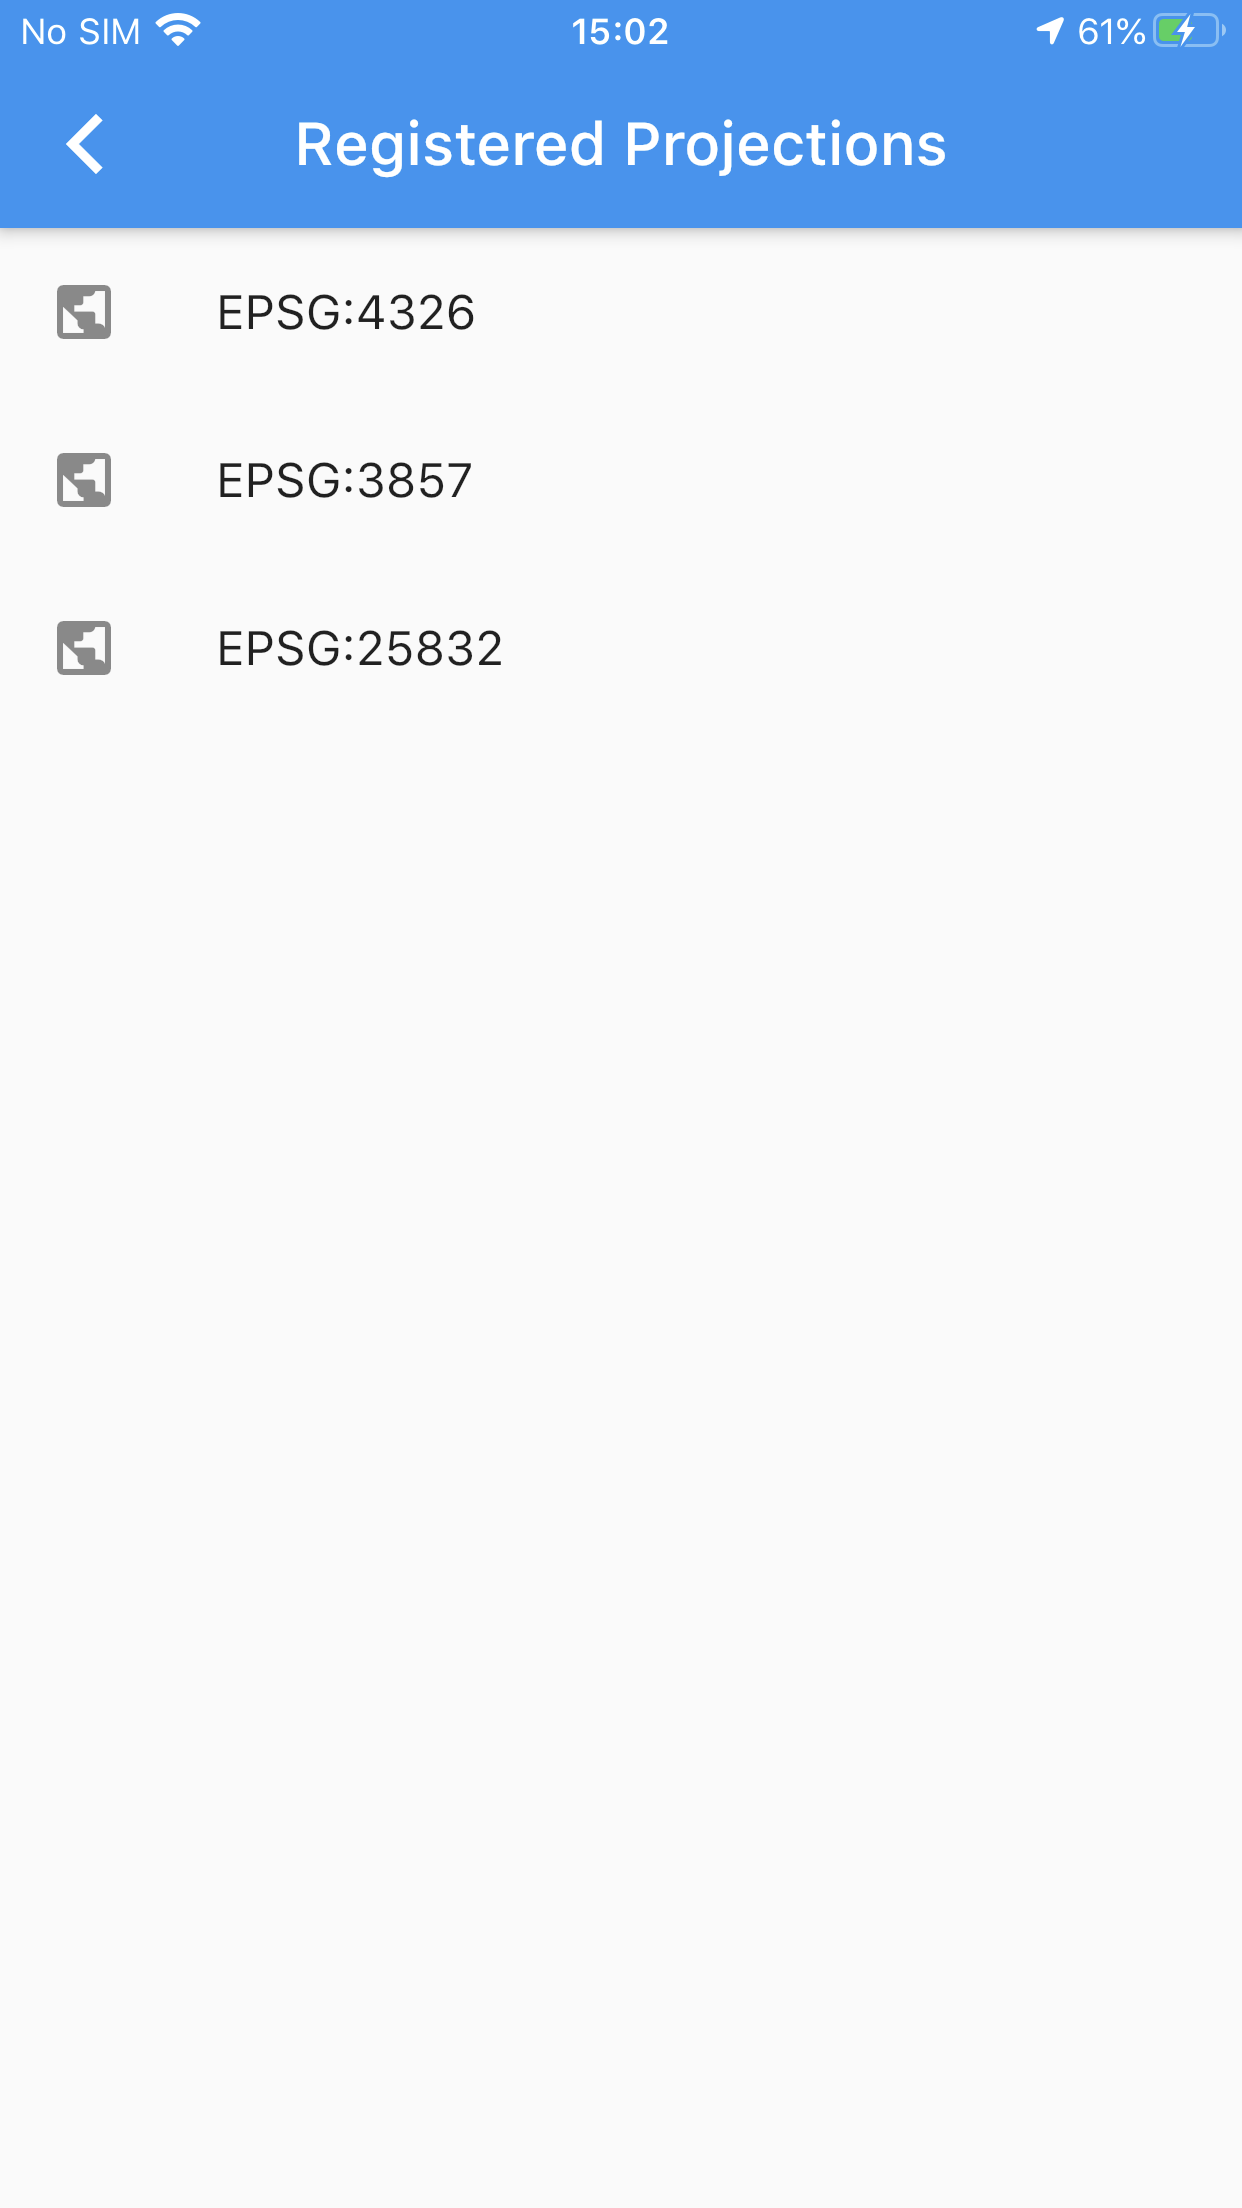
The list of supported projection after adding the new one.
Double tapping on the layers button opens the Layers Plugins dialog.
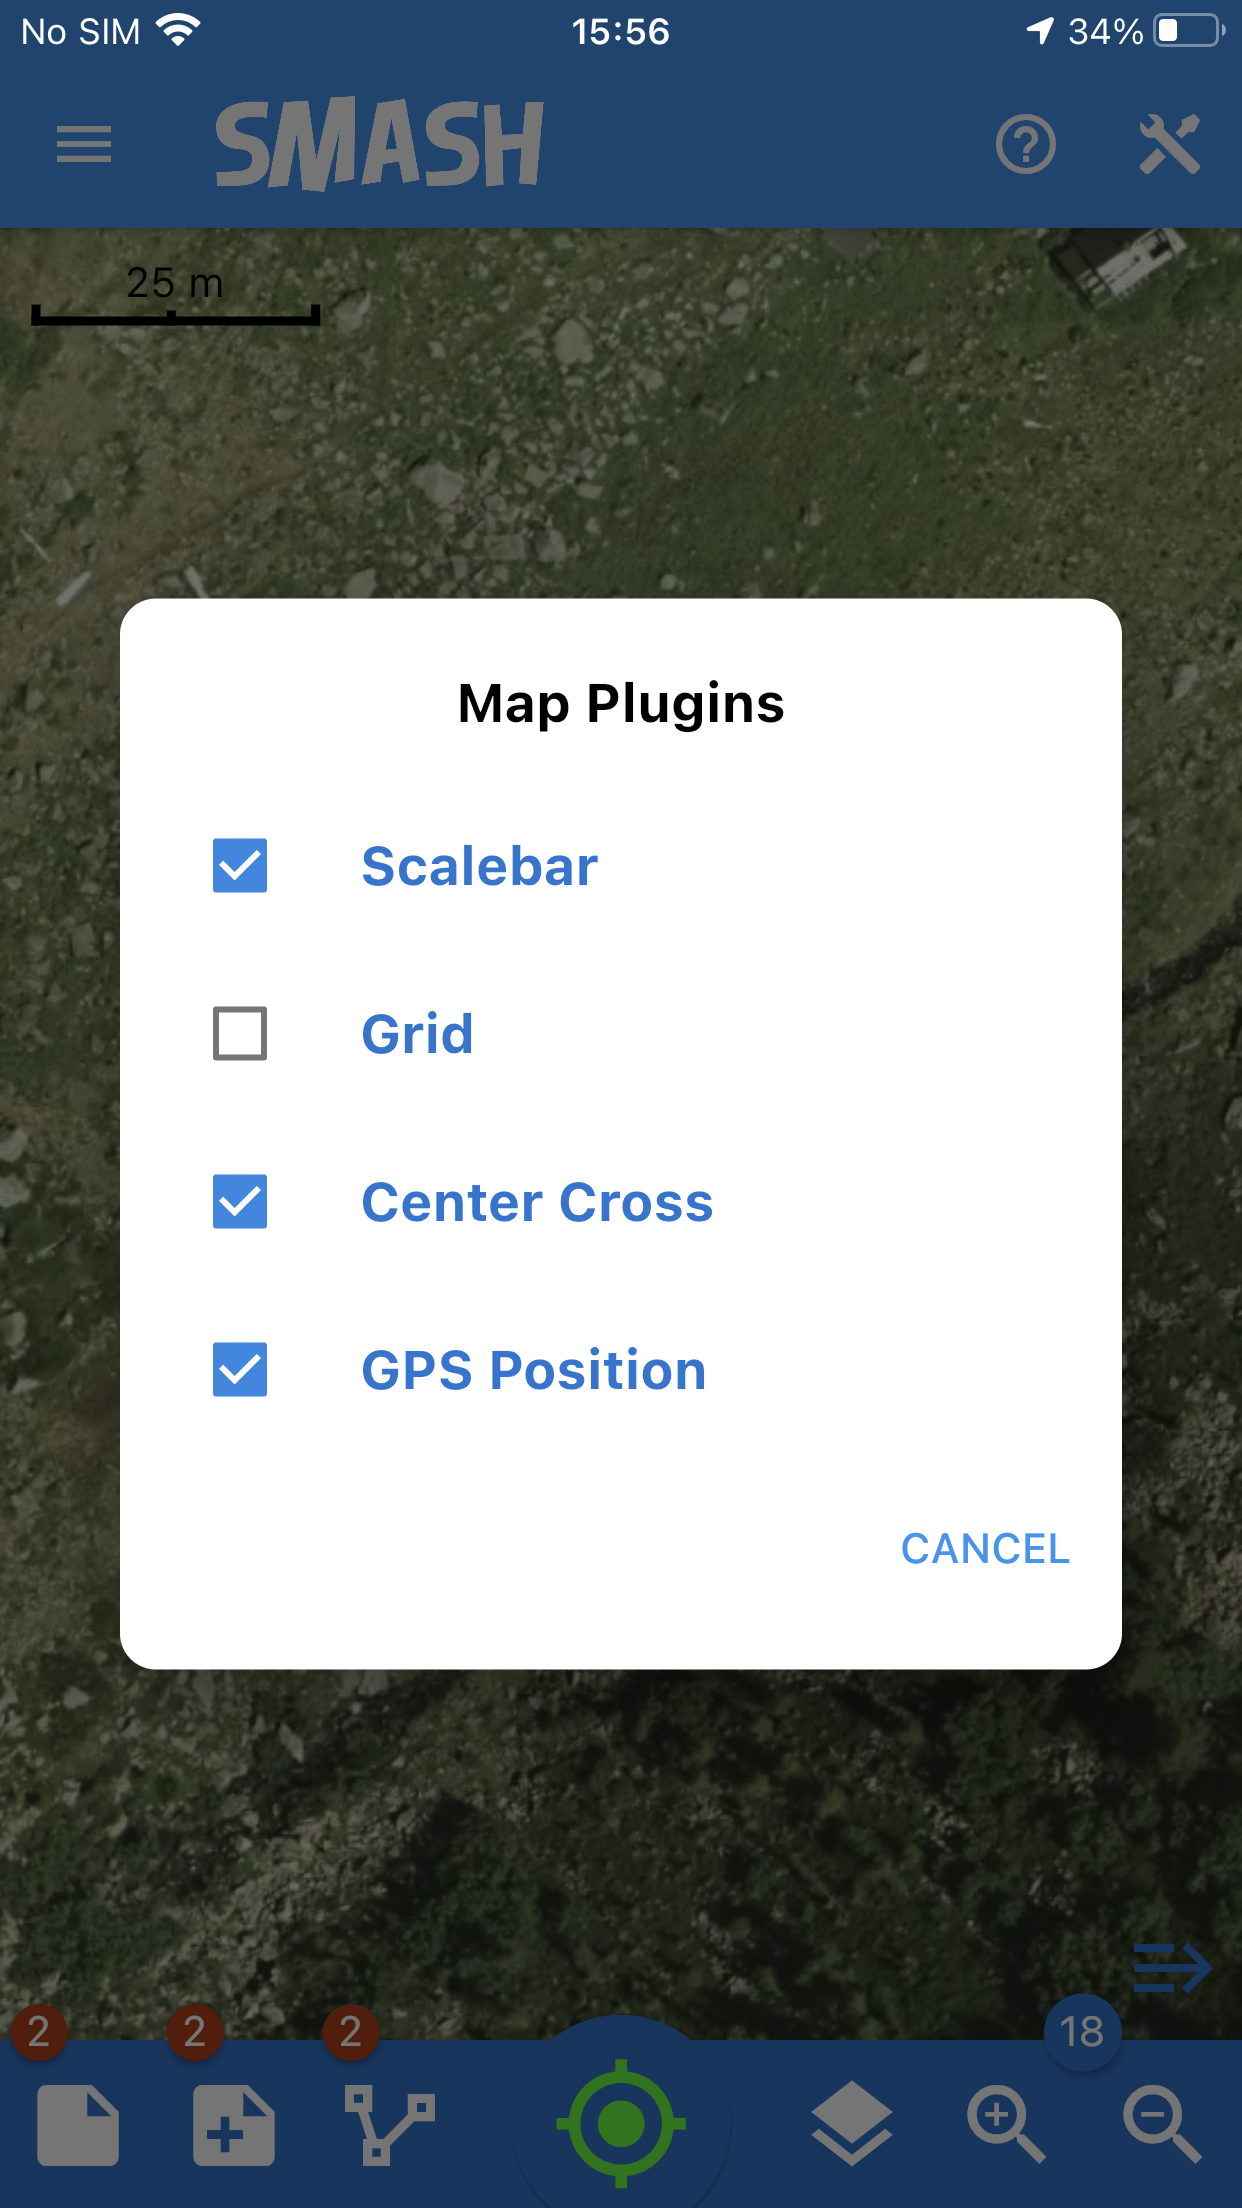
The layers plugins dialog.
From here it is possible to select which decoration to visualize on the map from:
-
scalebar
-
projection grid
-
center cross
-
GPS position.
4.5. Zoom buttons
The zoom buttons don’t need lot of information. They can be used to zoom in and out the map. The same can be done using the pinch gestures. The value visualized represents the zoom level following the OSM convention.
5. The bottom toolbar
From version 1.5.0 Smash shows a small handler in the lower right corner which allows to activate the bottom toolbar.
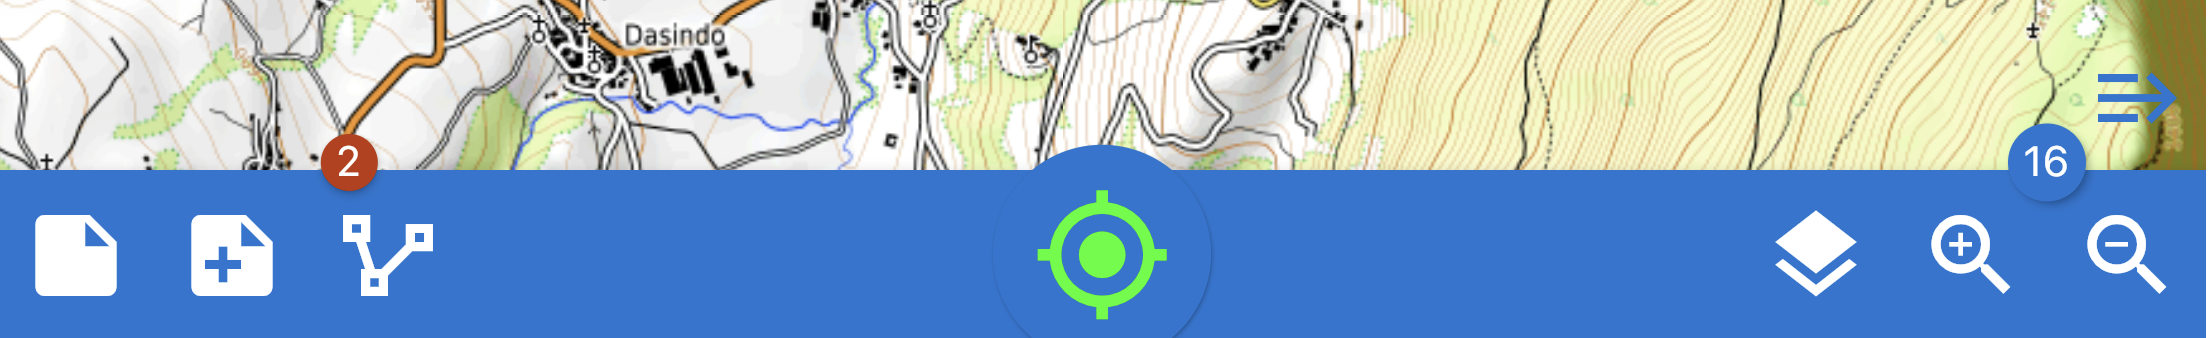
The bottom toolbar handler in the map view.
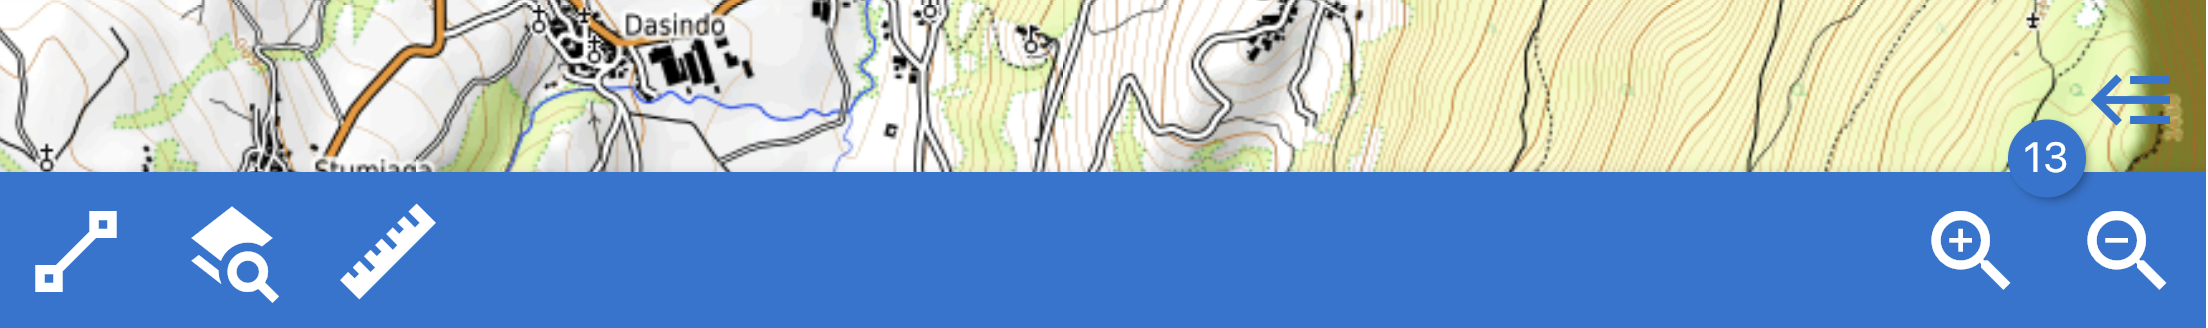
The visualization of the bottom toolbar.
The bottom toolbar will host all the interactive operations on layers and on the map view.
If selected one tool, its icon becames red, this means that the tool is active. To deactivate it just tap the same icon in the bottom toolbar. The tools are automatically deactivated when the user decides to exit the bottom toolbar by tapping the handler on the right corner of the map view. In addition, when activated, the feature editing tool will show its specific options in the bottom toolbar.
5.1. Feature editing
The first icon of the bottom toolbar represents the feature editing tool for vector layers in the Geopackage format:
-
of all feature’s type: point, lines, polygons
-
in their own coordinate reference system.
The features editing works for all visible vector layers of a Geopackage and allows to:
-
modify existing geometries
-
add a new geometry
-
delete an existing geometry.
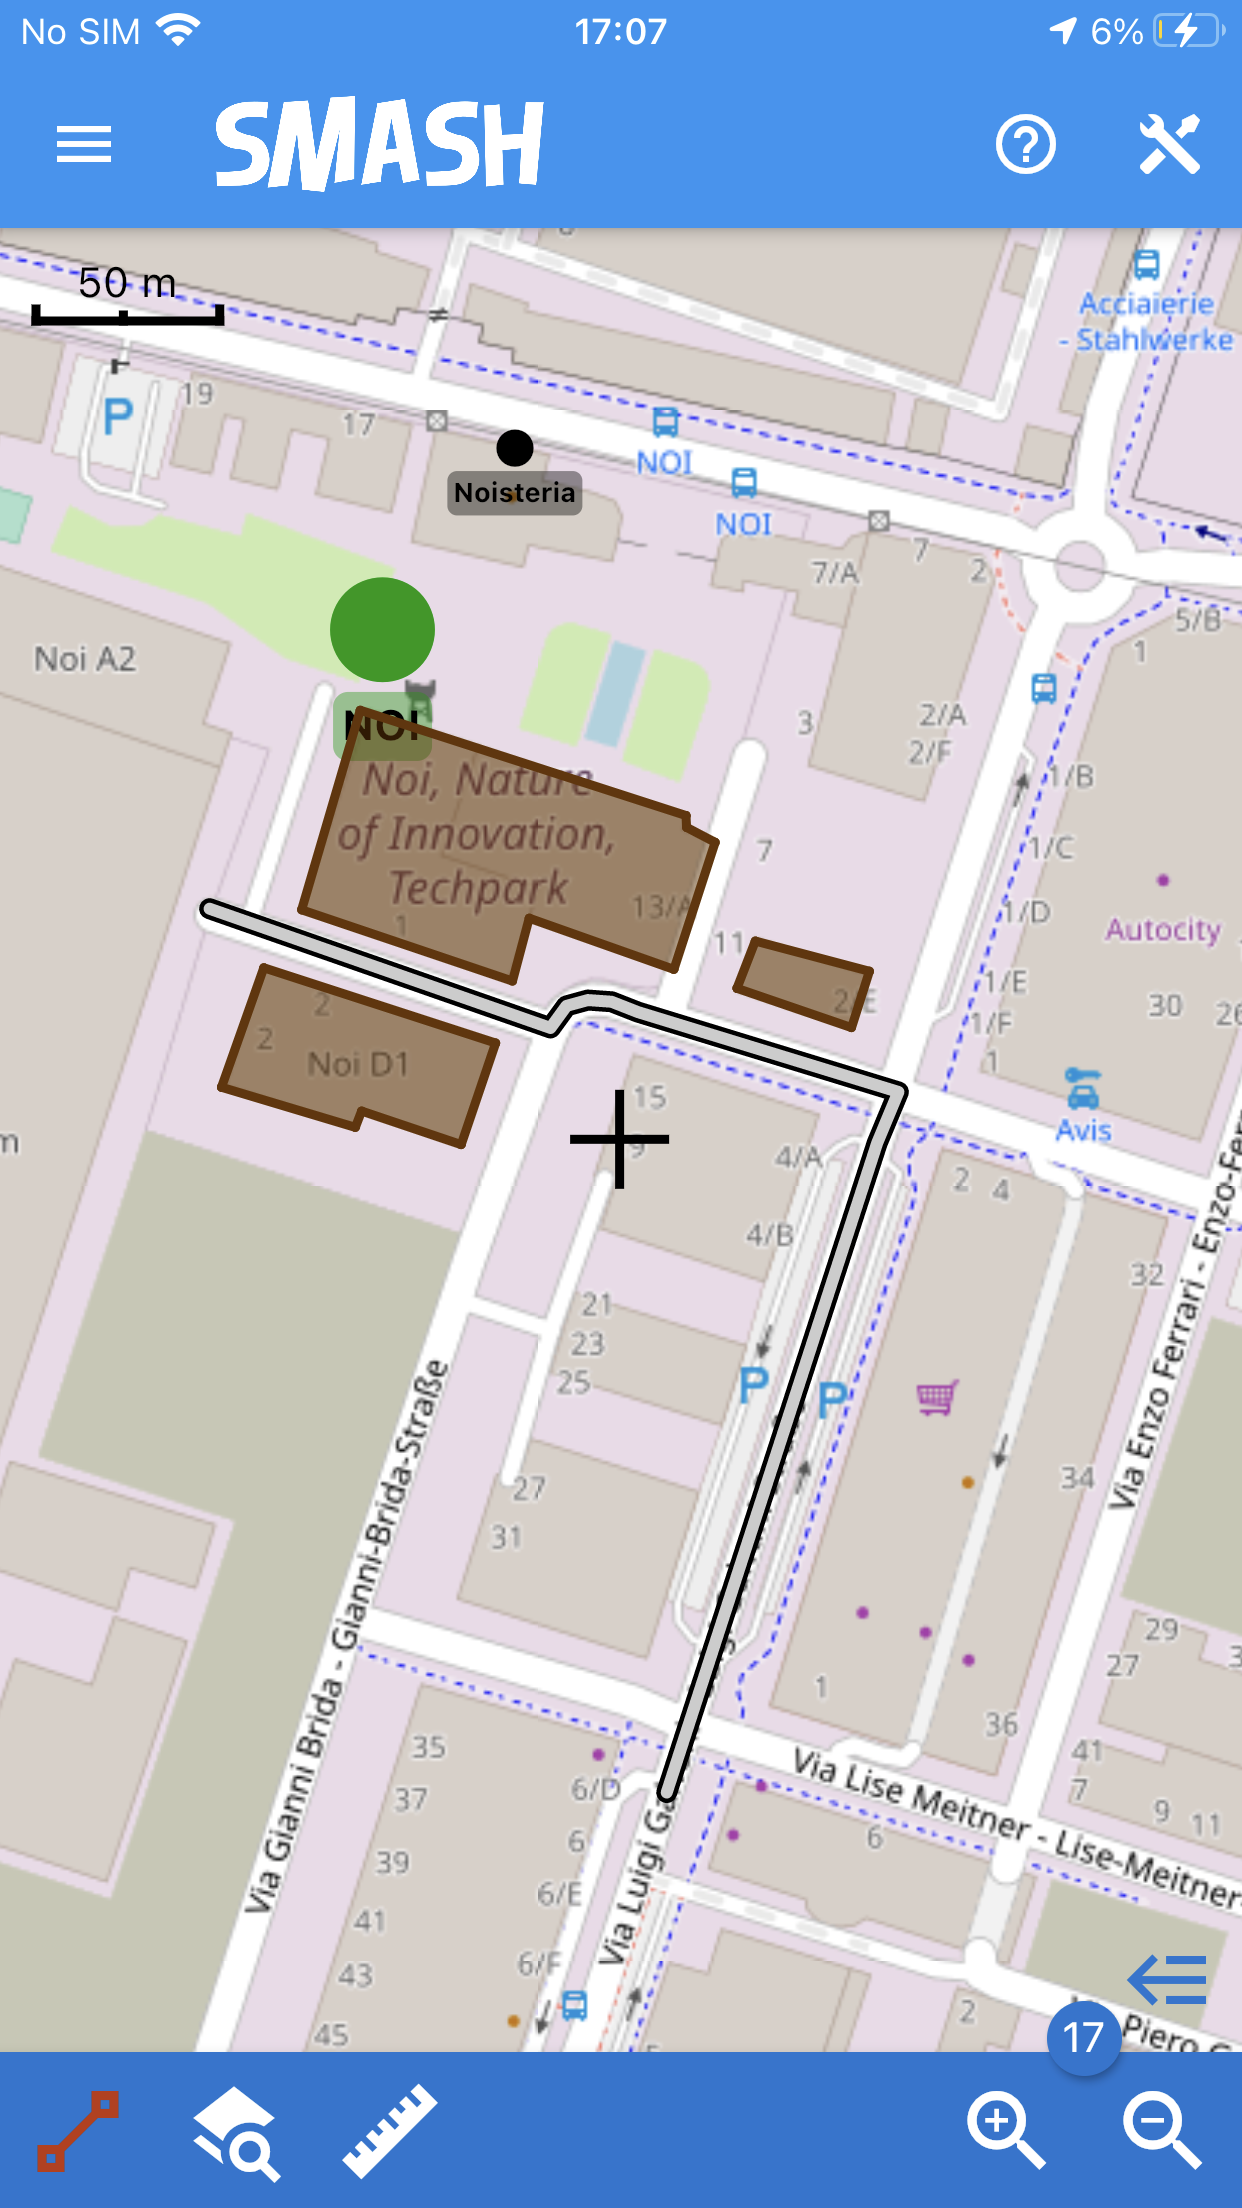
The moment of tapping and loading query data with enabled the features editing tool.
Once activated long tap on a feature in the map to select the feature below, for polygons, or in the very near, for lines and points. The diameter of influence of the tapped position can be set in the general Settings → Vector layers → Info Tool.
The selected feature will be highlighted in yellow in the map and some specific editing tools will be displayed in the bottom toolbar to:
-
delete
-
edit the attributes table
-
save the modified geometry
-
cancel the geometry changes until last saved action.
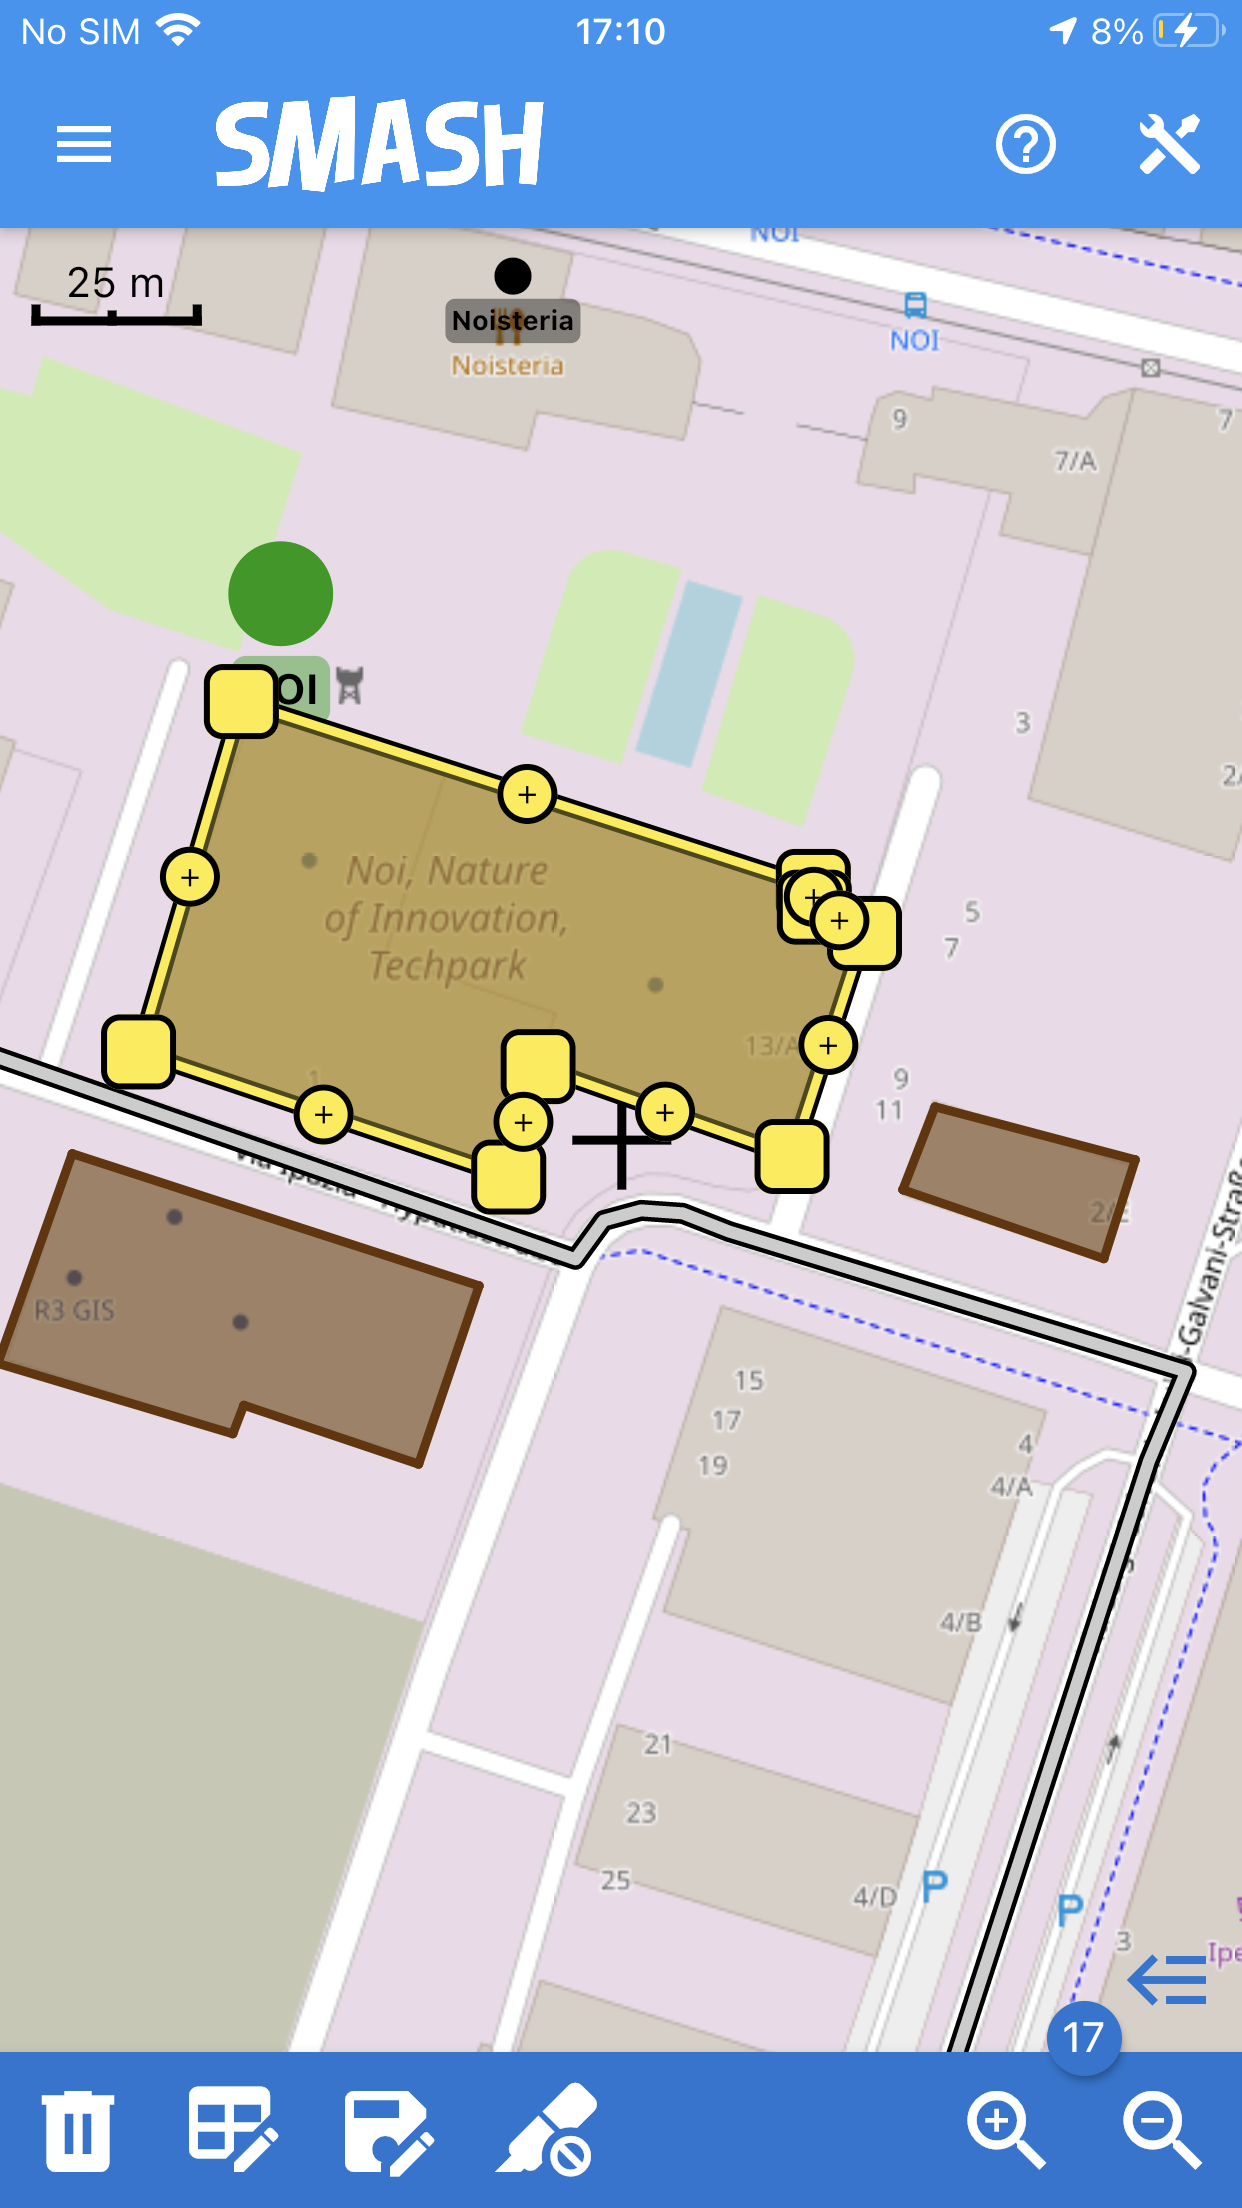
The long tapped polygon feature selected.
5.1.1. Editing of existing features
Editing of an existing geometry consists of:
a) drag edges/angles in the new position
b) move the middle points of segments: this will become an edge and automatically two additional middle points will be added from the selected vertex to the two adjacent vertexes in both directions
c) long tap on a node to remove it.
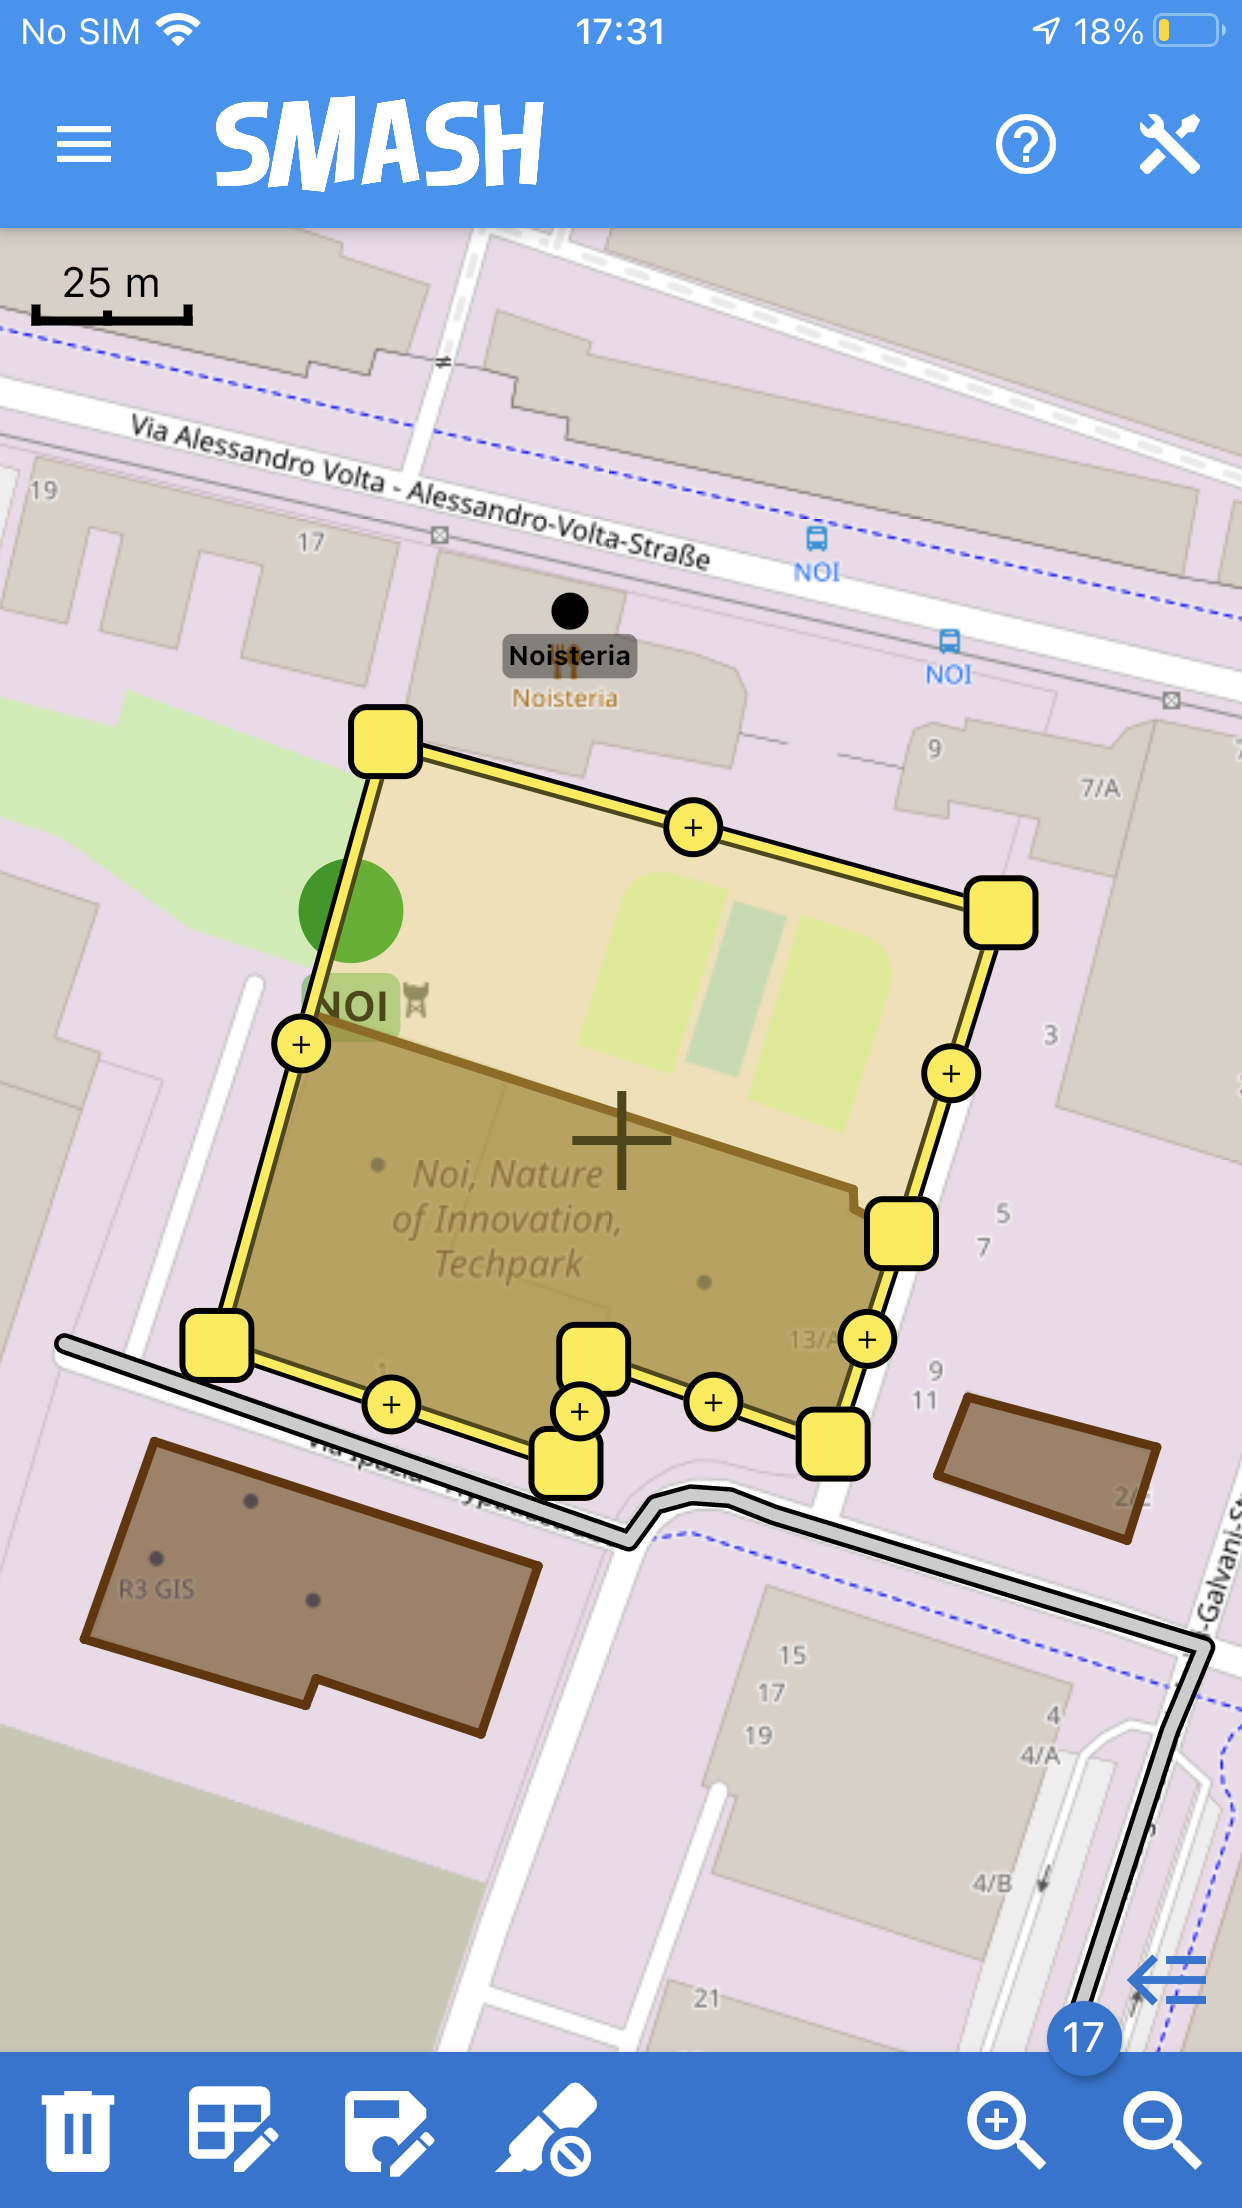
An example of an edited polygon feature.
As soon as the modified geometry is ready, it is possible to either save the changes, by tapping on the save icon  or long tap on the cancel icon
  to restore the initial geometry for that feature. Both the commands will close the editing tool for the current geometry.
Editing of the attributes of and existing feature is accessible both from the editing menu and from the query features tool. In this case just select the second icon of the editing toolbar to visualize the attributes table of the current feature. Once edited, the changes are automatically saved in the attributes table.
To exit the tool tap the left arrow on the top left of the window.
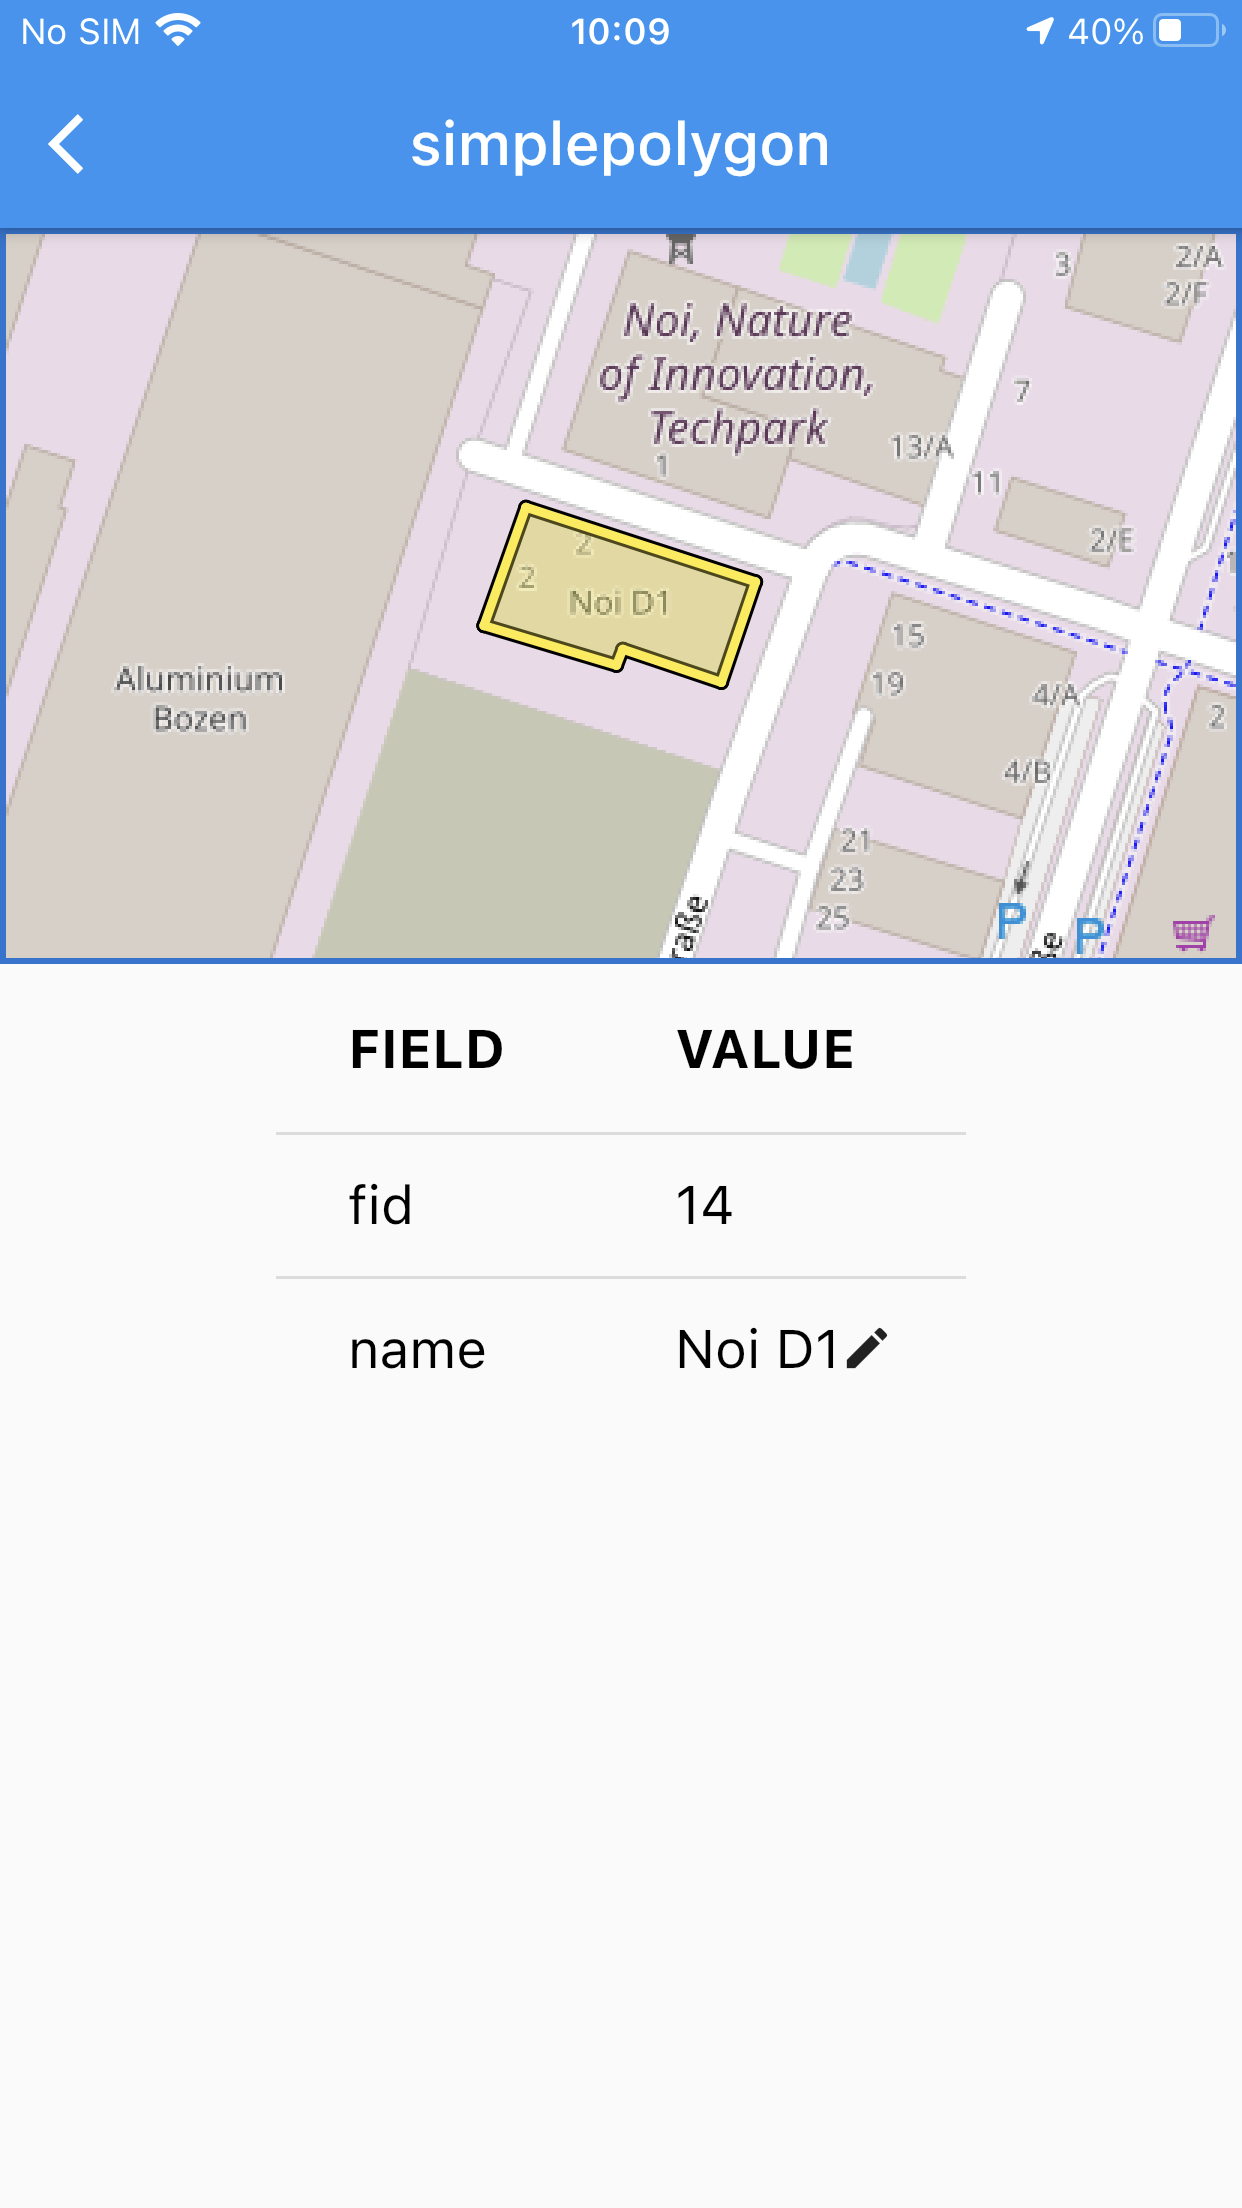
Editing attributes of a polygon layer.
5.1.2. Add new features
To add a new feature in one of the visible Geopackage layers long tap on the desidered position regardless of the type of the new feature you want to add:
a) the application will ask in which layer to save the new feature
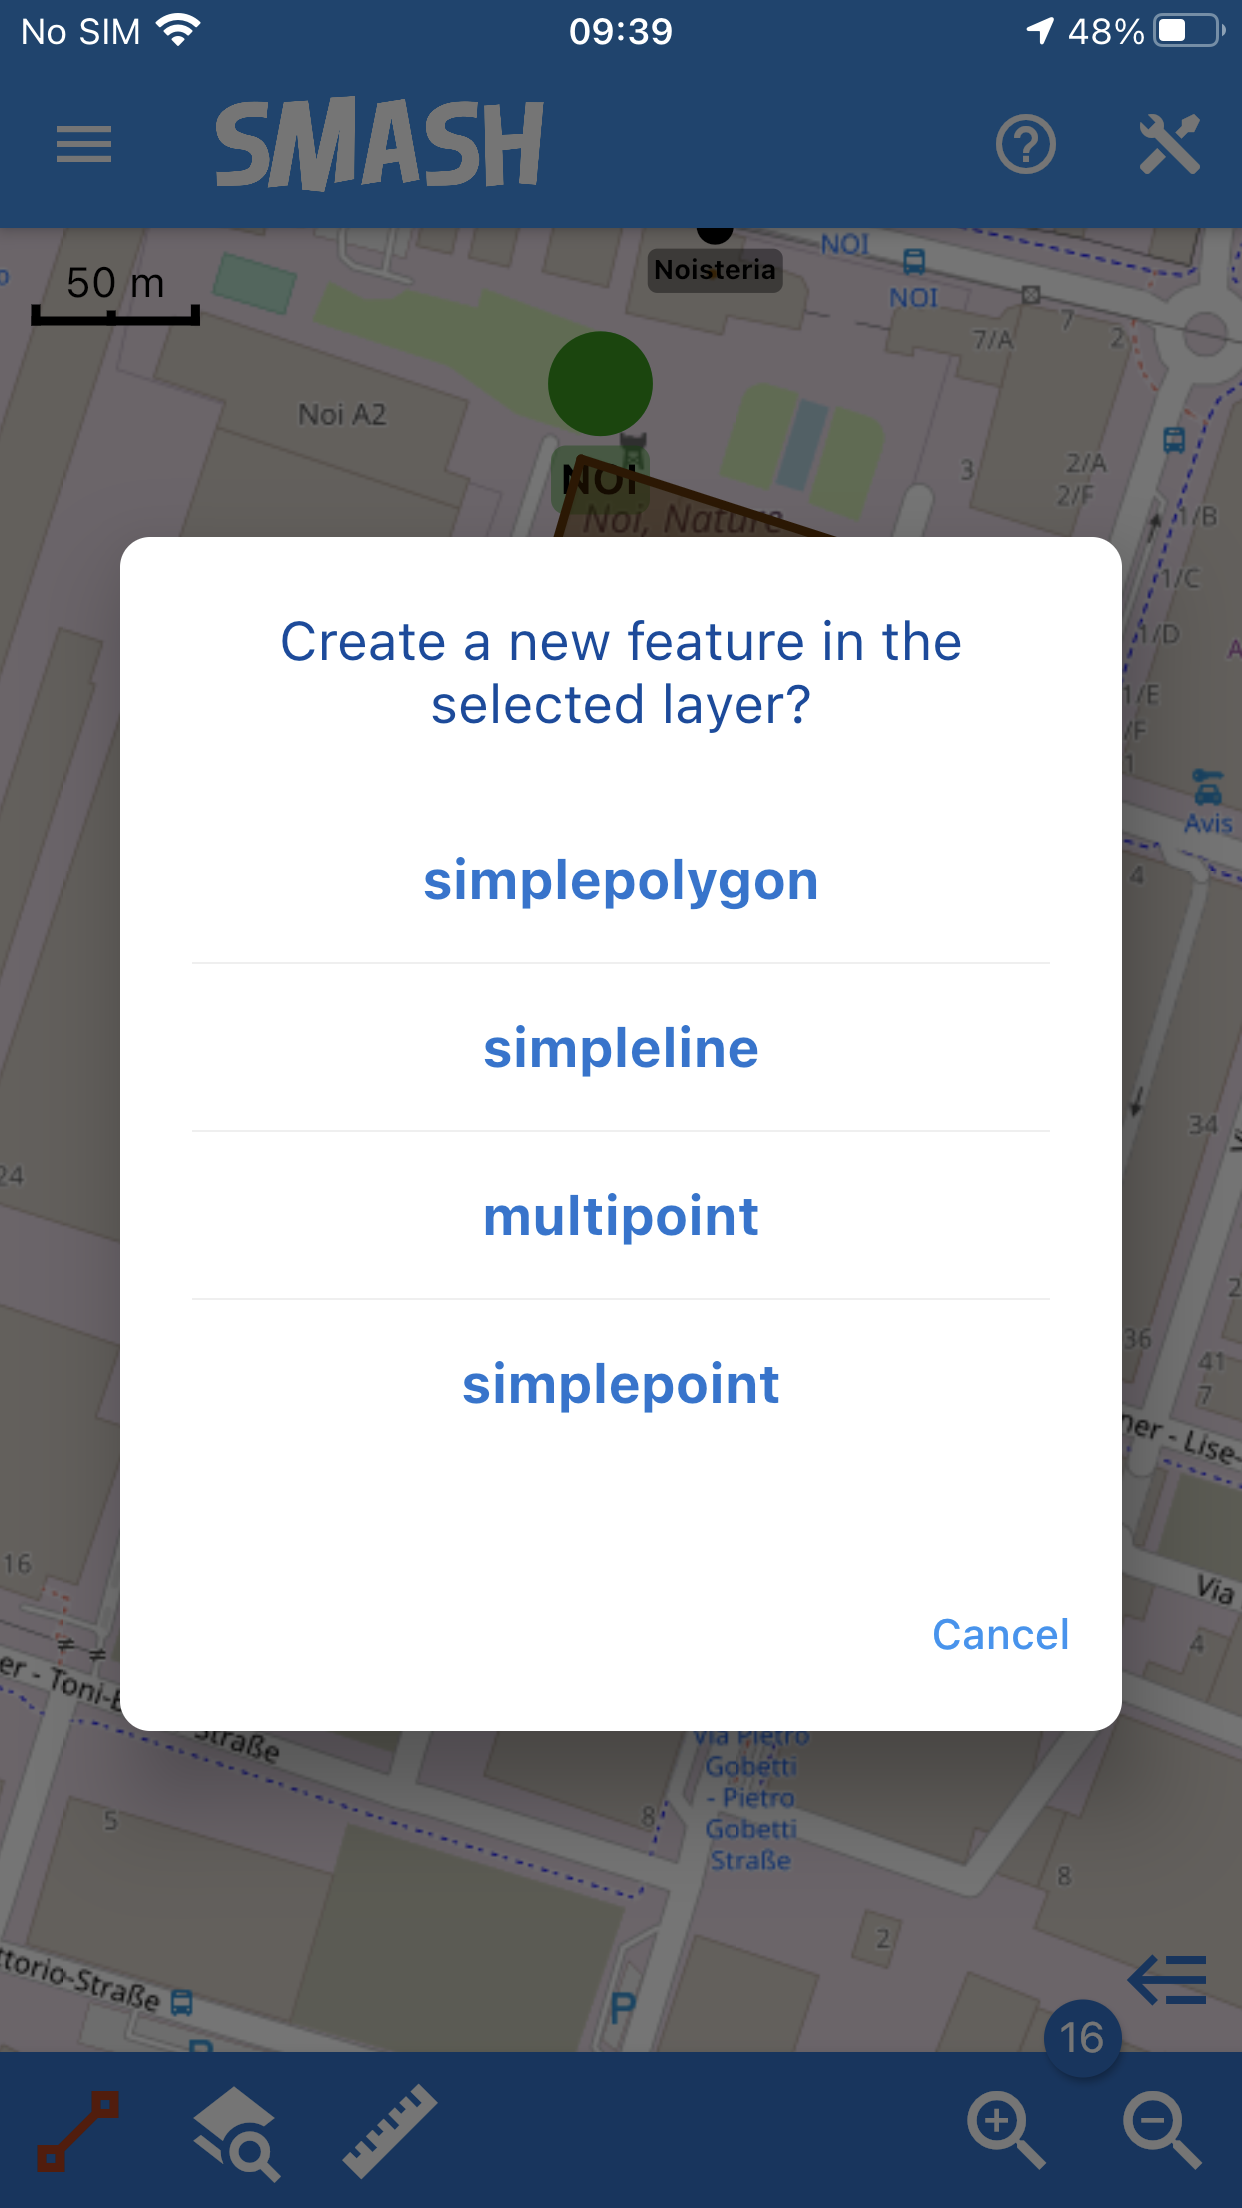
The list of the available layers where to create the new feature.
b) select the layers from the list of the available
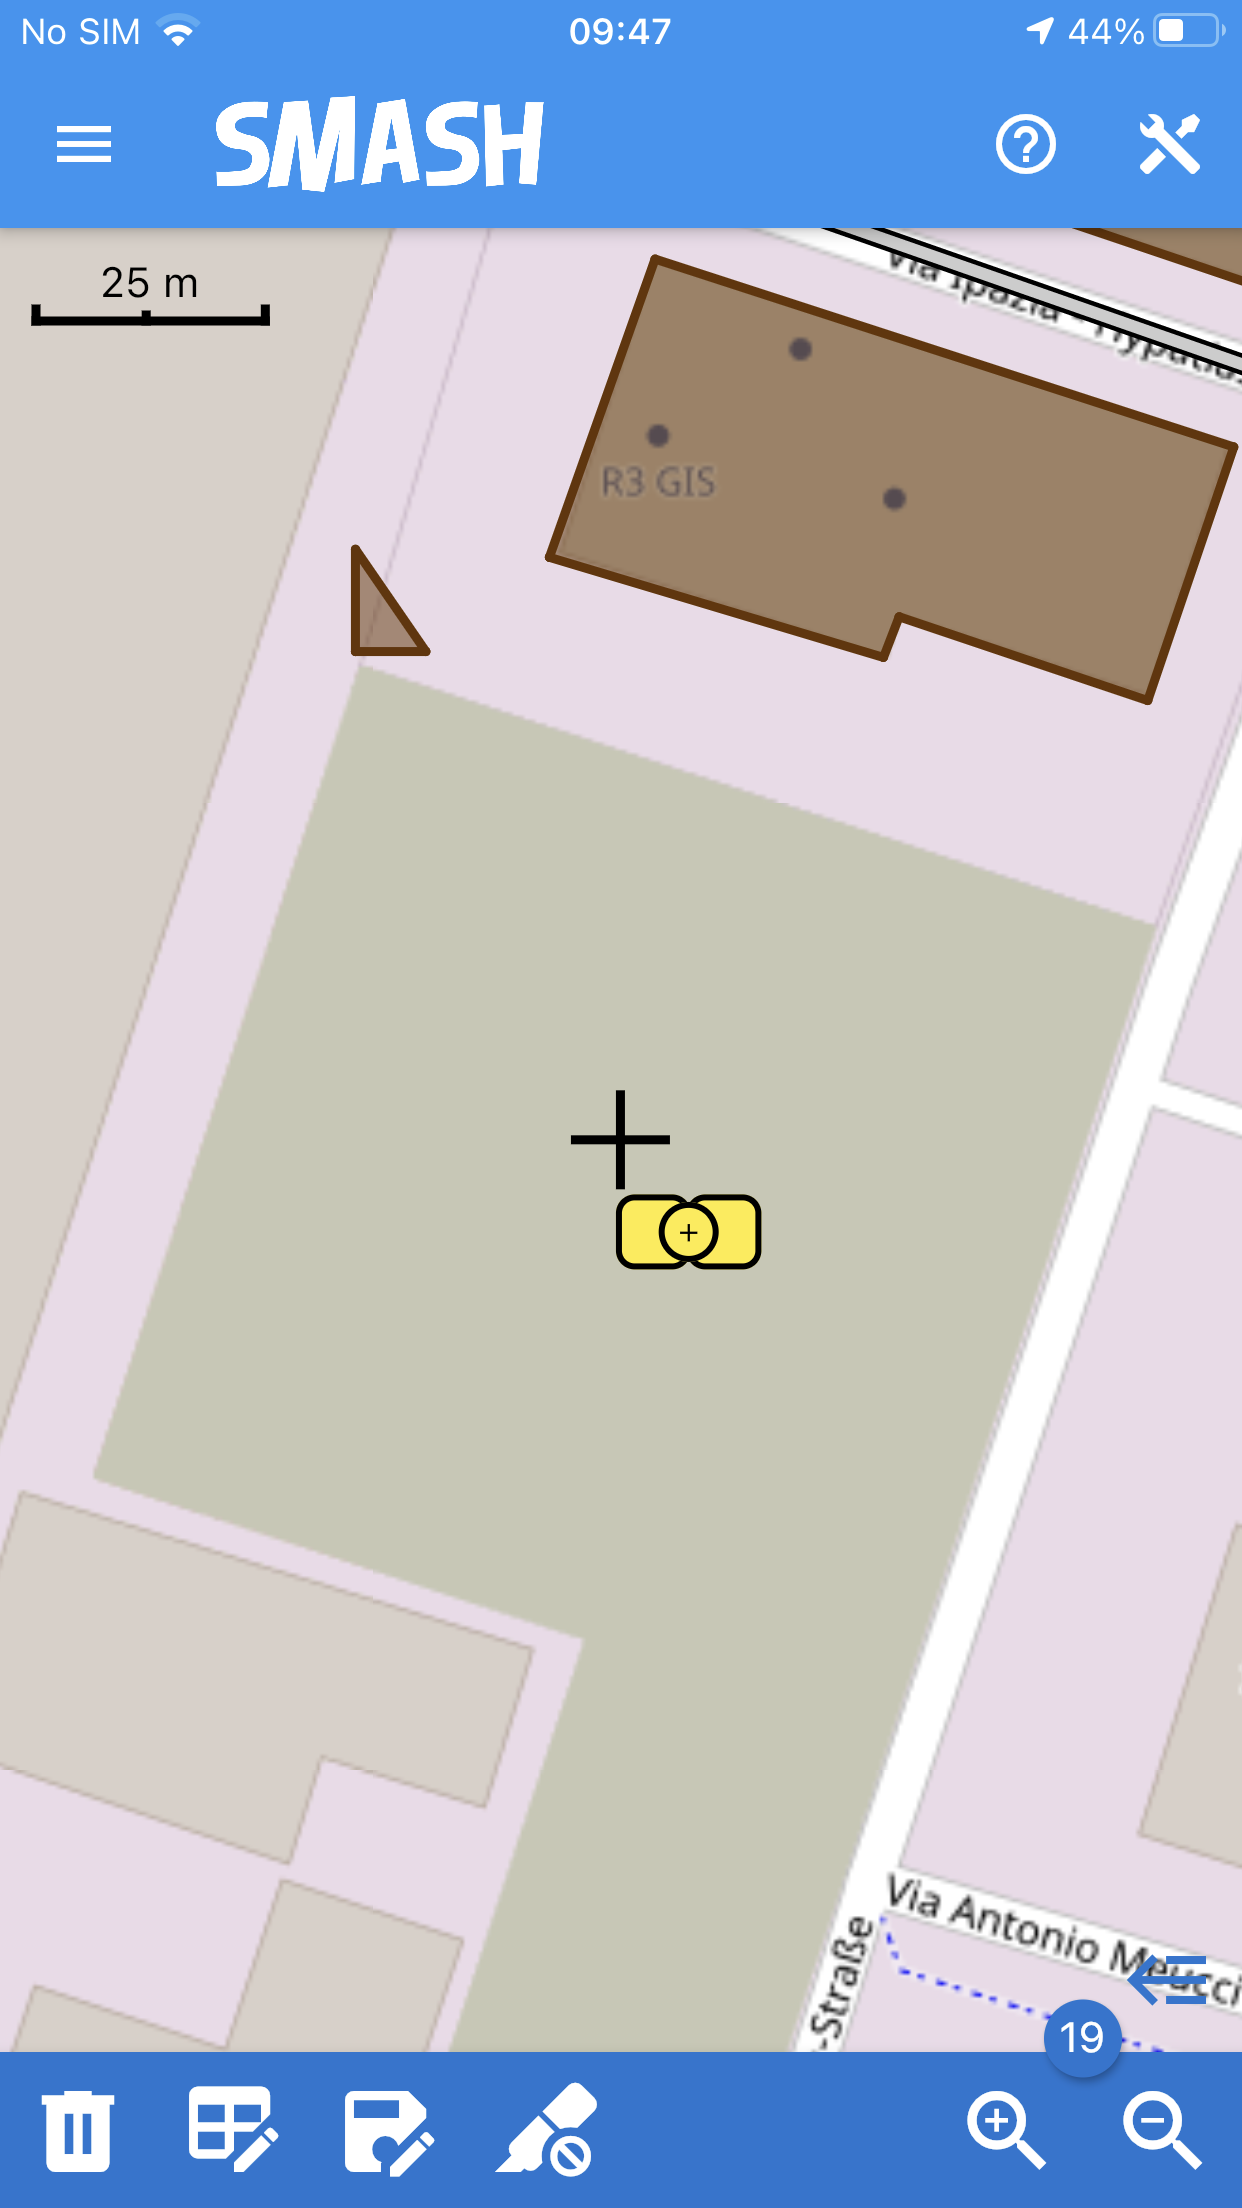
c) new feature of the type of the selected layer will be added automatically in the tapped position:
-
point layers: a new point is added in the tapped position
-
line layers: a small line with two vertexes will be added in the tapped position, the user can then modify this geometry following the Editing of existing features instructions
An example of the new line feature created automatically by the application.
-
polygon layers: a small polygon with 3 vertexes will be added in the tapped position, the user can then modify this geometry following the Editing of existing features instructions
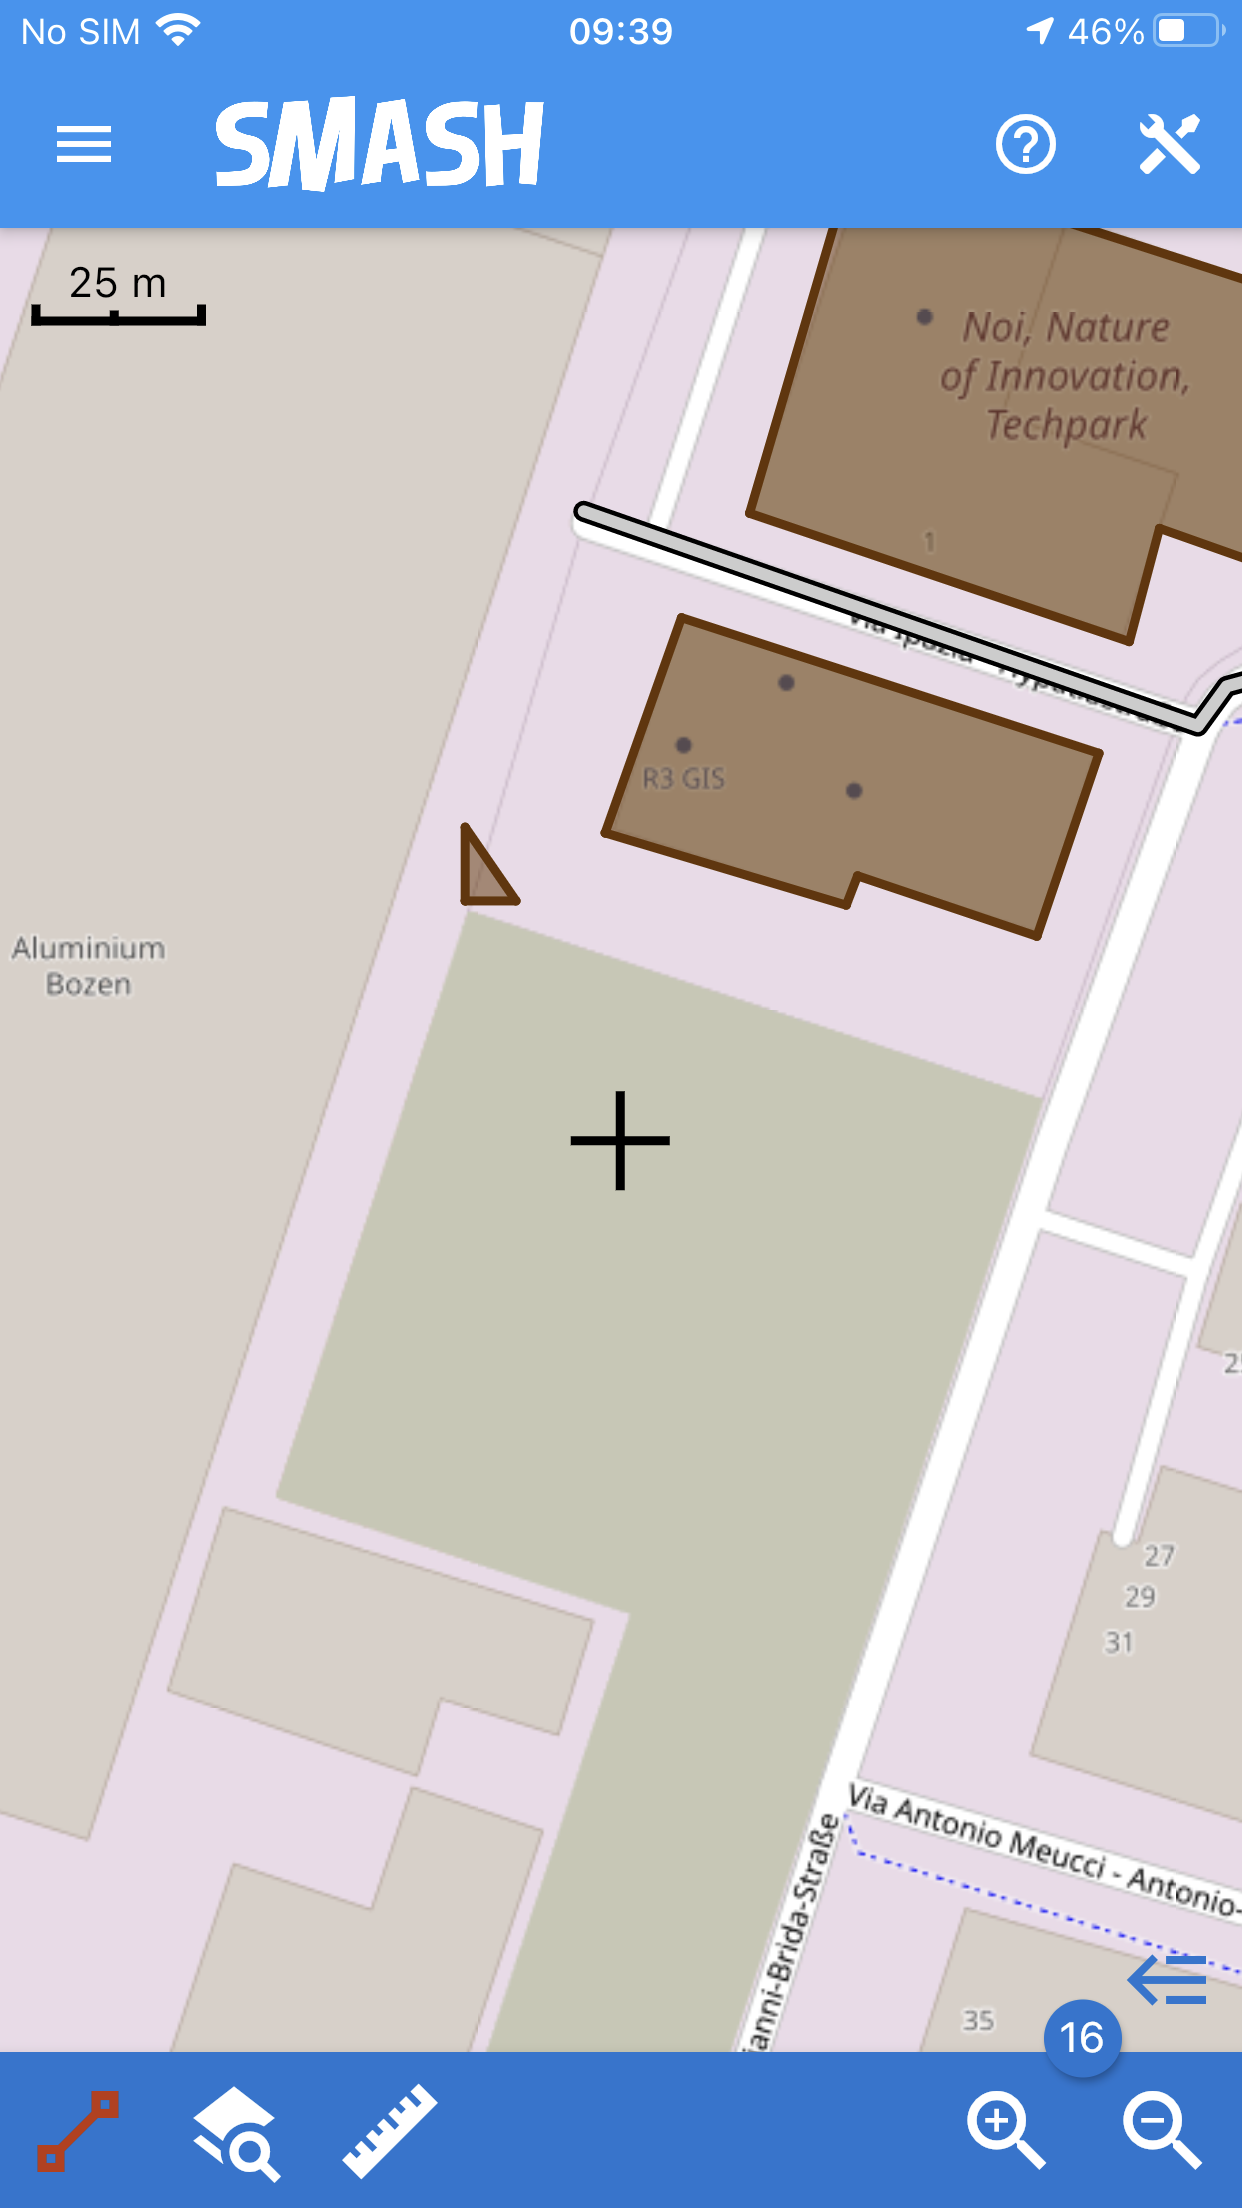
An example of the new polygon feature created automatically by the application.
5.1.3. Delete existing features
To delete an existing feature:
-
long tap on the feature to delete to select it
-
tap the trash icon in the bottom toolbar.
- NOTE
-
please consider that the delete tool has no possibility to reverse the action, there are no undo or cancel tools working after it.
5.2. Query features
The second icon of the bottom toolbar activates the query features tool, that can be used to enable the vector layer info and attributes editing. Once enabled, tapping on the map will query all the visible vector layers for information in the tapped position. The attributes will be also editable if the selected feature is contained in a Geopackage layer.
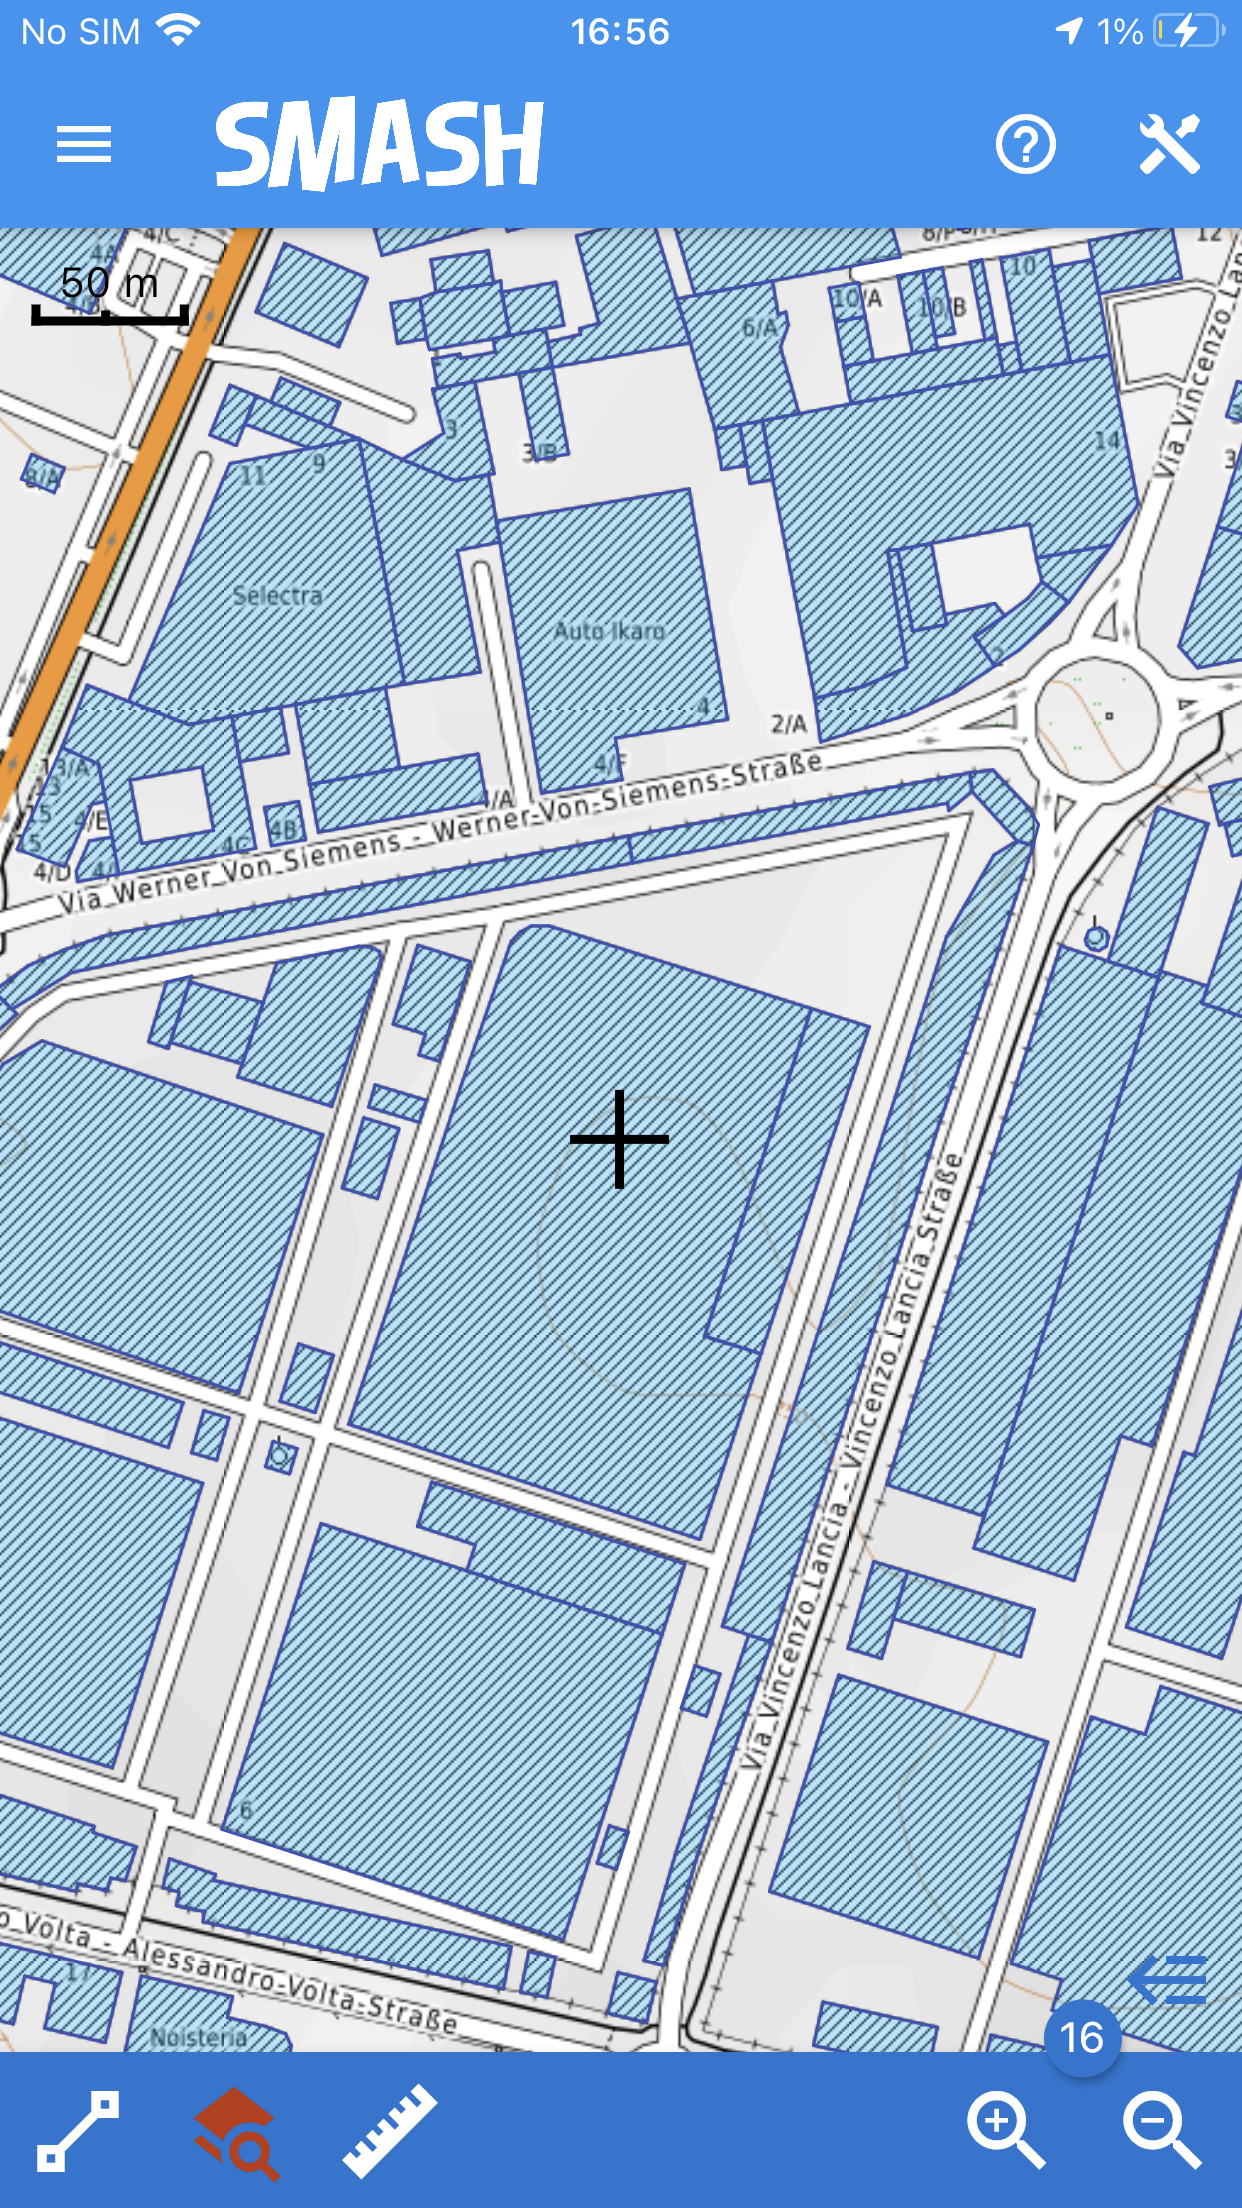
The moment of tapping and loading query data with enabled vector queries.
The info tool queries all visible vector layers and opens the feature info view, which showsdddddd each selected feature highlighted in the map context and its attributes:
-
to browse between the selecte features (if more than one) use the arrows on the top right of the window
-
it is possible to edit the attributes of the feature only of Geopackage layers by selecting the pencil near the value of the attribute in the table
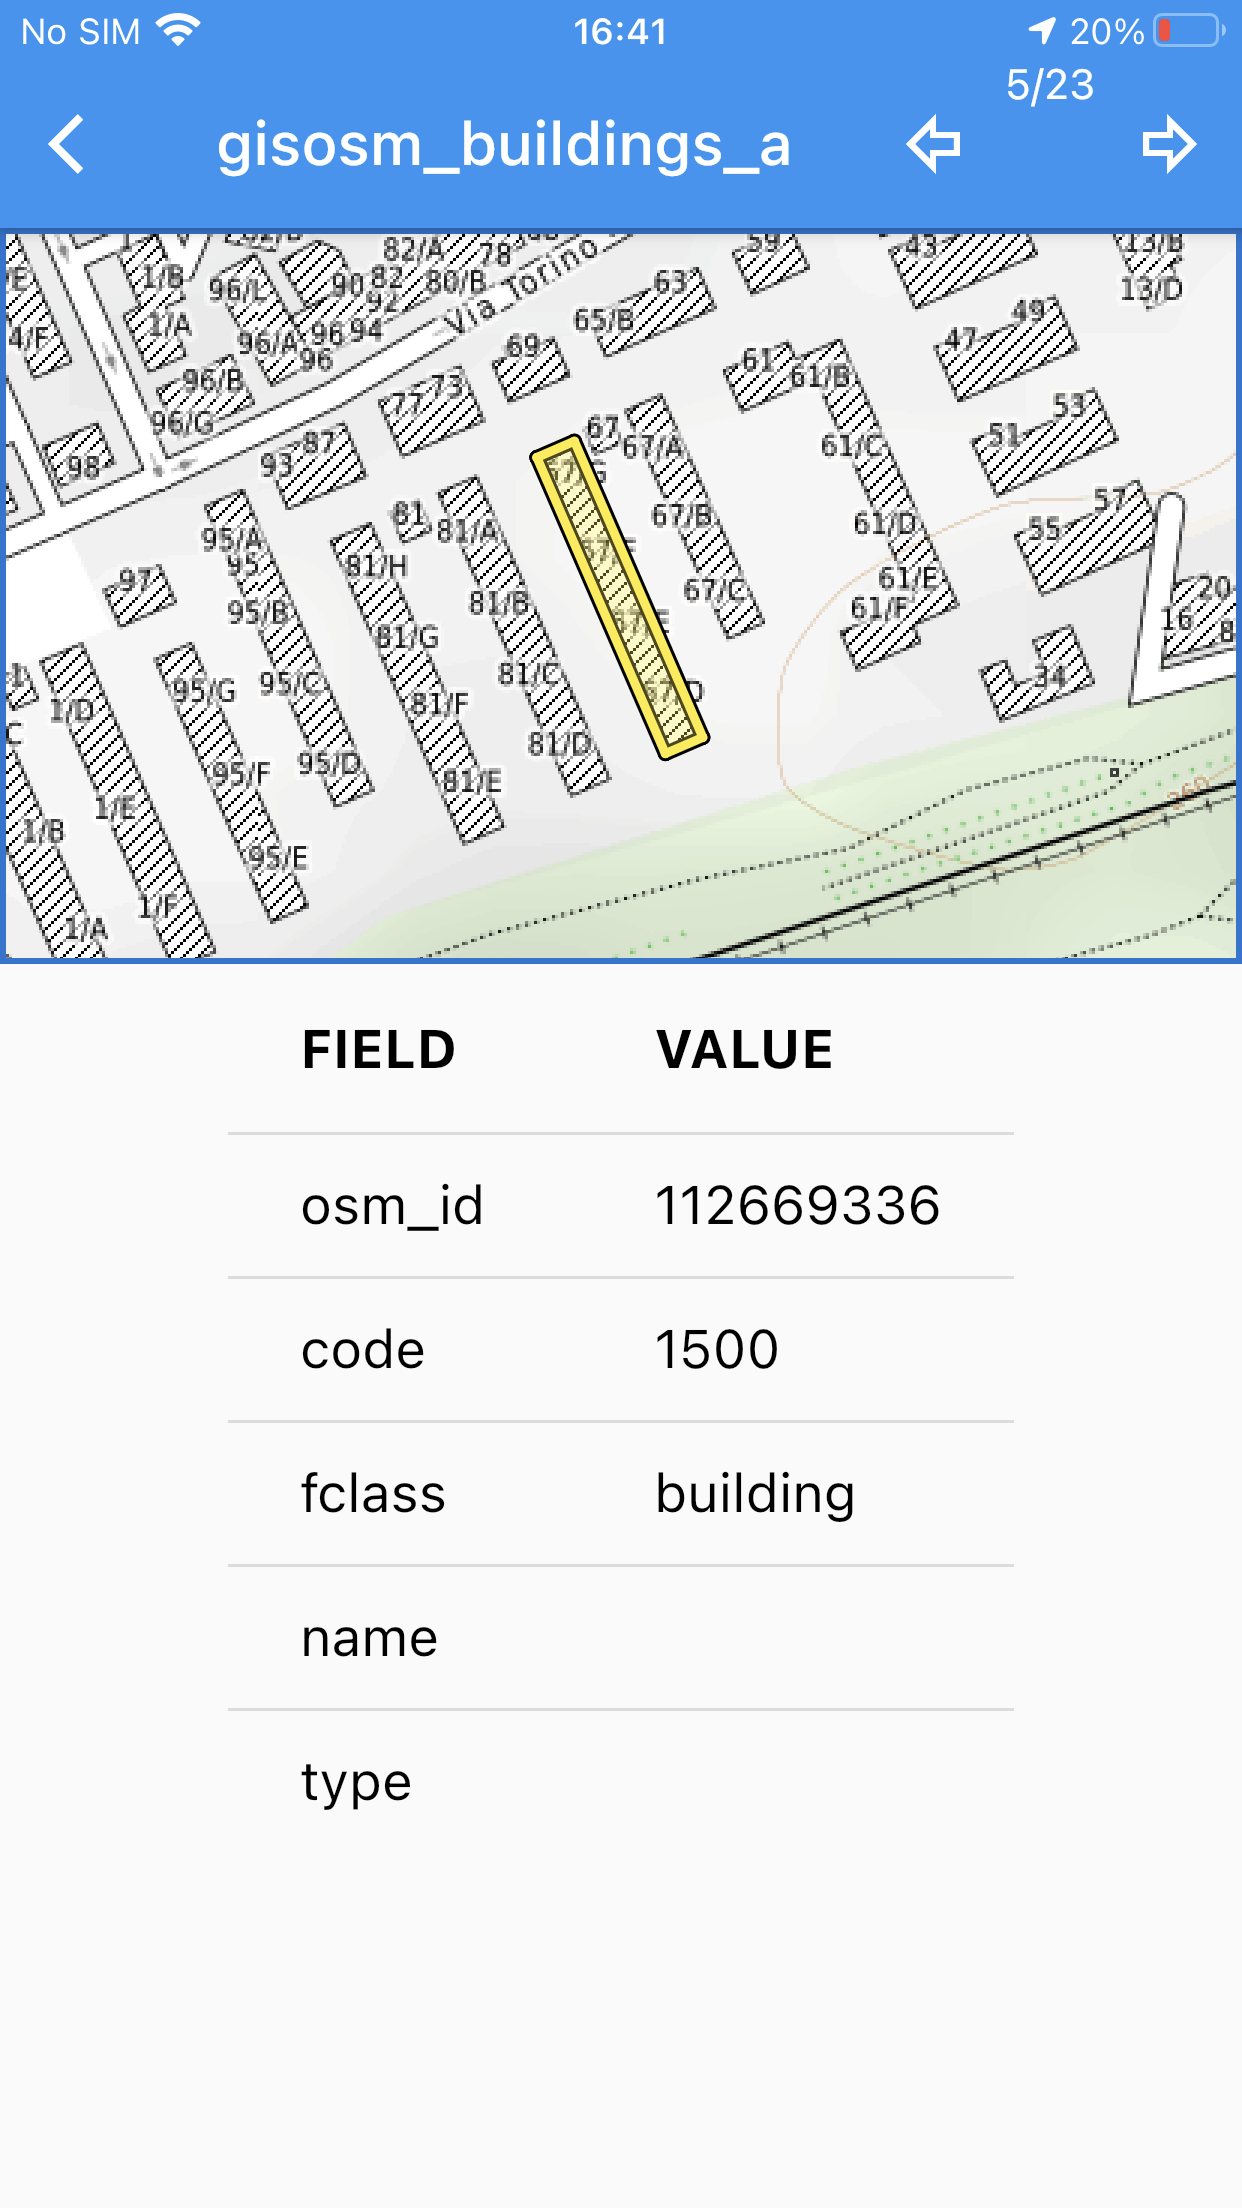
The feature info view showing a polygon feature in a non Geopackage layer.
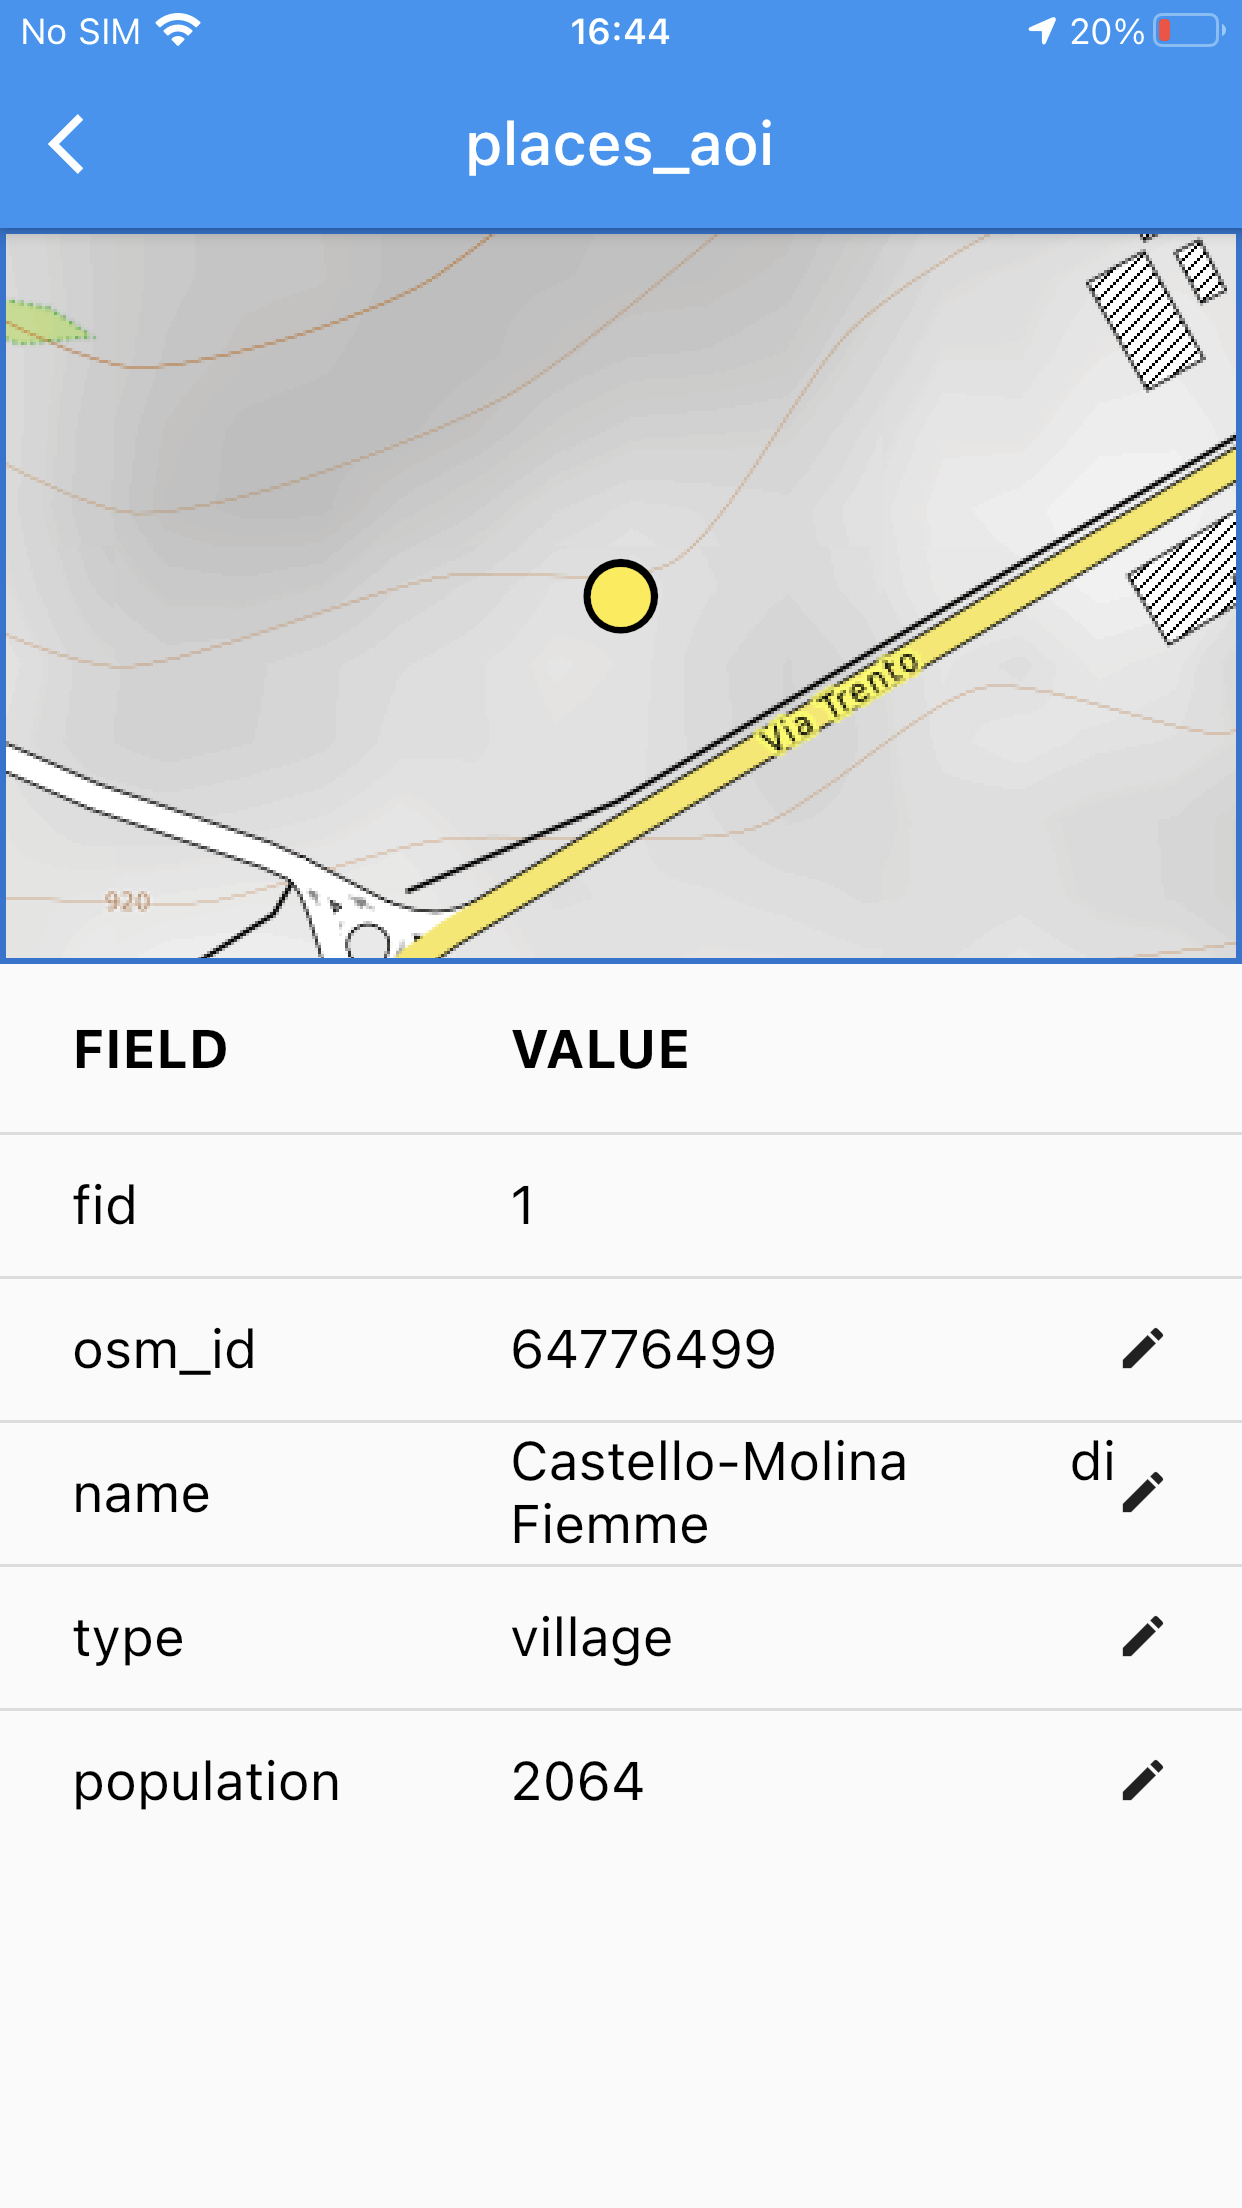
The feature info view showing a point feature in a Geopackage layer with the possibility for attribute’s editing.
5.3. The measurement tool
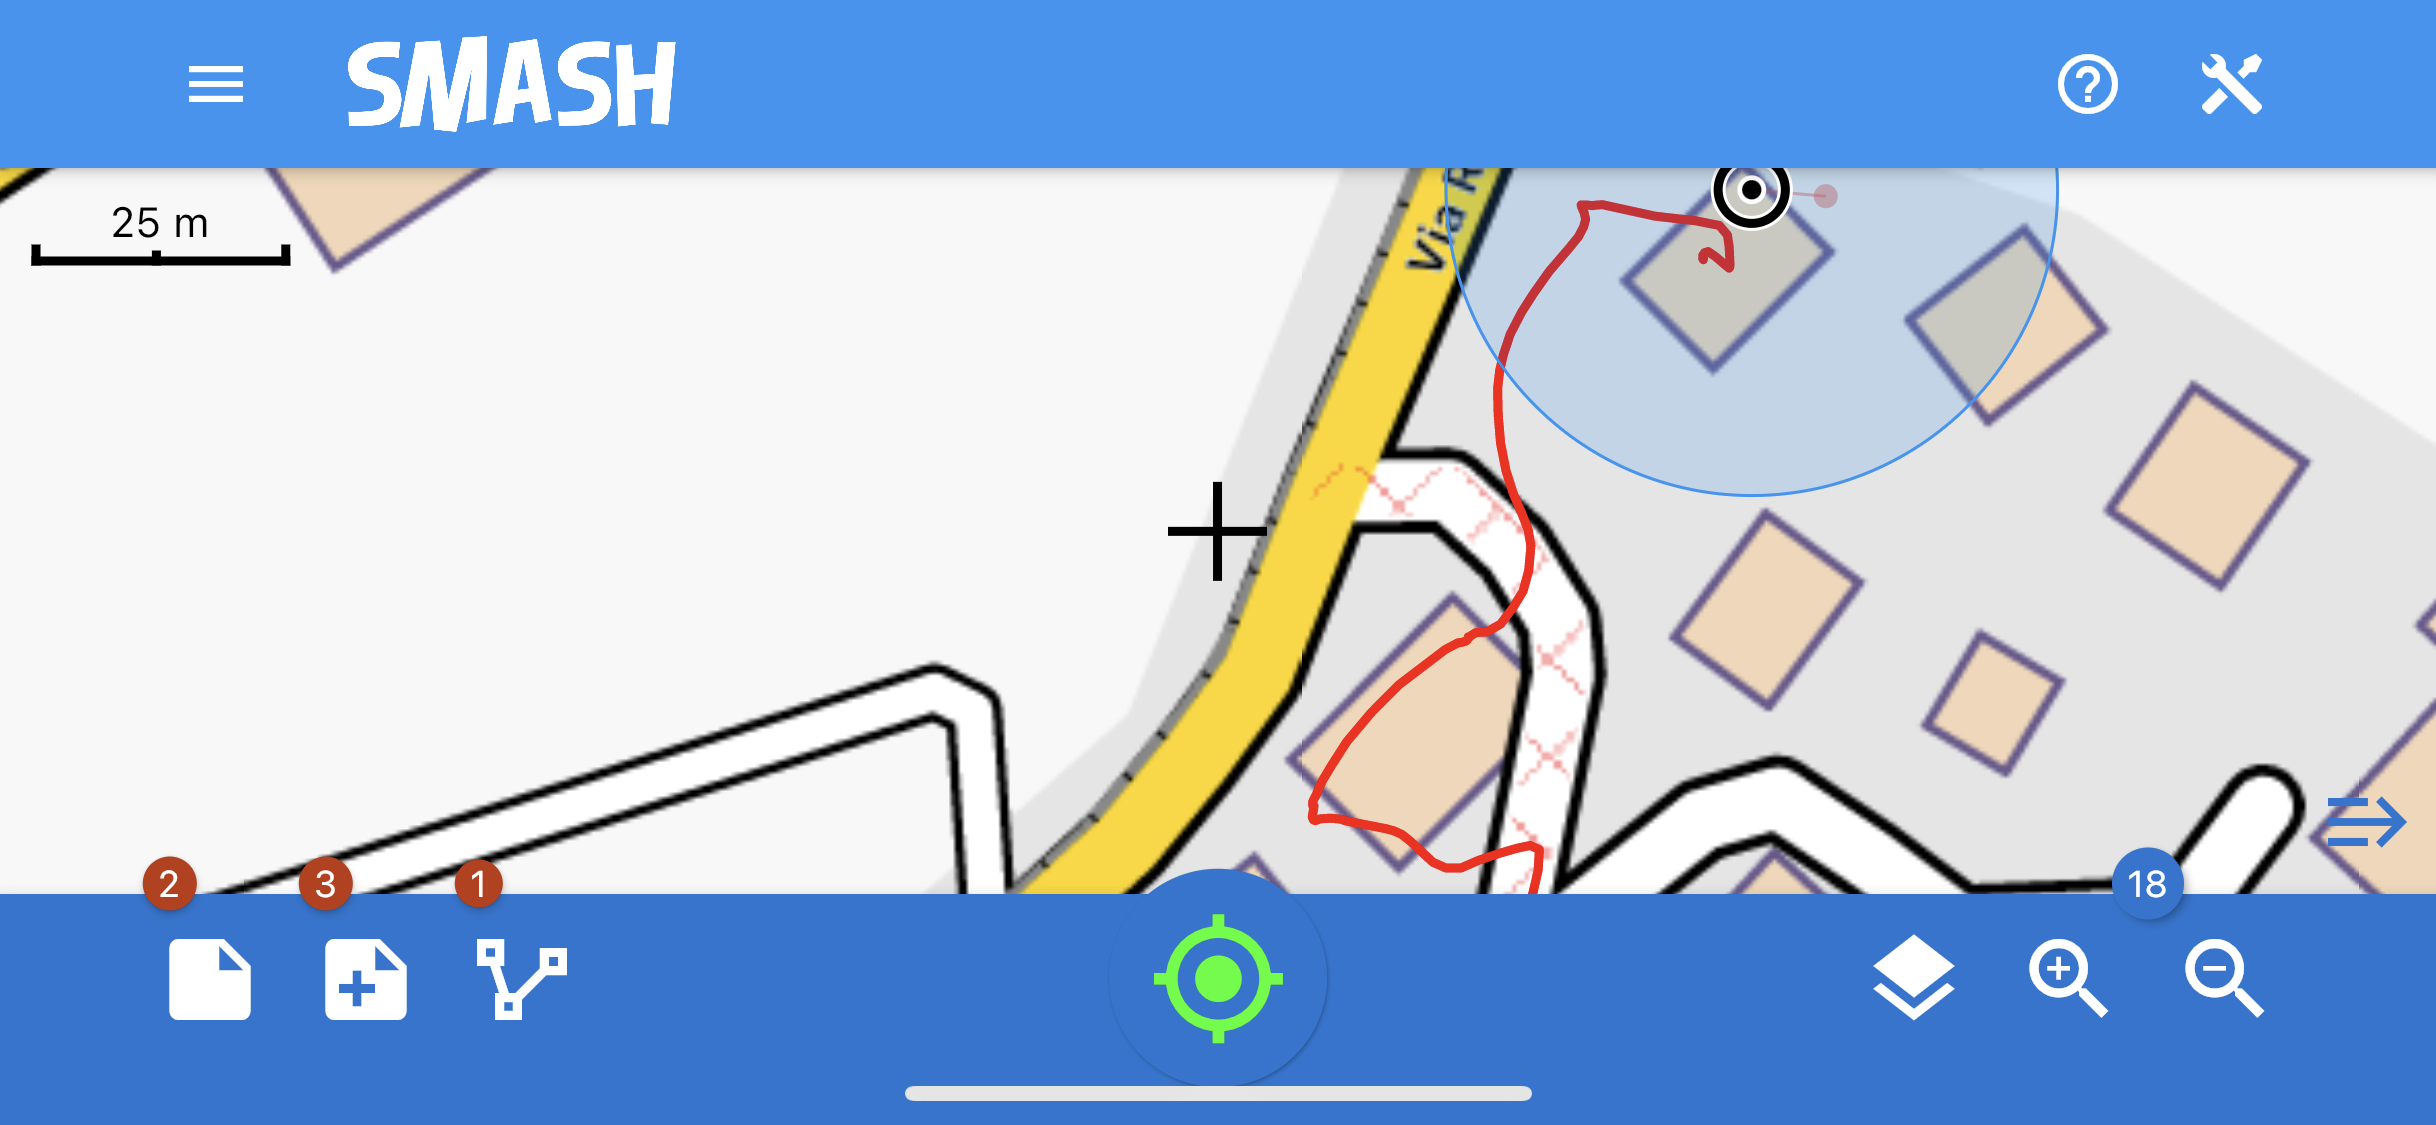
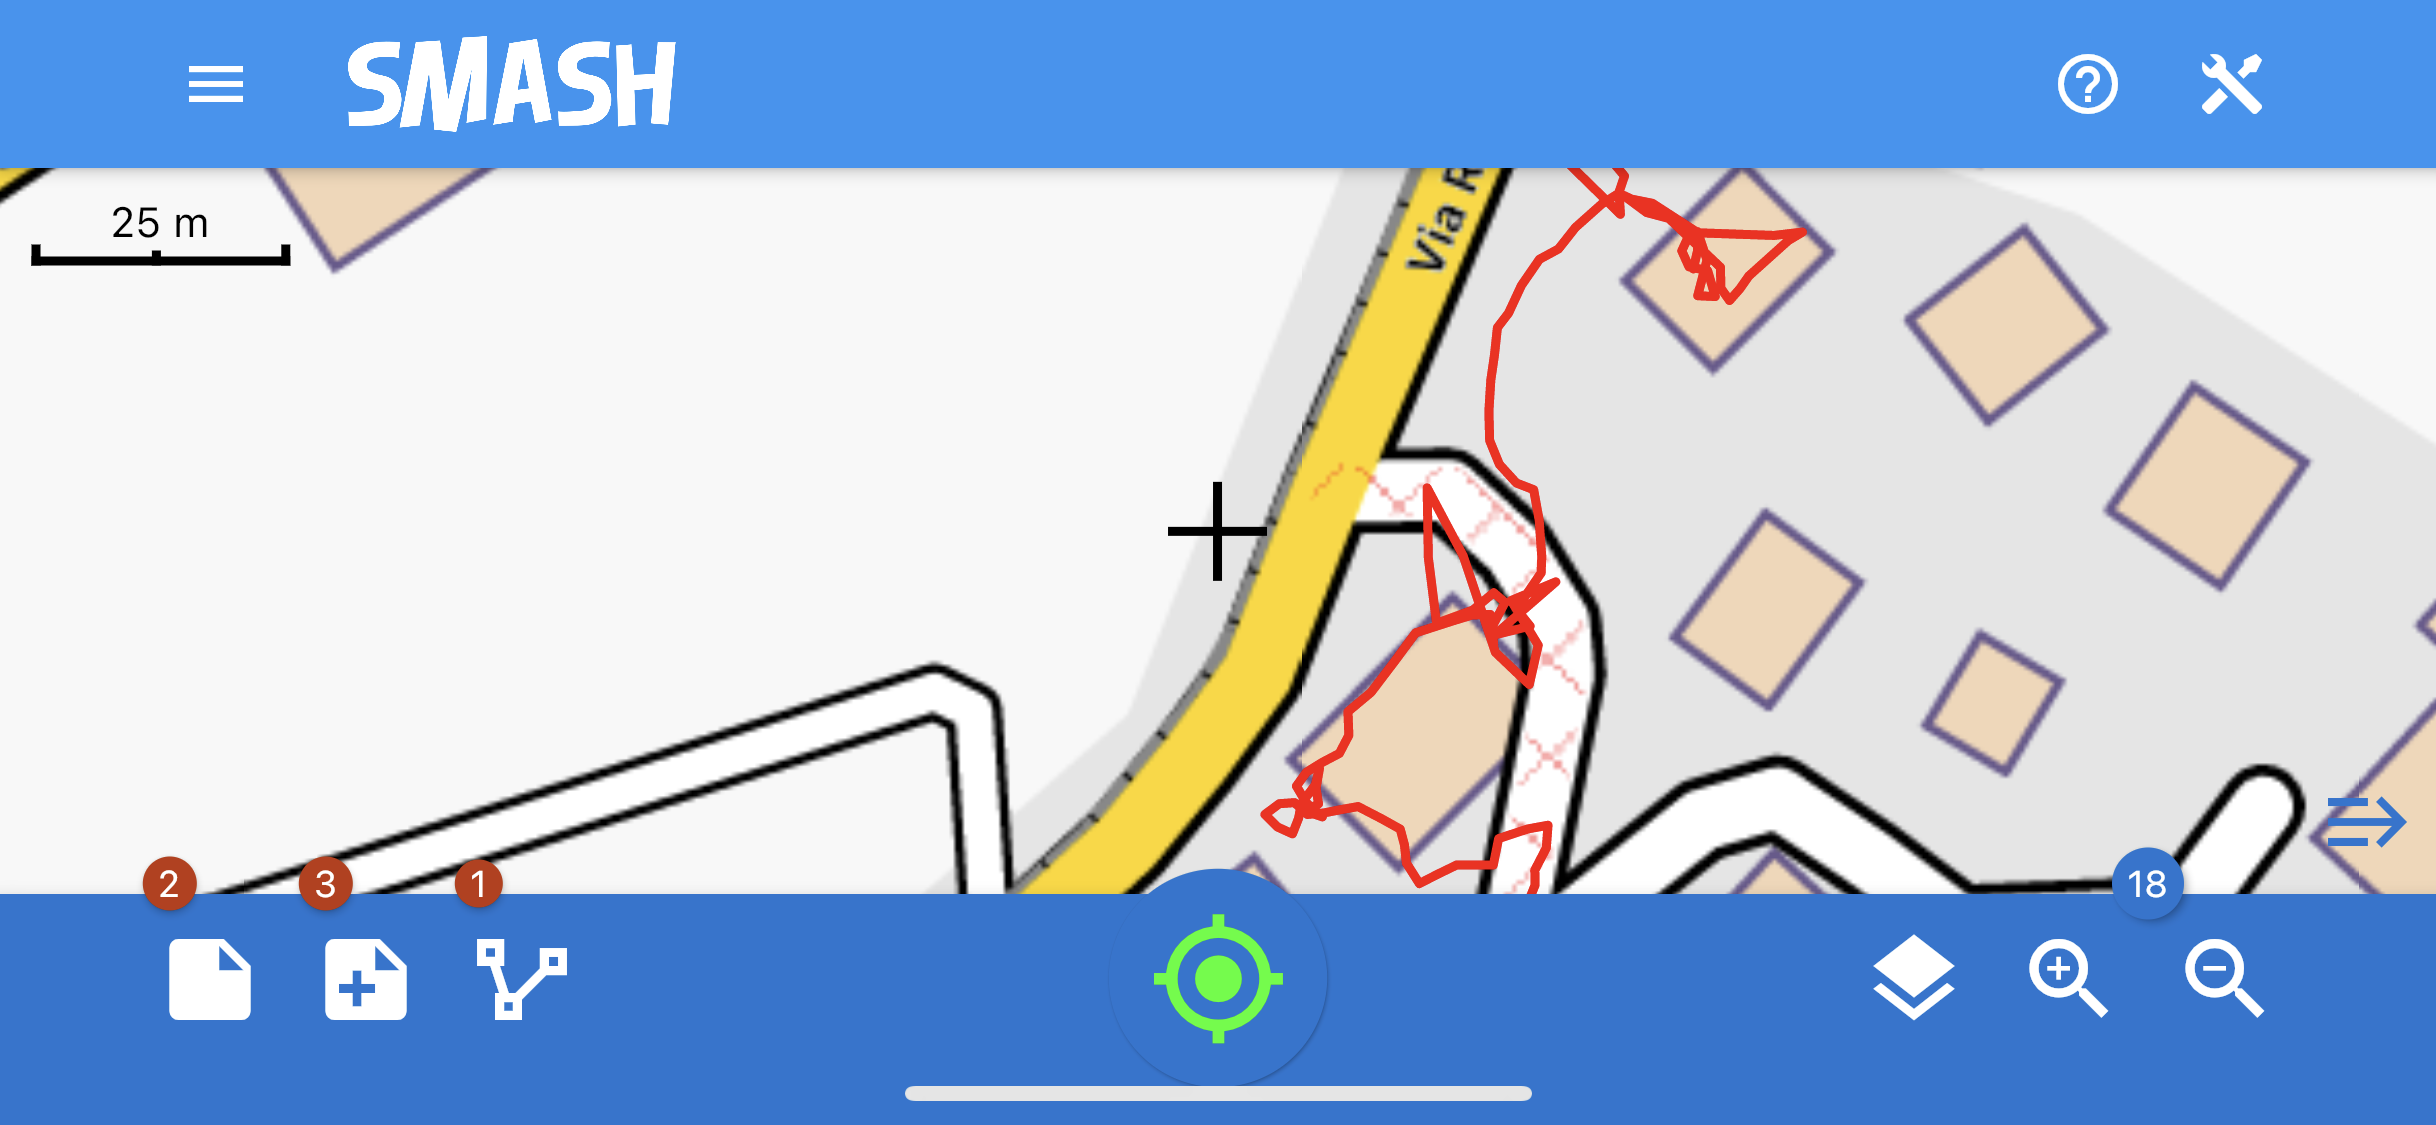
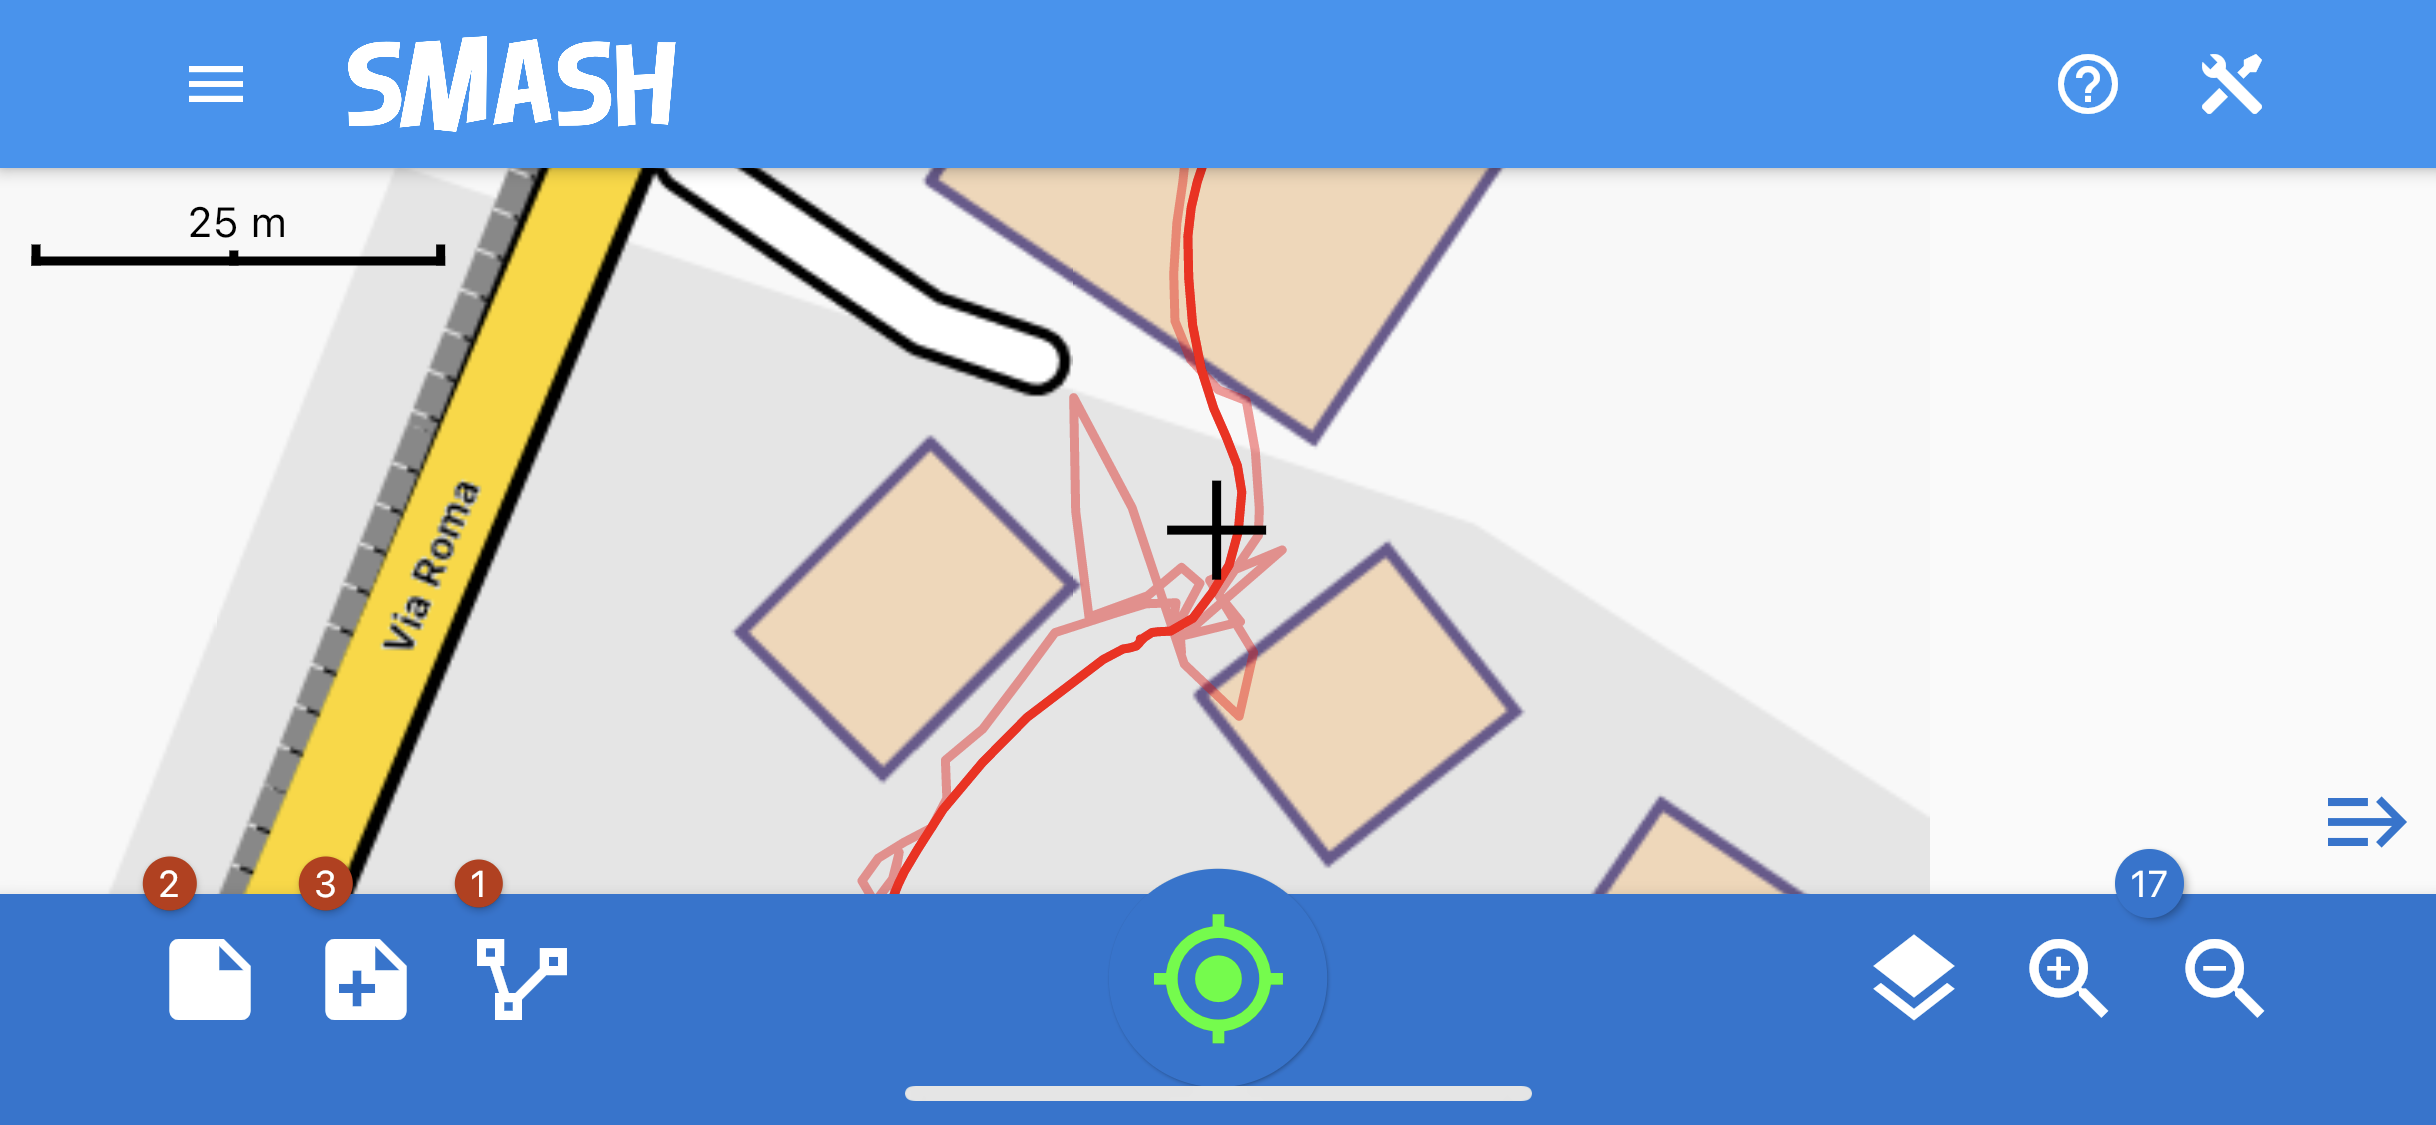
The third icon of the bottom toolbar represents the measurement tool, with this tool the user can drag over the map and have a qualitative measurement of the distance. The path is highlighted in red on the map view and the total distance is shown on top of the measurement icon in the bottom toolbar.
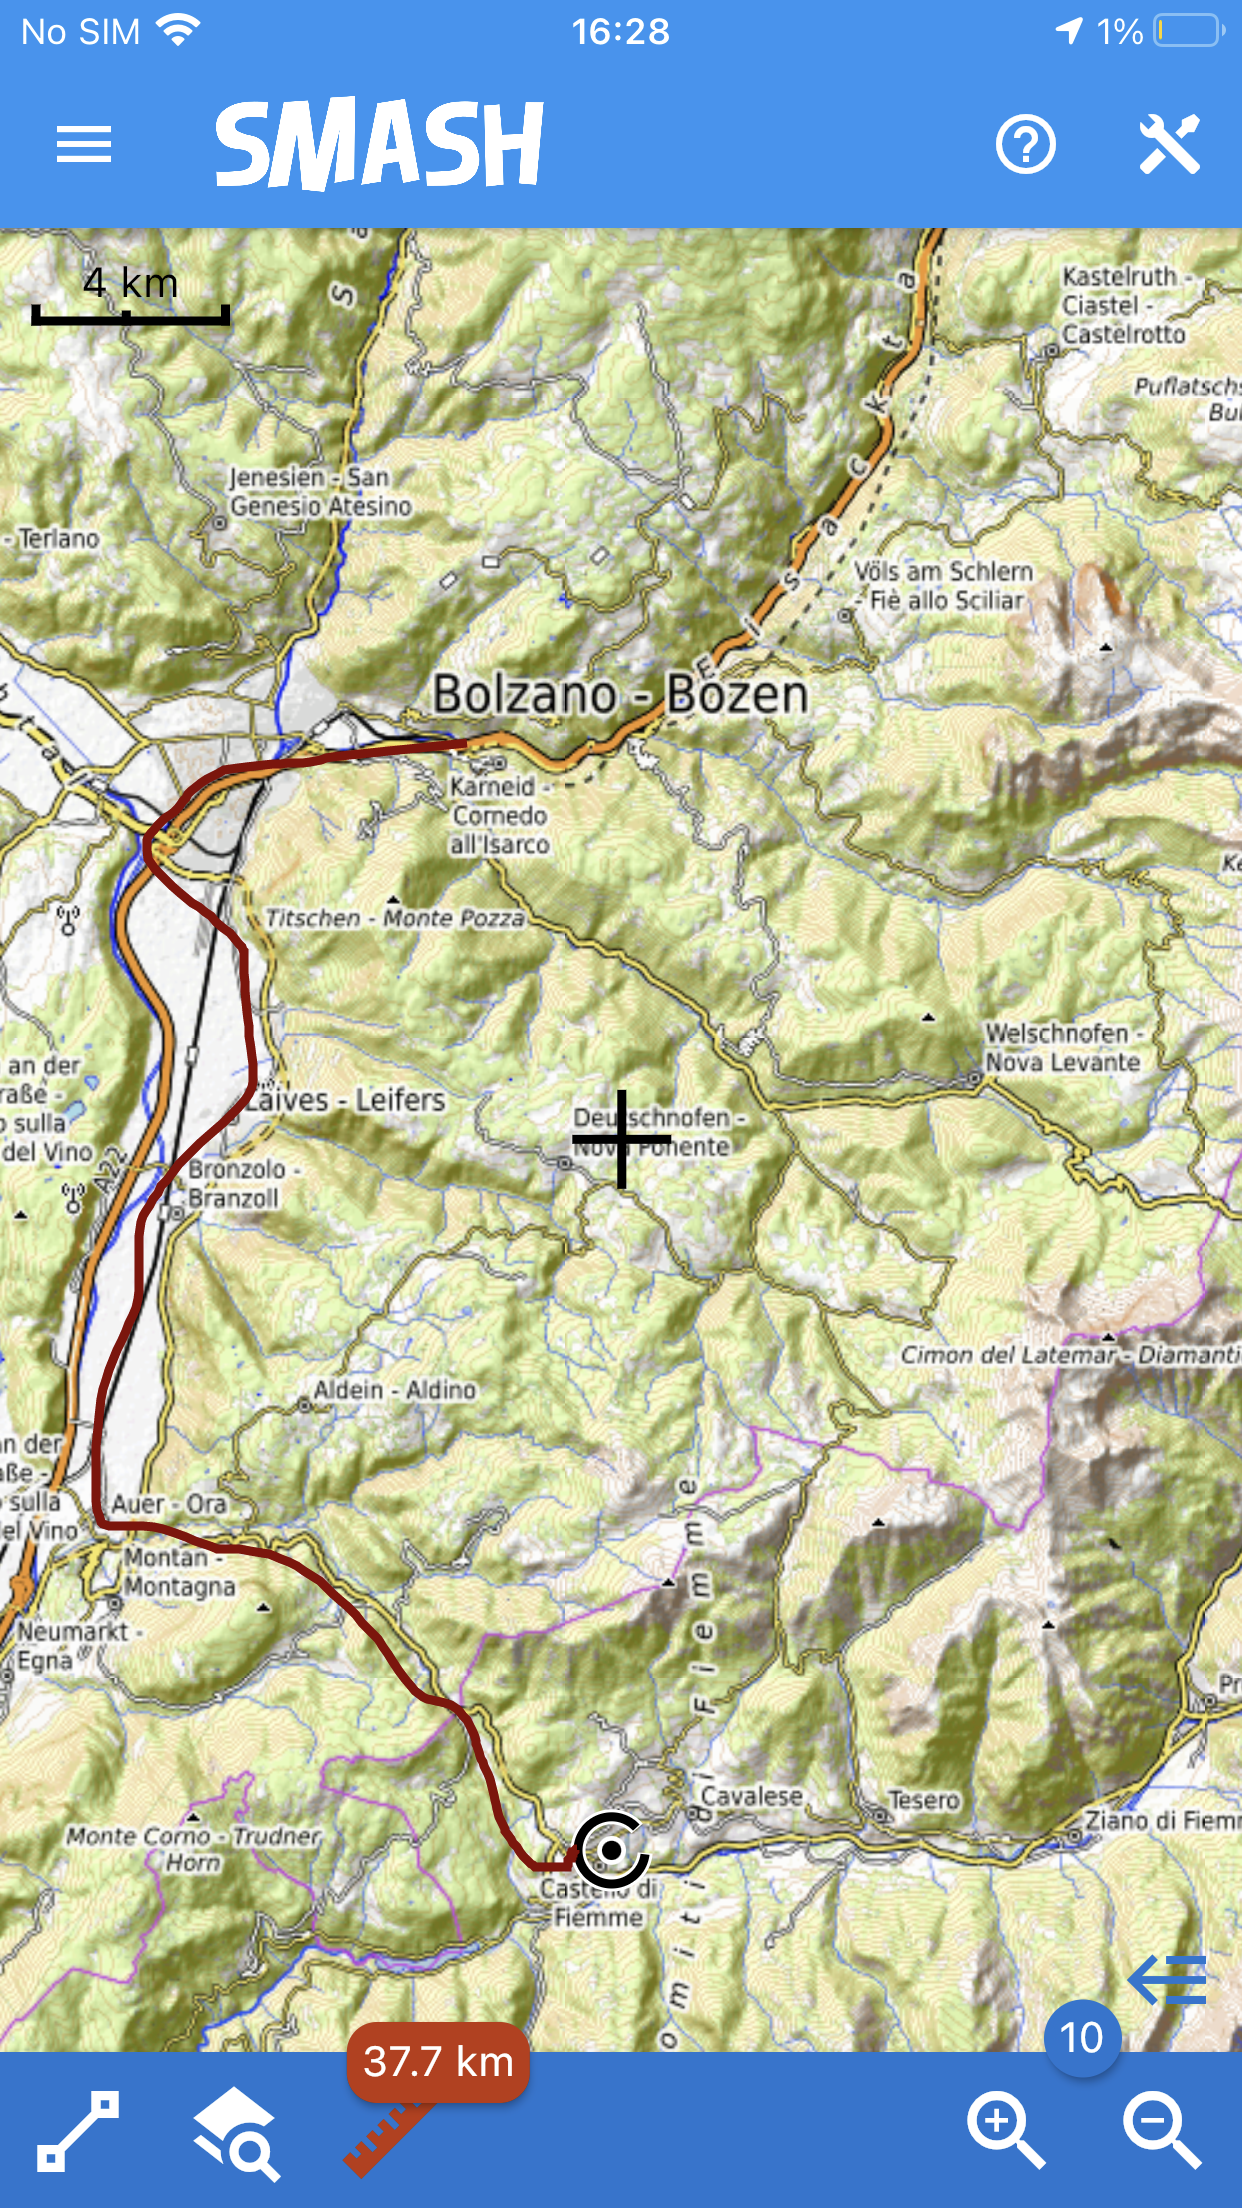
The measurement tool.
6. The tools drawer
The Tools or right Drawer button is placed on the right top action bar.
This menu groups some maps and features tools together with some extra actions.
The complete tools drawer.
6.1. Project Info
It shows the path to the current database and allows the user to share the file with others.
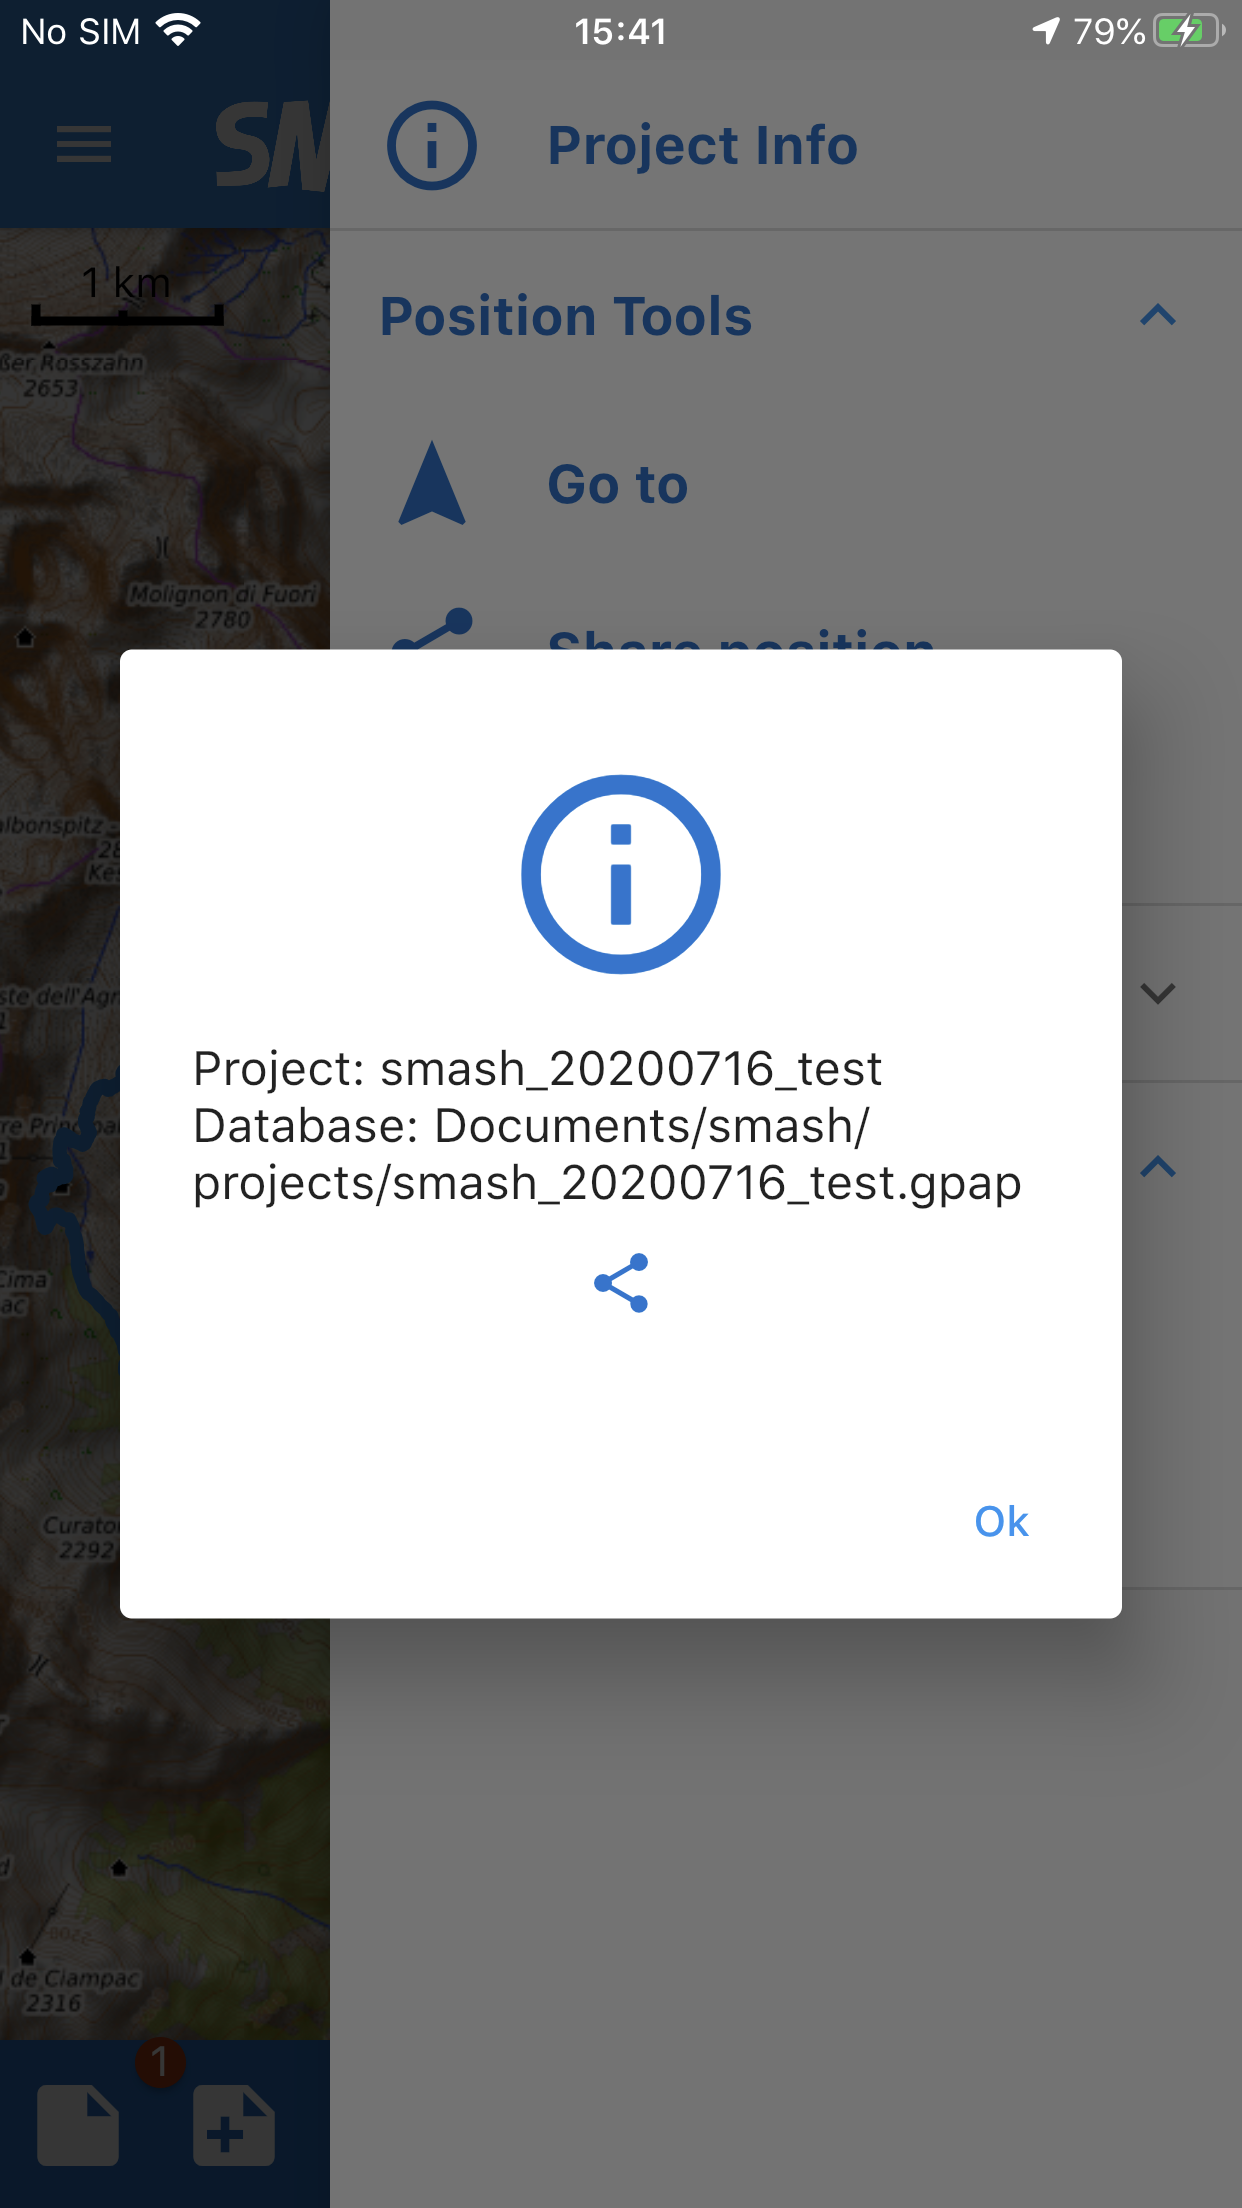
The project info panel with sharing button.
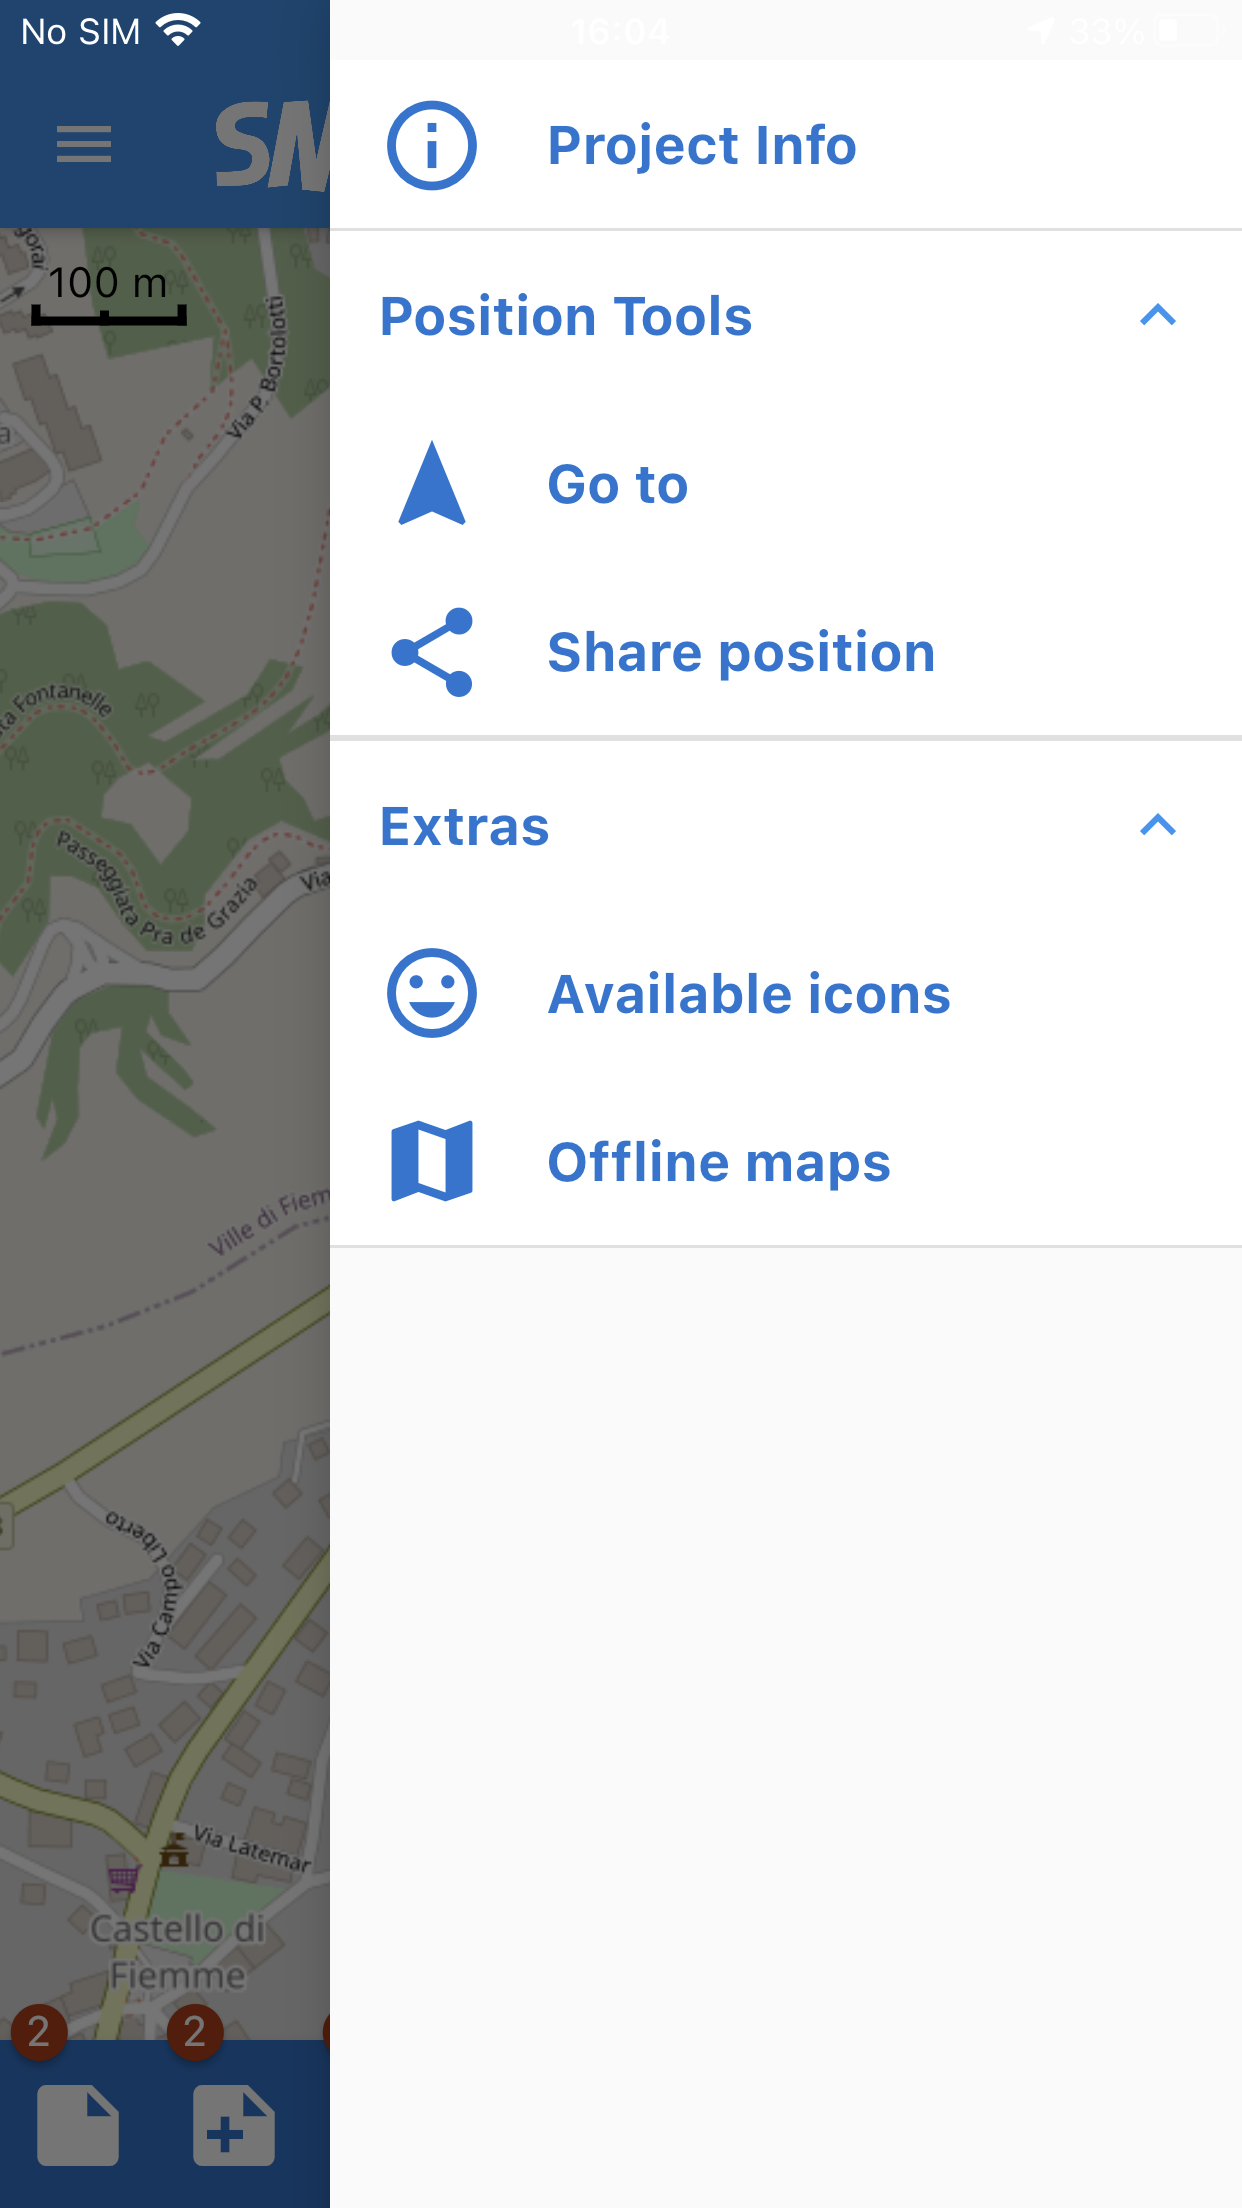
6.2. Position Tools
This section of the tools drawer contais the possibility to:
-
Go to a specified location entered by an address
-
Share position using other applications installed on the device.
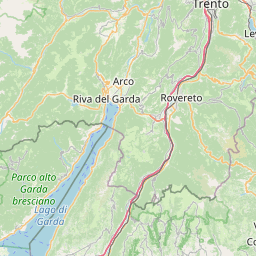
6.2.1. Go to
The go-to function allows to exploit the devices OS geocoding function to find locations based on an address. It is then possible to move the map to the selected result.
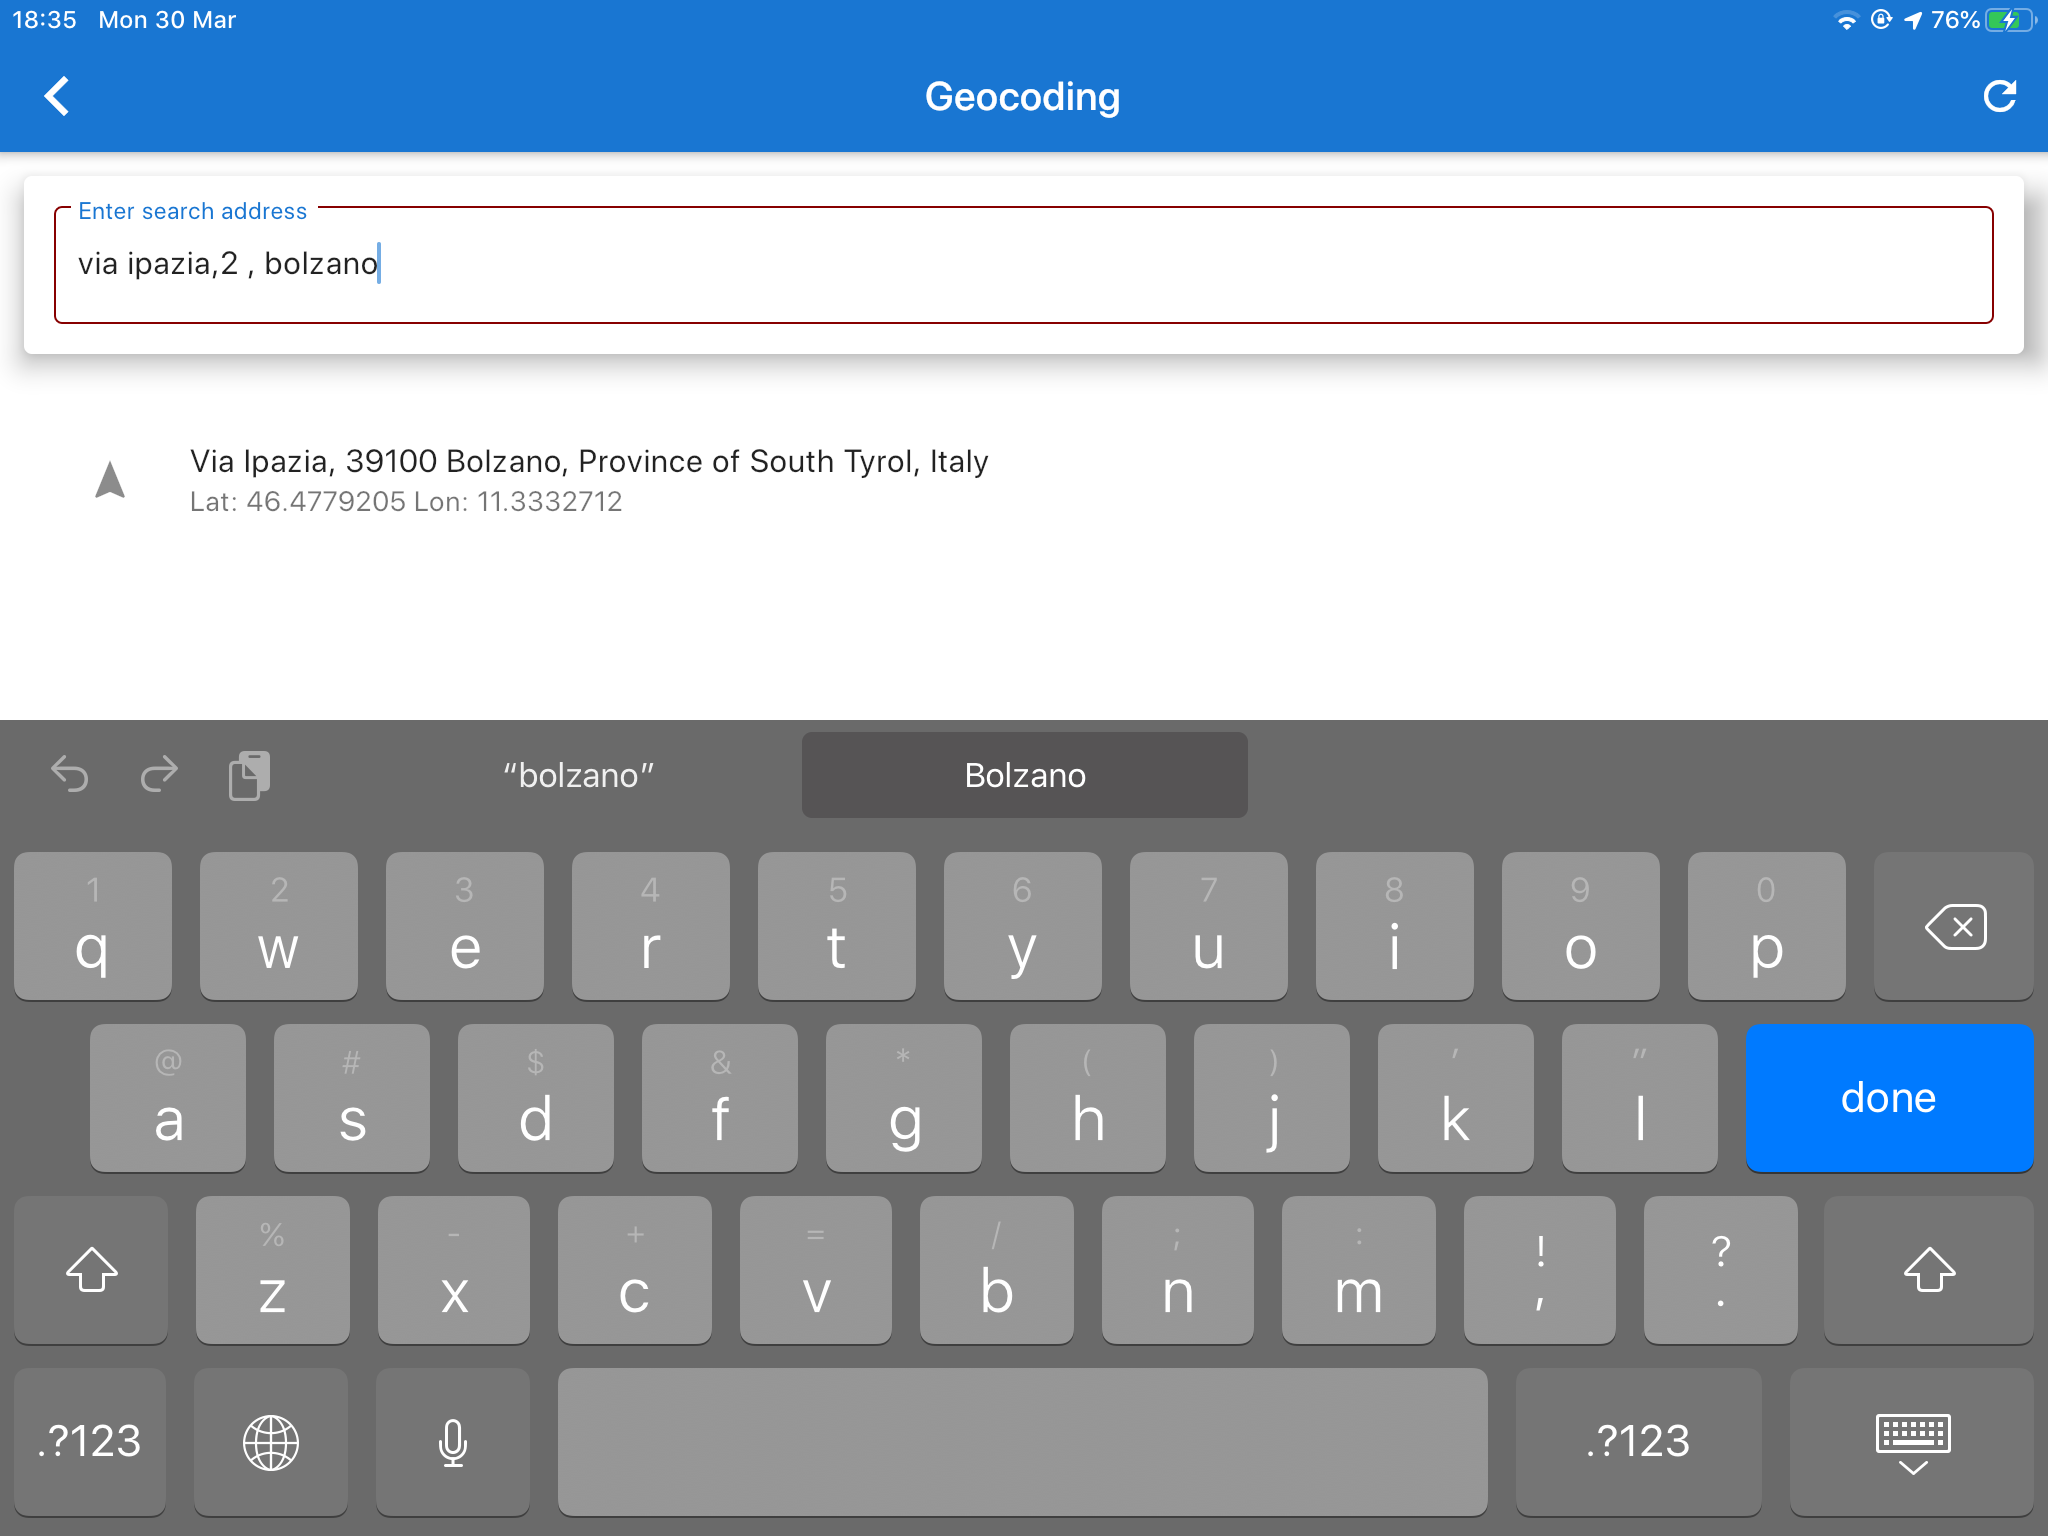
The geocoding view.
6.2.2. Share position
This action allows the user to share the current gps position with the most common social media methods available on the device.
6.3. Extras
This section contains some non specific tools of the application.
6.3.1. Available icons
This action opens the icons view:
The icons view.
In this view the user can select from all the icons of the material design icons project, which ones should appear in the notes properties view and therefore used as markers in the map.
The names that appear in the list can also be used to enable icons for form notes, as explained in the forms section.
6.3.2. Offline maps
SMASH has a builtin function to download mapsforge (see supported map types) map files for the whole world.
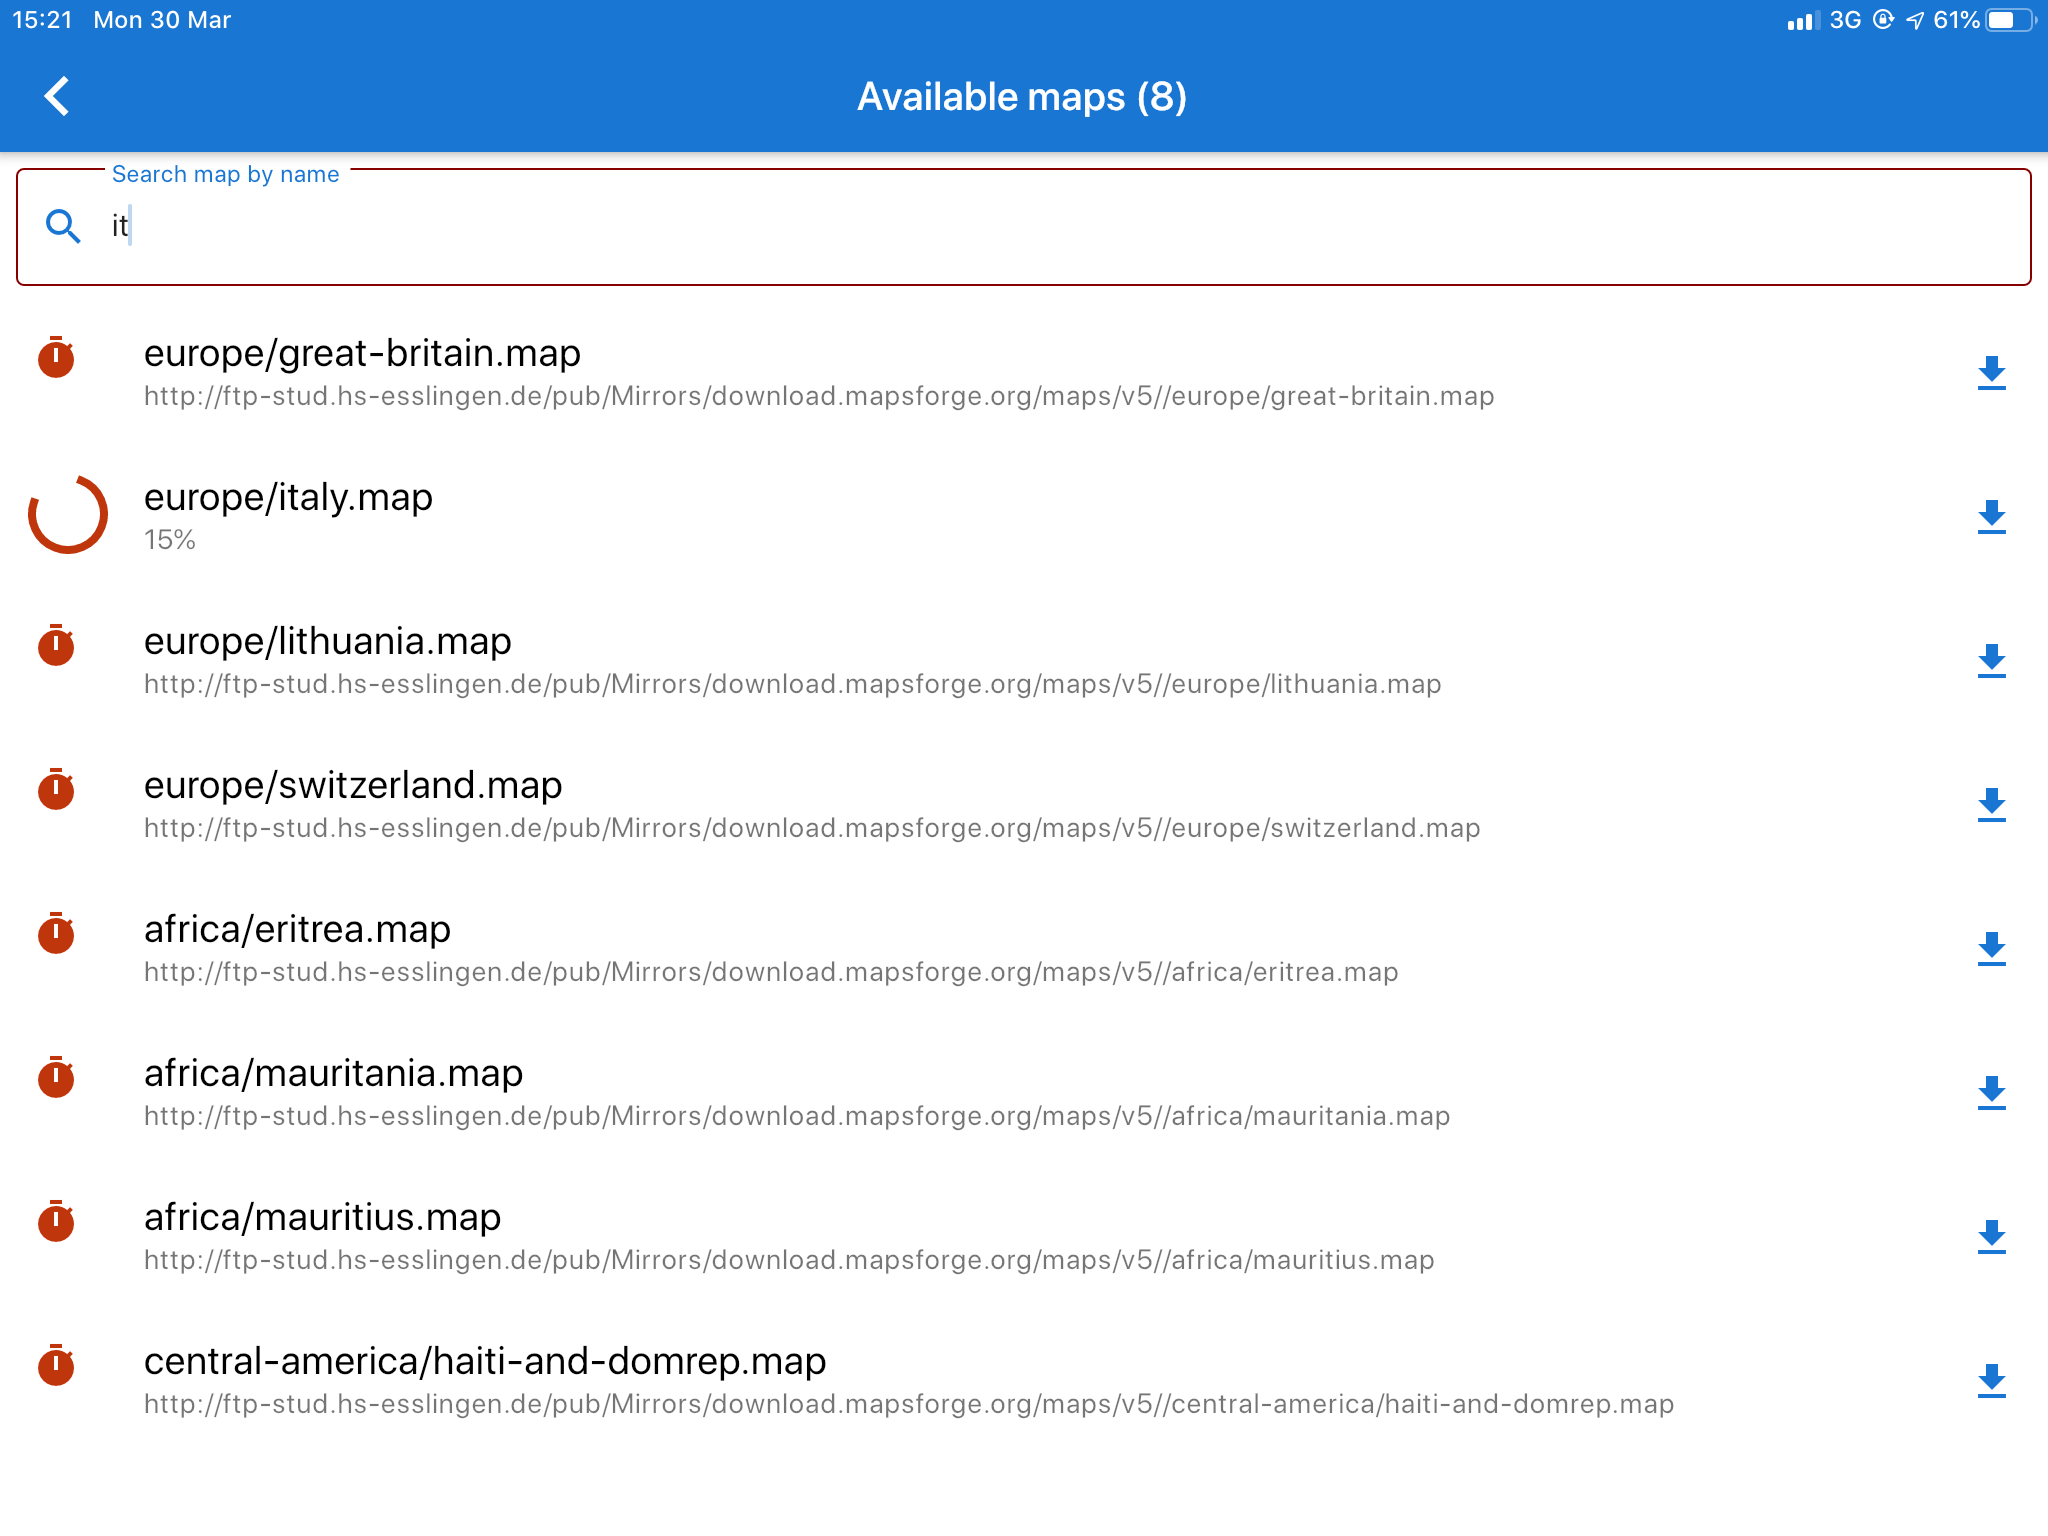
The icons view.
Once a map is tapped, the download starts. This can take a while when downloading large countries.
| At the current time, due to a tecnical issue in the flutter framework, the visualization of mapsforge maps at low zoomlevel leads to freezing of the user interface, since the tiles are generated in the main thread. Therefore, after the download, SMASH performs a one-time tile generation for low zoomlevels, freezing the user interface. It is suggested to let this process finish, in order to later experience a smooth map navigation using mapsforge maps. |
7. The main drawer
The left drawer contains some of the main operations that a user usually performs while not actively taking notes.
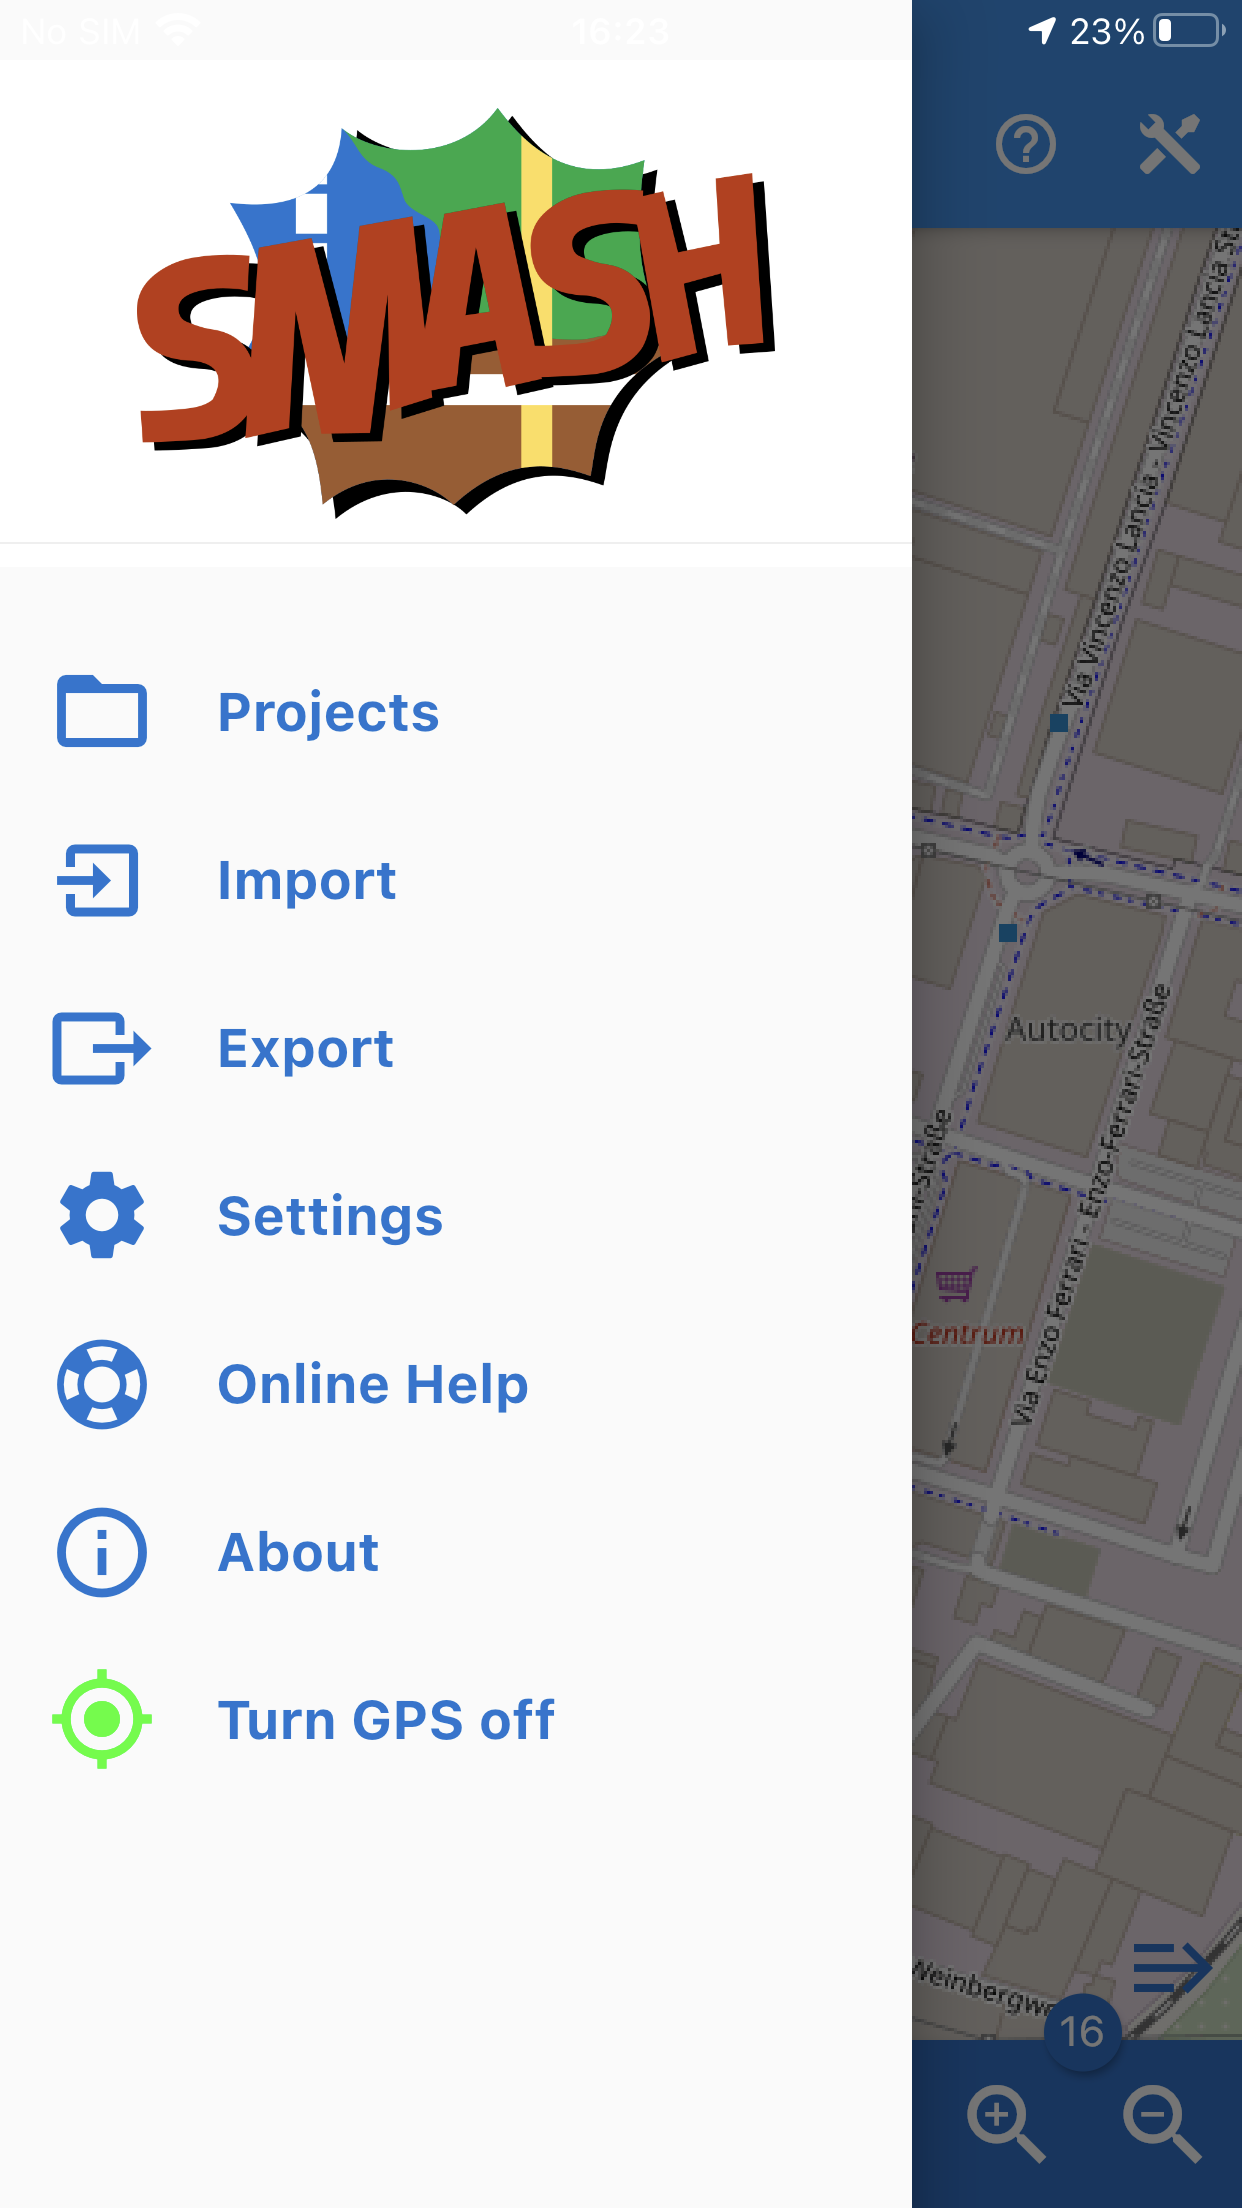
The main, or left, drawer.
7.1. Project
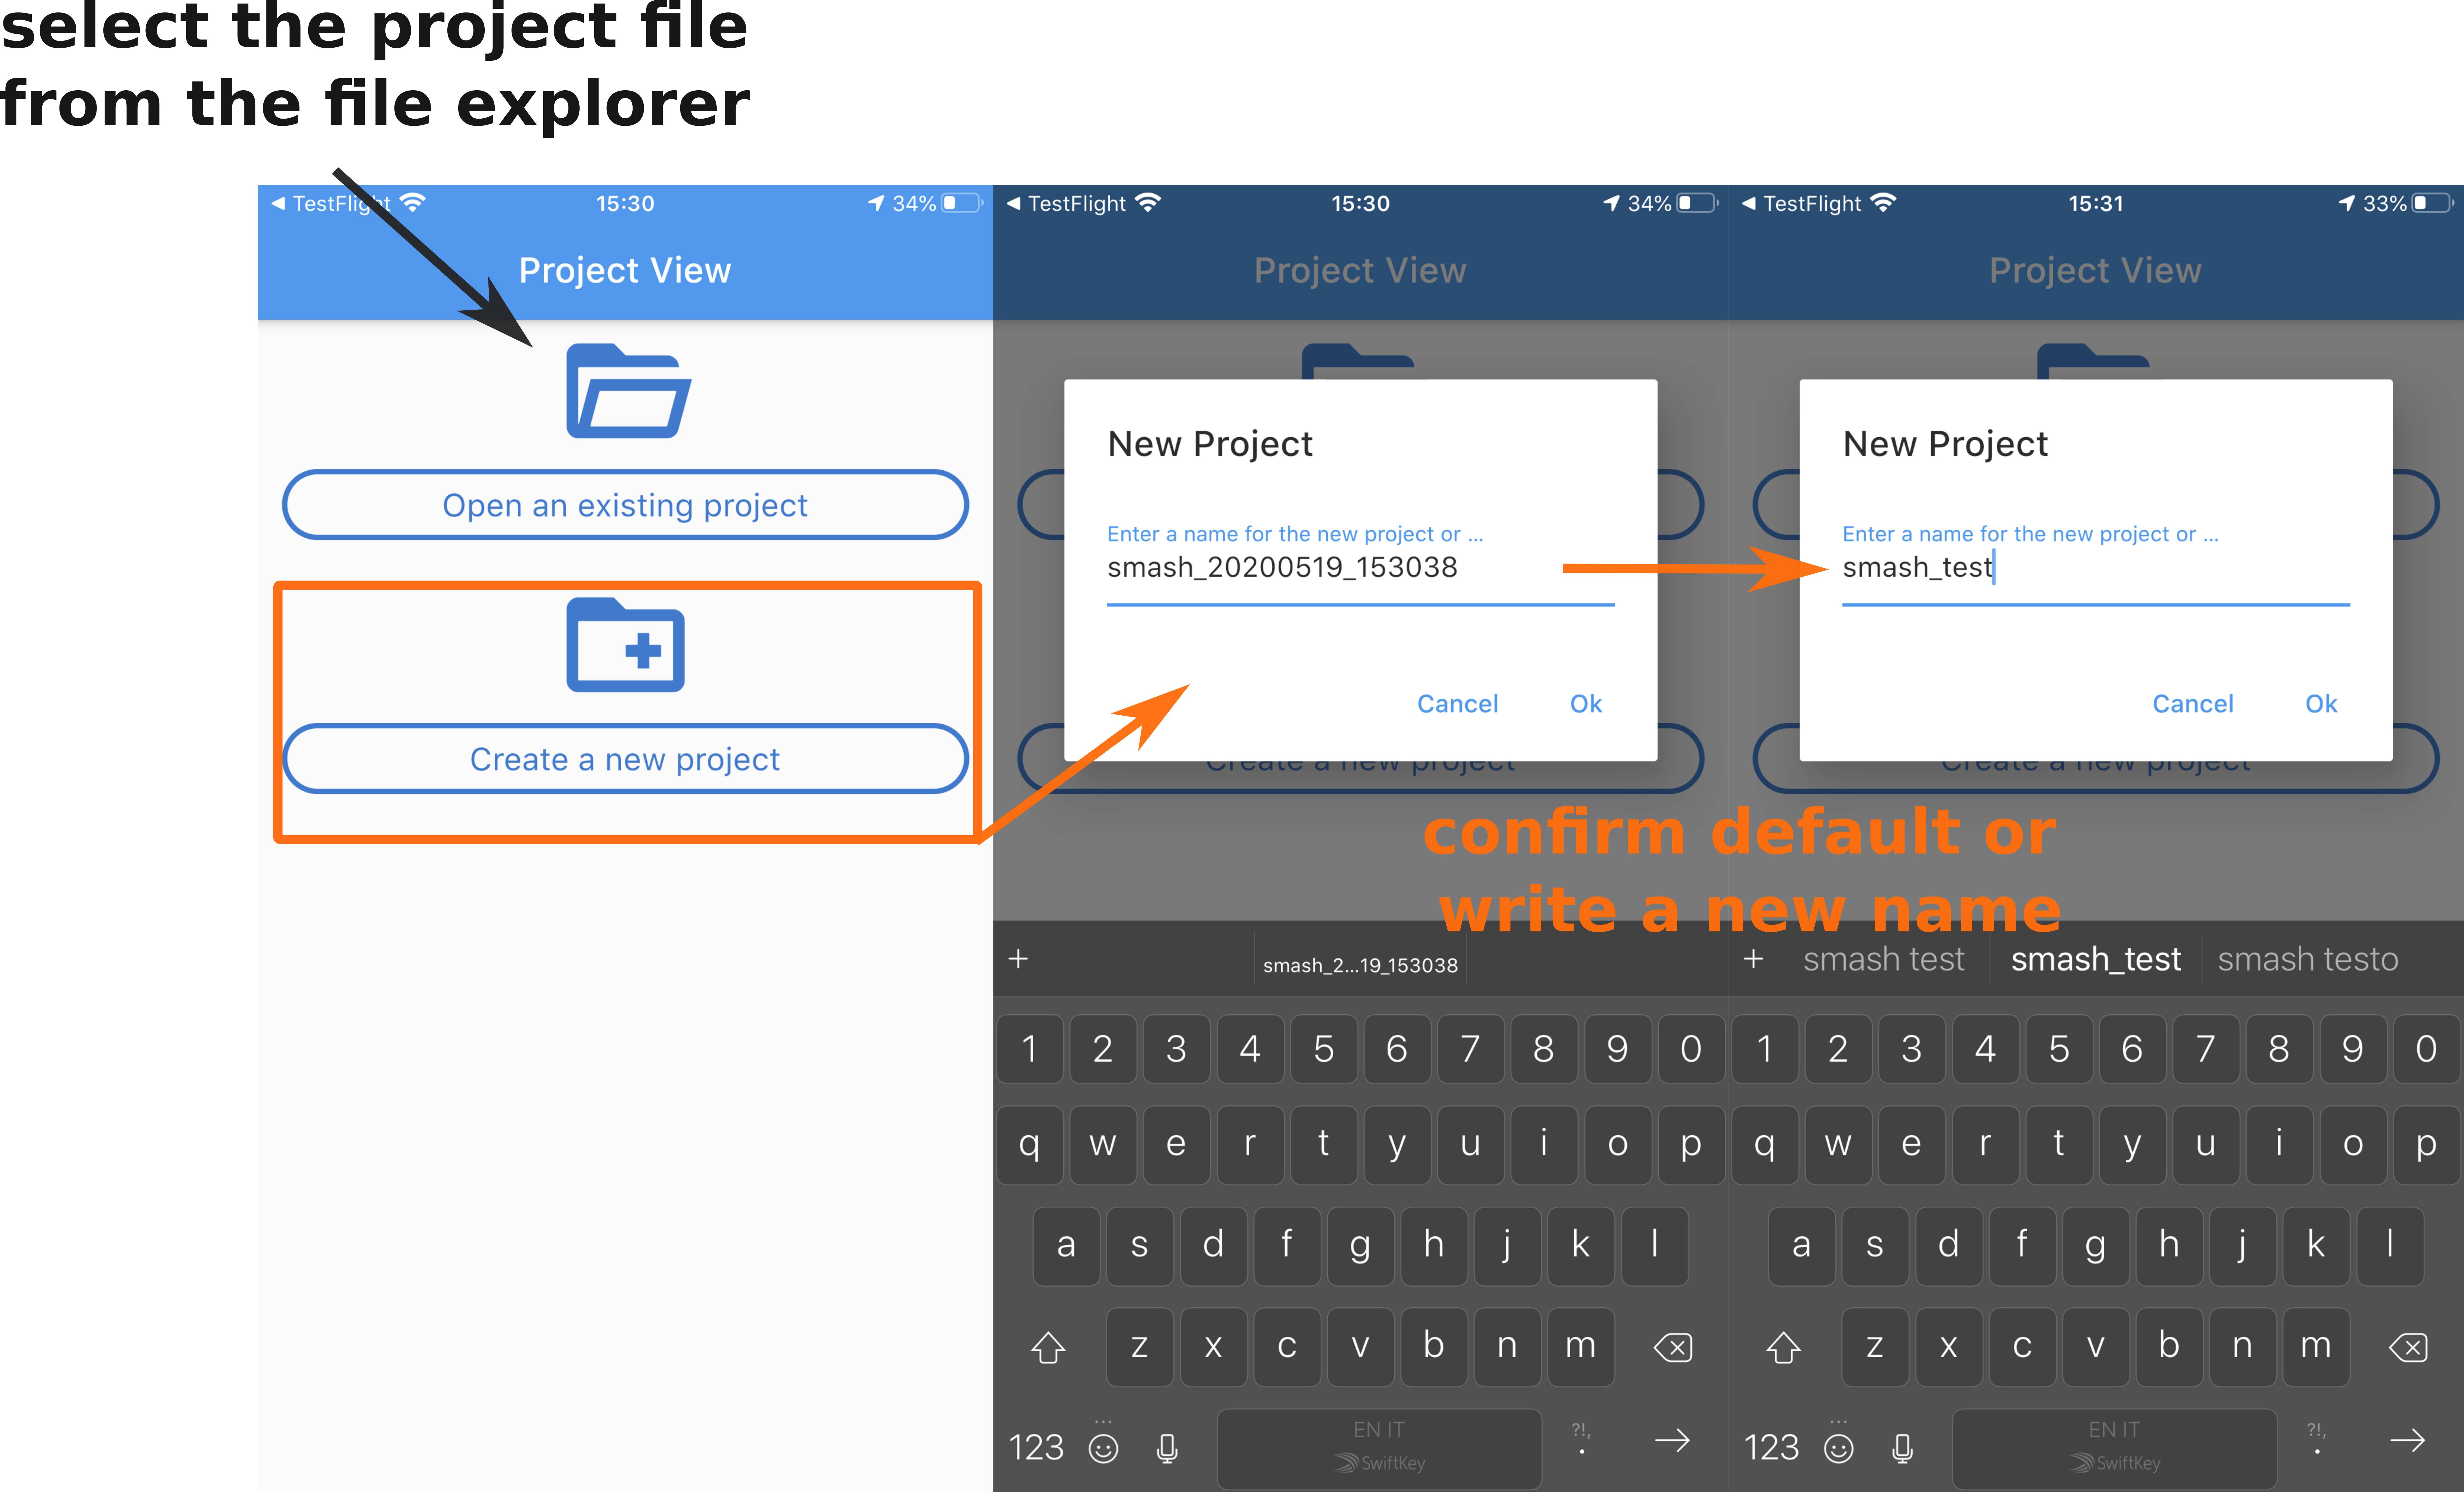
When tapping on the Project action, the user is prompted to the starting panel (Project view) where it is possible to Open and existing project, Create a new project :
-
browse the local folders to select an existing project
-
insert a new name for the project or accept the default one based on the timestamp
or select one of the most Recent projects from the list.
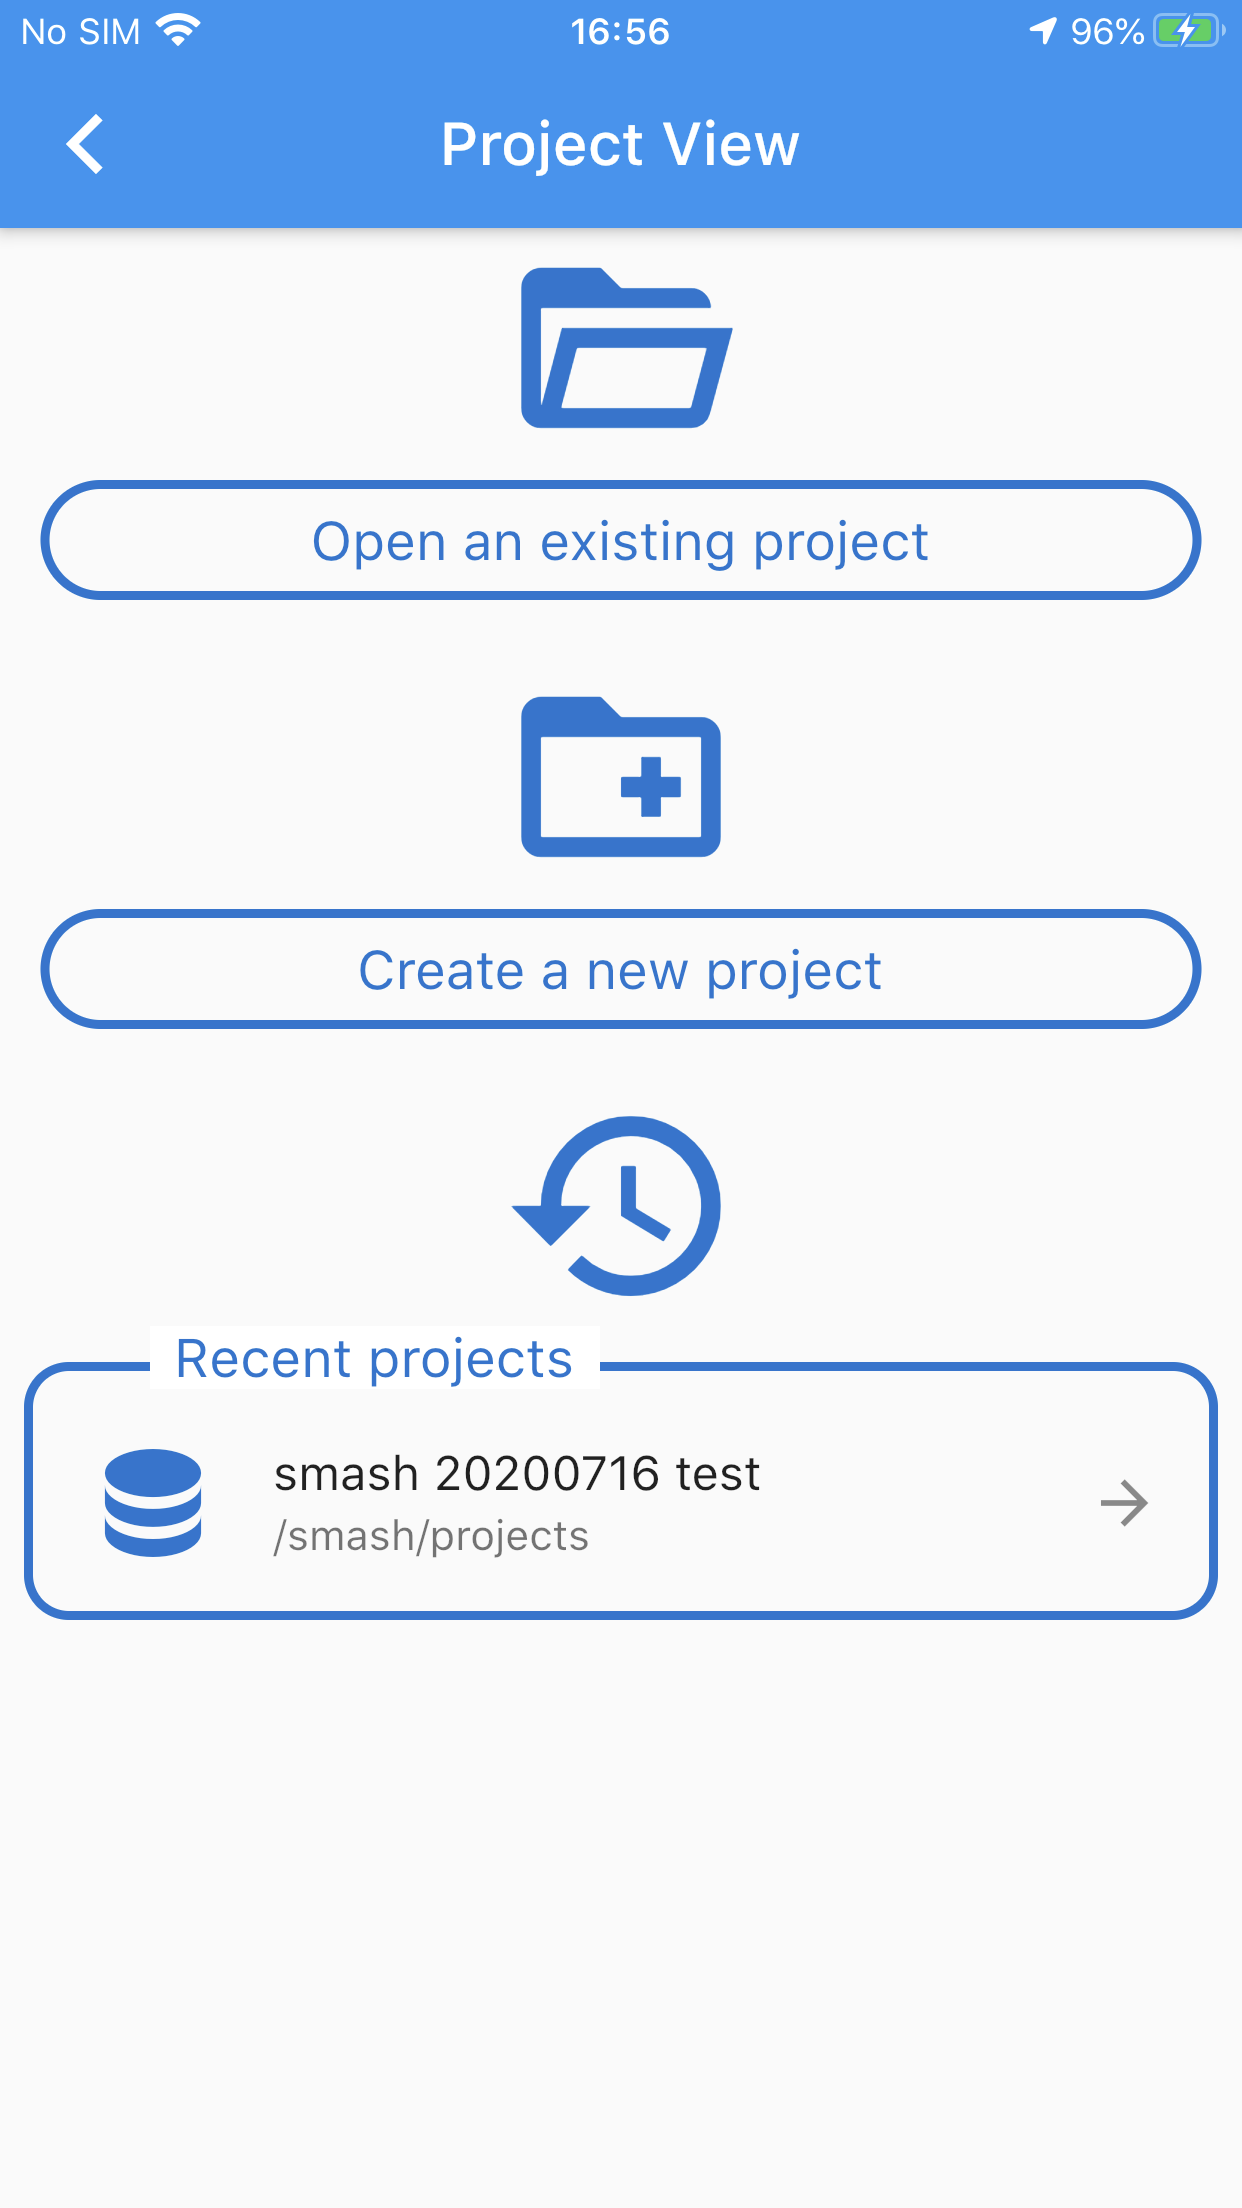
The Project View.
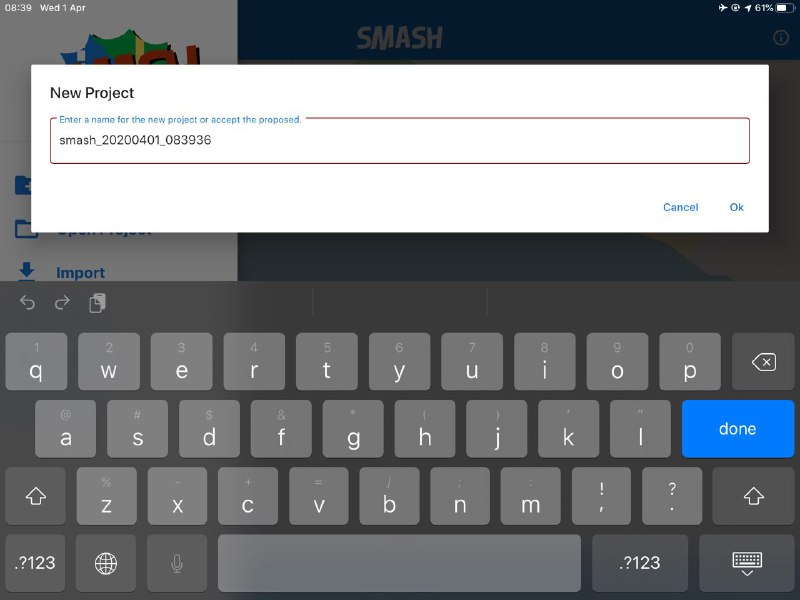
The new project dialog.
New projects will be created inside the application’s folder structure. To open old projects browse the project folder inside the local application’s folder.
SMASH projects are of the exact same type as those of the Geopaparazzi project. That is the reason the extension of the file is gpap.
Once selected, the project is loaded.
7.2. Import
SMASH allows to import data from the Geopaparazzi Survey Server.
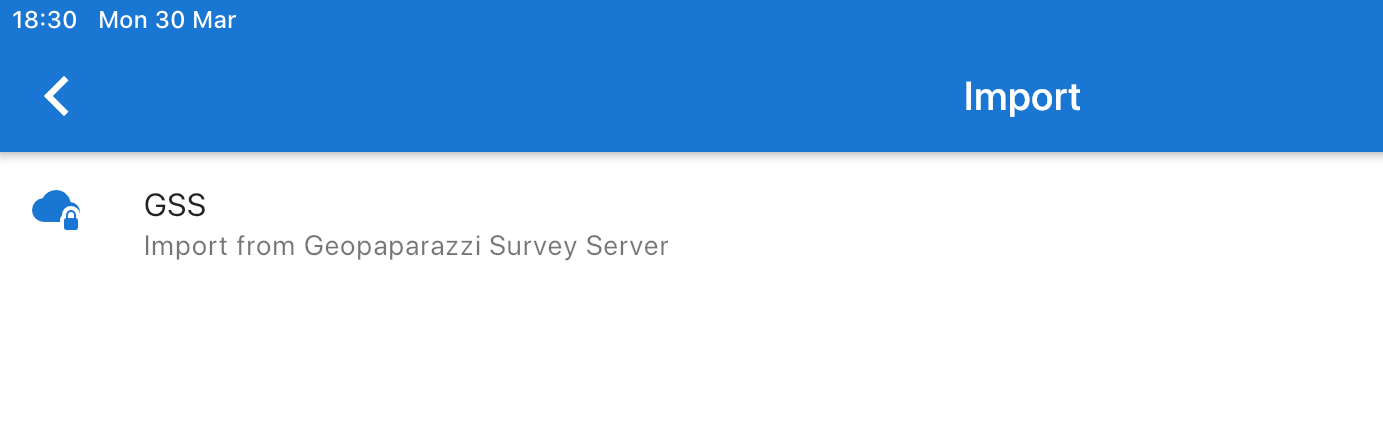
The import view.
In fact SMASH is currently the suggested tool to synchronize Geopaparazzi and SMASH surveys with the GSS.
When entering the GSS import view, a list of datasets, projects and forms available from the server is presented to the user:
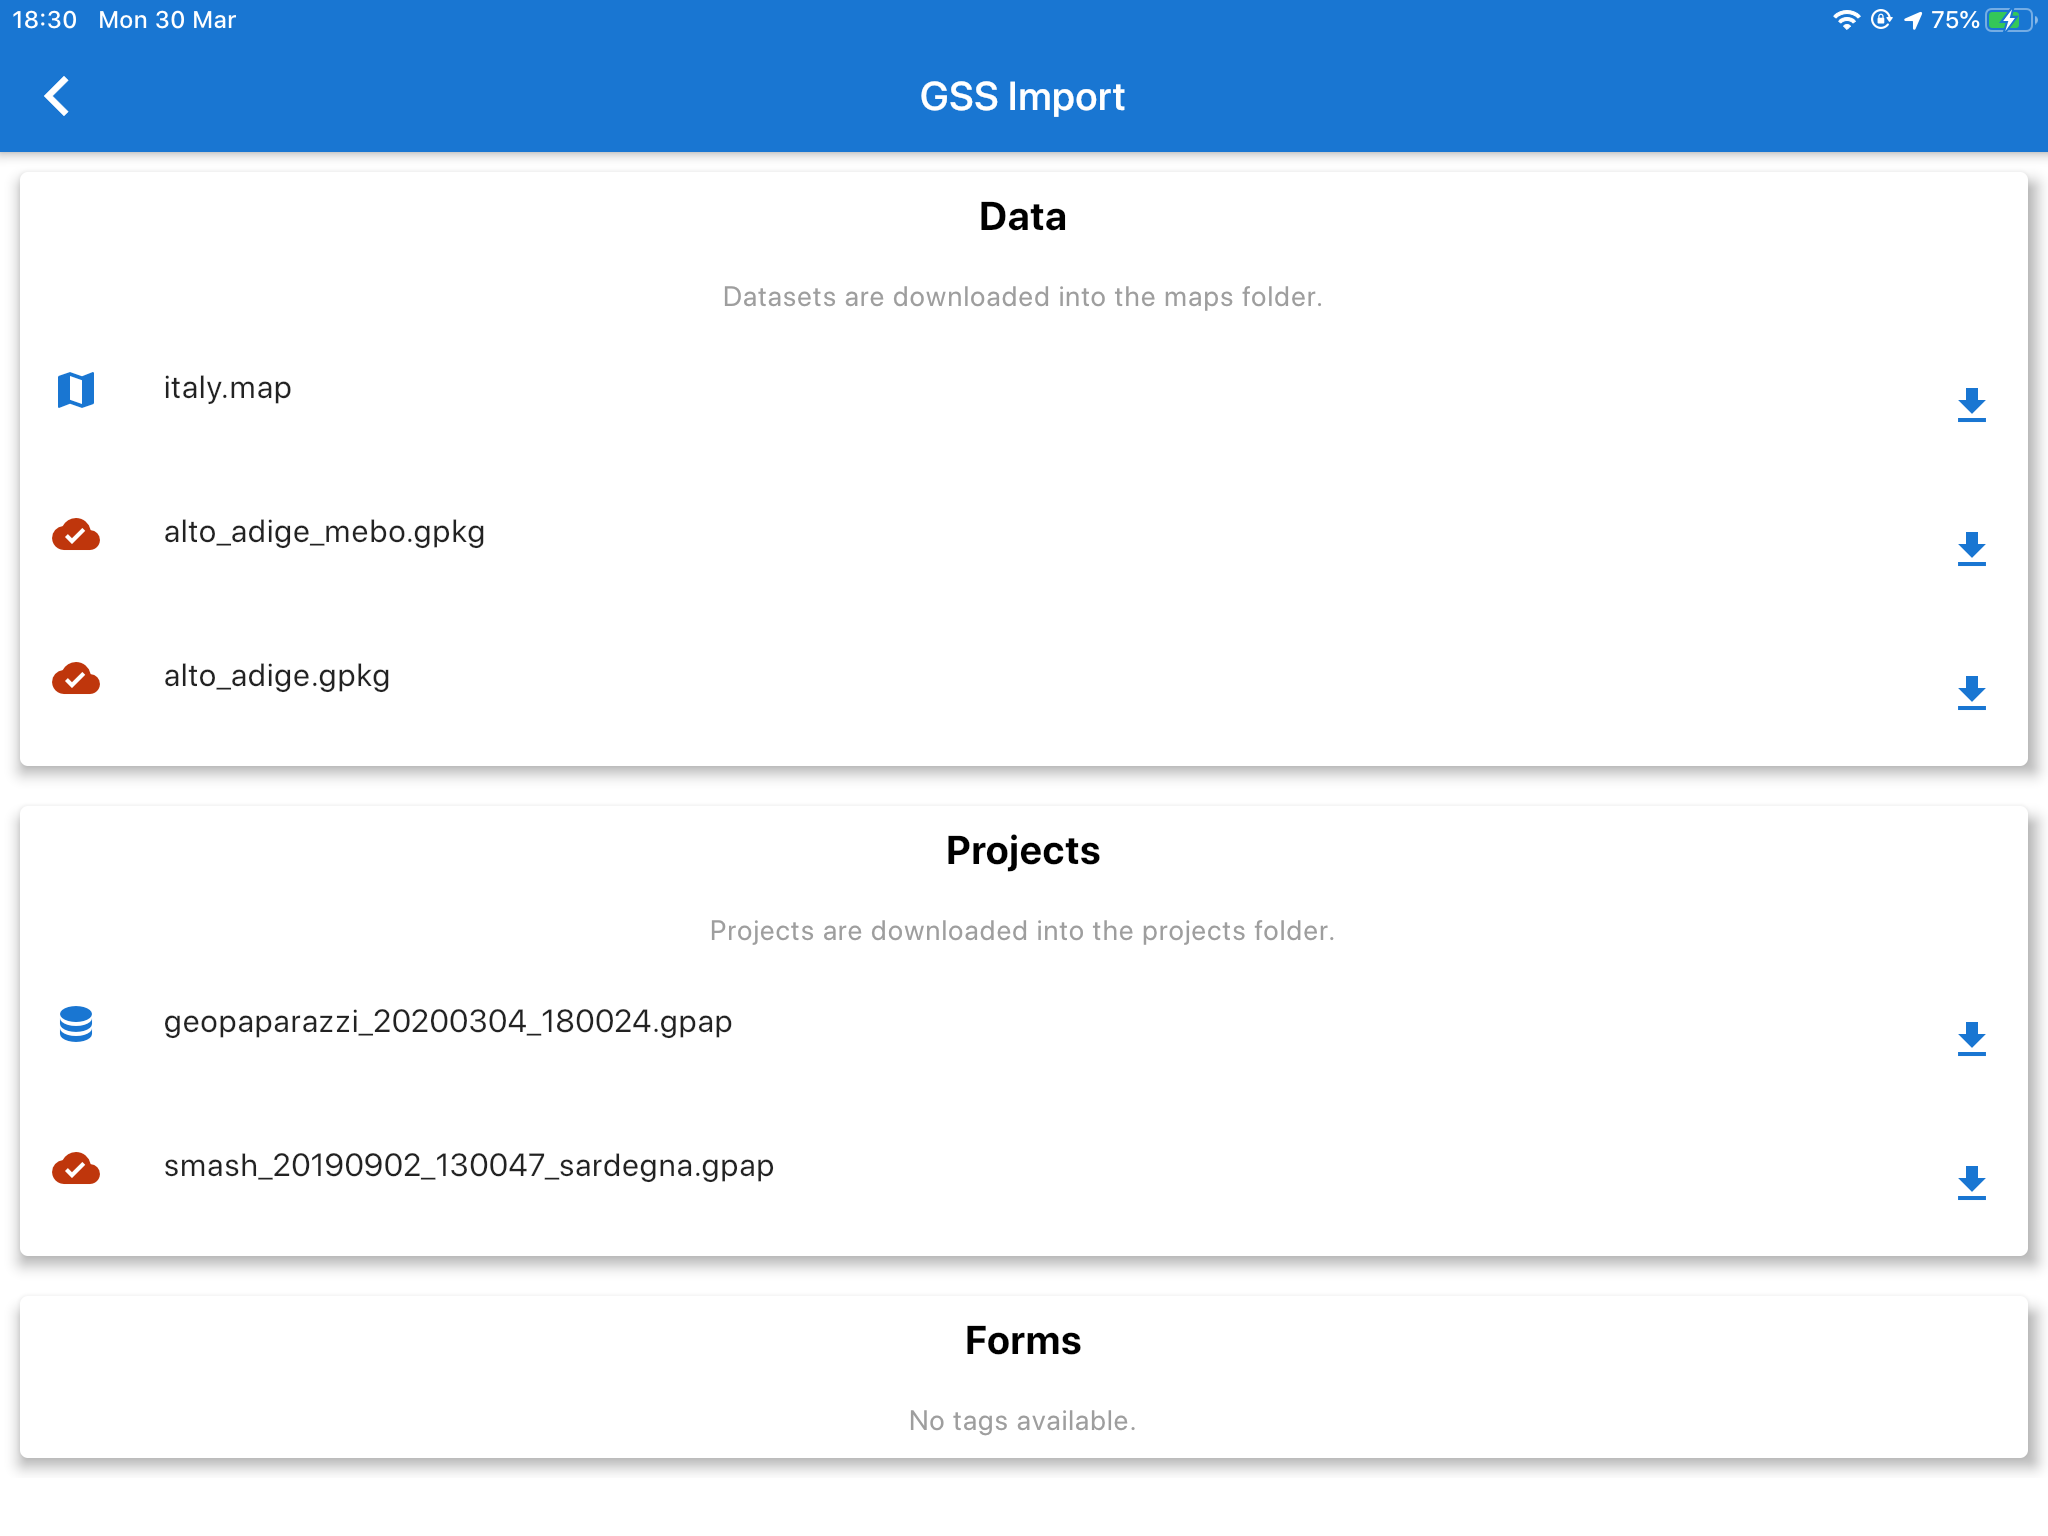
The gss import view.
Using the left icon, data can be downloaded to the device. Once downloaded the application will show what datasets are still available.
7.3. Export
SMASH is currently able to export to files and to synchronize the project with the Geopaparazzi Survey Server.
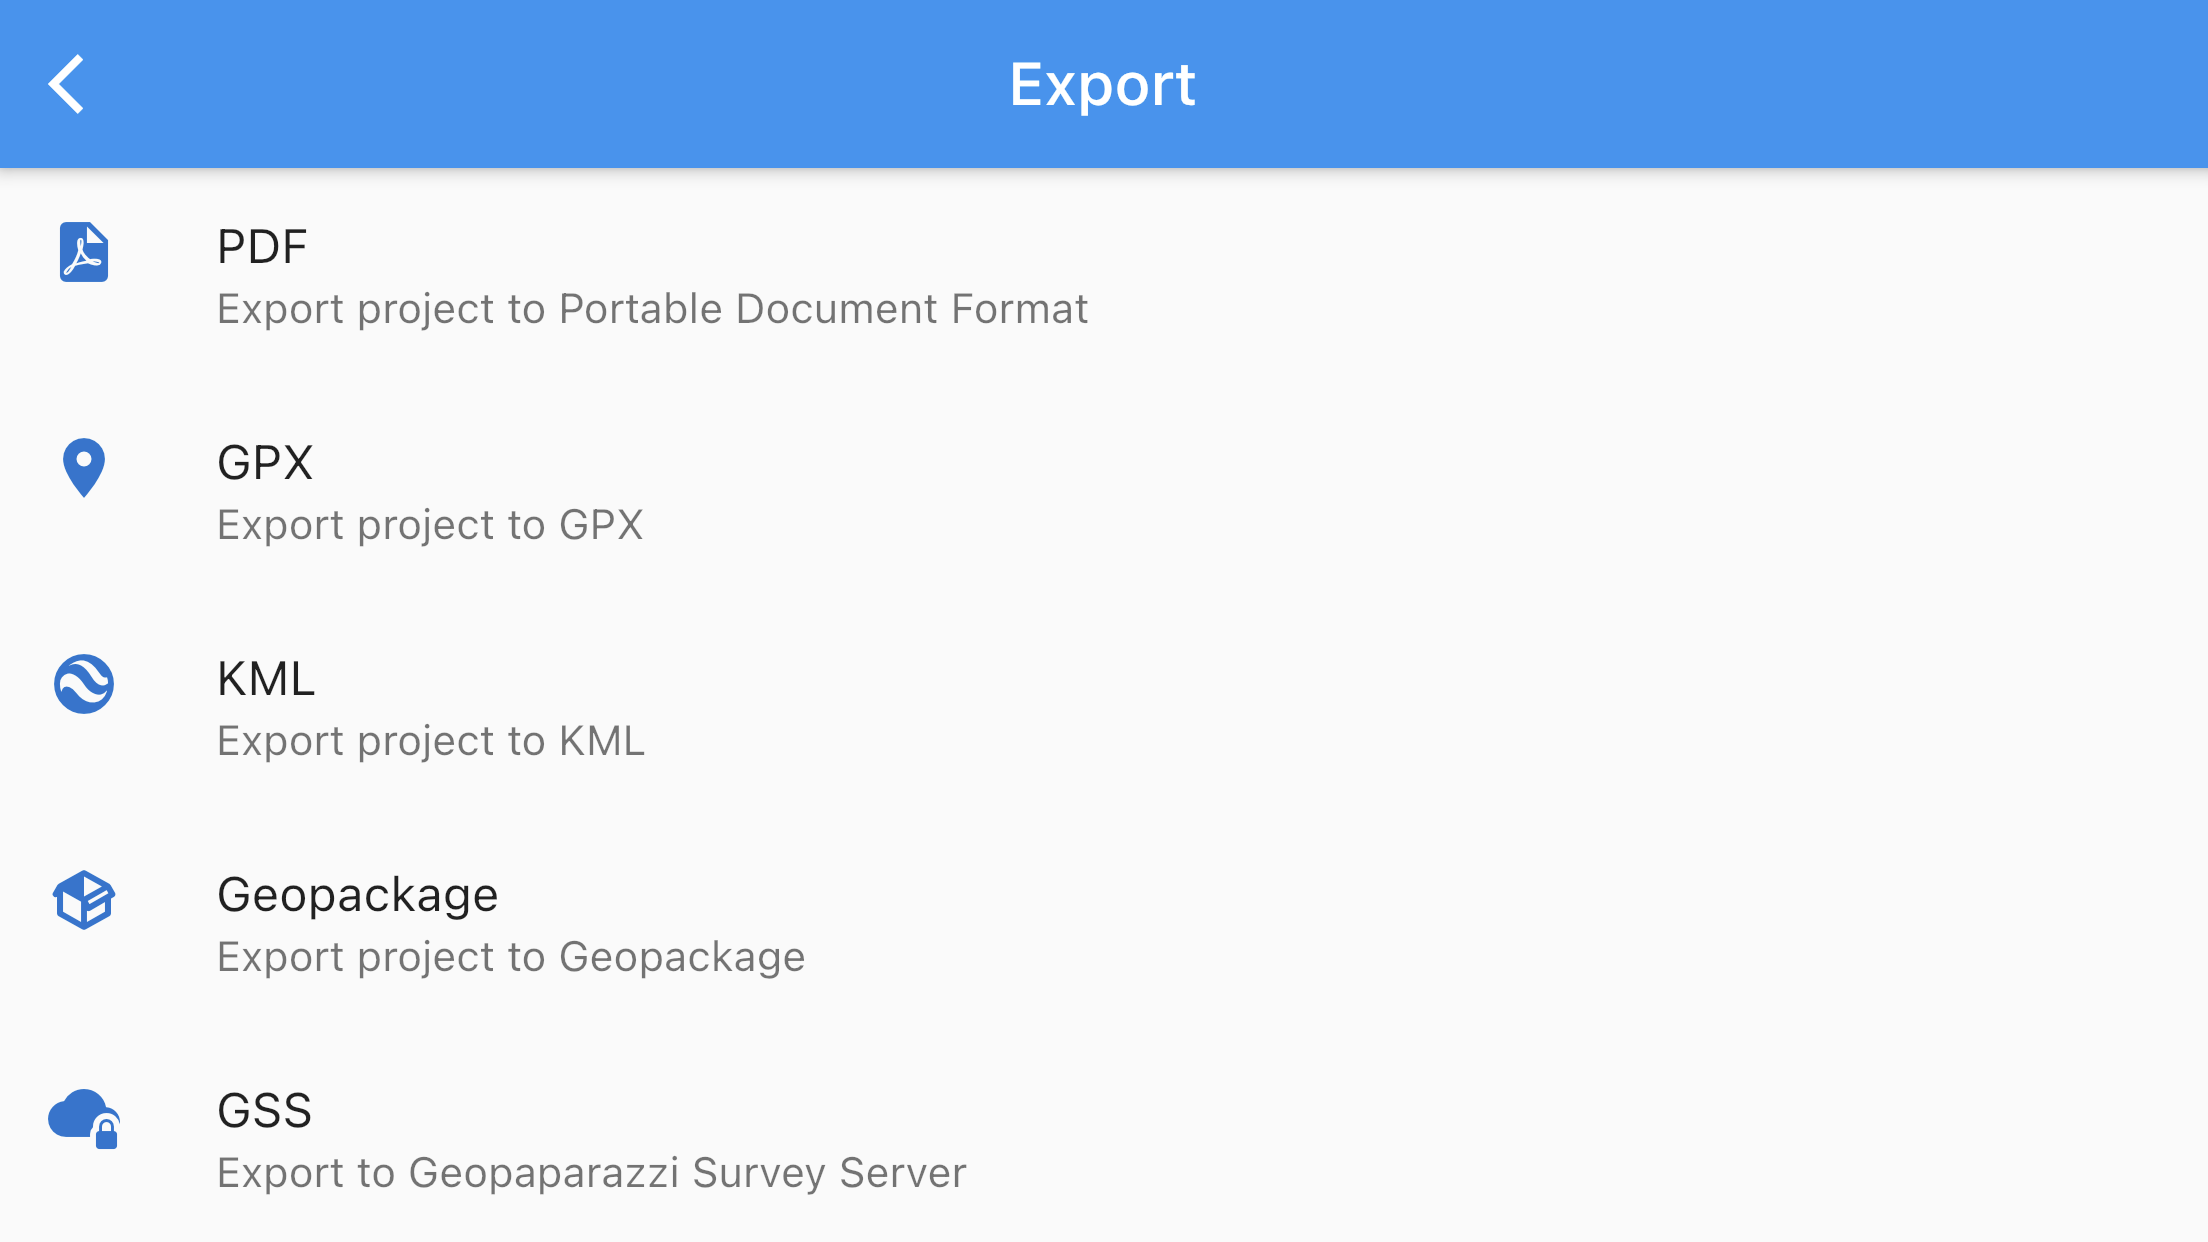
The PDF export view.
7.3.1. PDF
When pushing the pdf export button, a pdf containing all the notes in the project (simple and form based), is generated and saved to the export folder in the application directory.
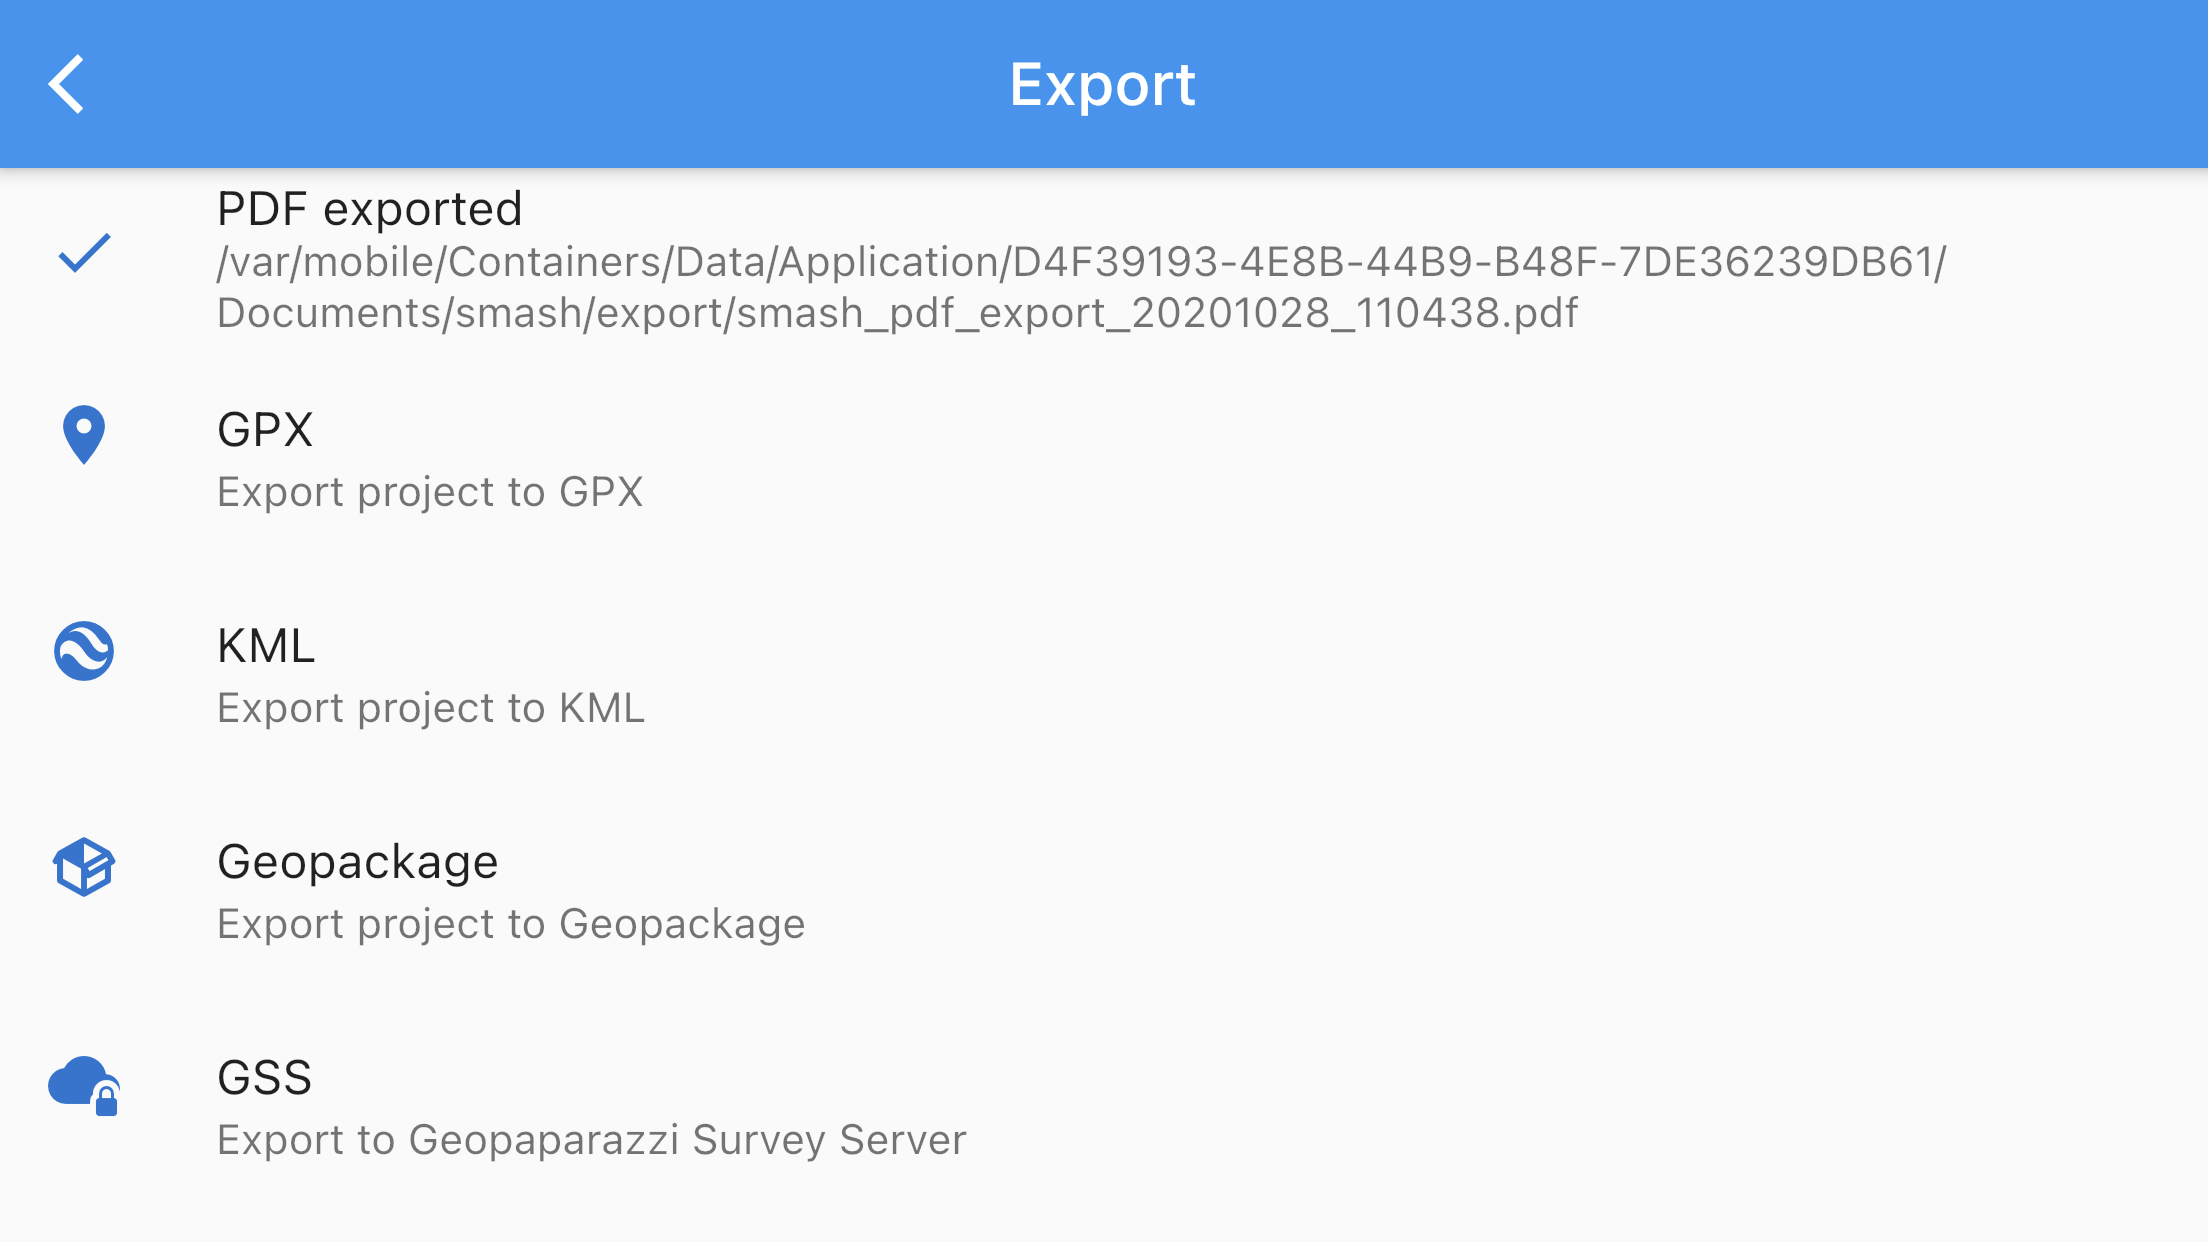
The export view.
7.3.2. GPX
When pushing the gpx export button, the application exports the whole survey project to a single GPX and saves the file in the export folder in the application directory.
7.3.3. KML
When pushing the kml export button, the application exports the whole survey project to a single KML and saves the file in the export folder in the application directory.
7.3.4. GEOPACKAGE
When pushing the Geopackage export button, the application exports the whole survey project to a single Geopackage and saves the file in the export folder in the application directory.
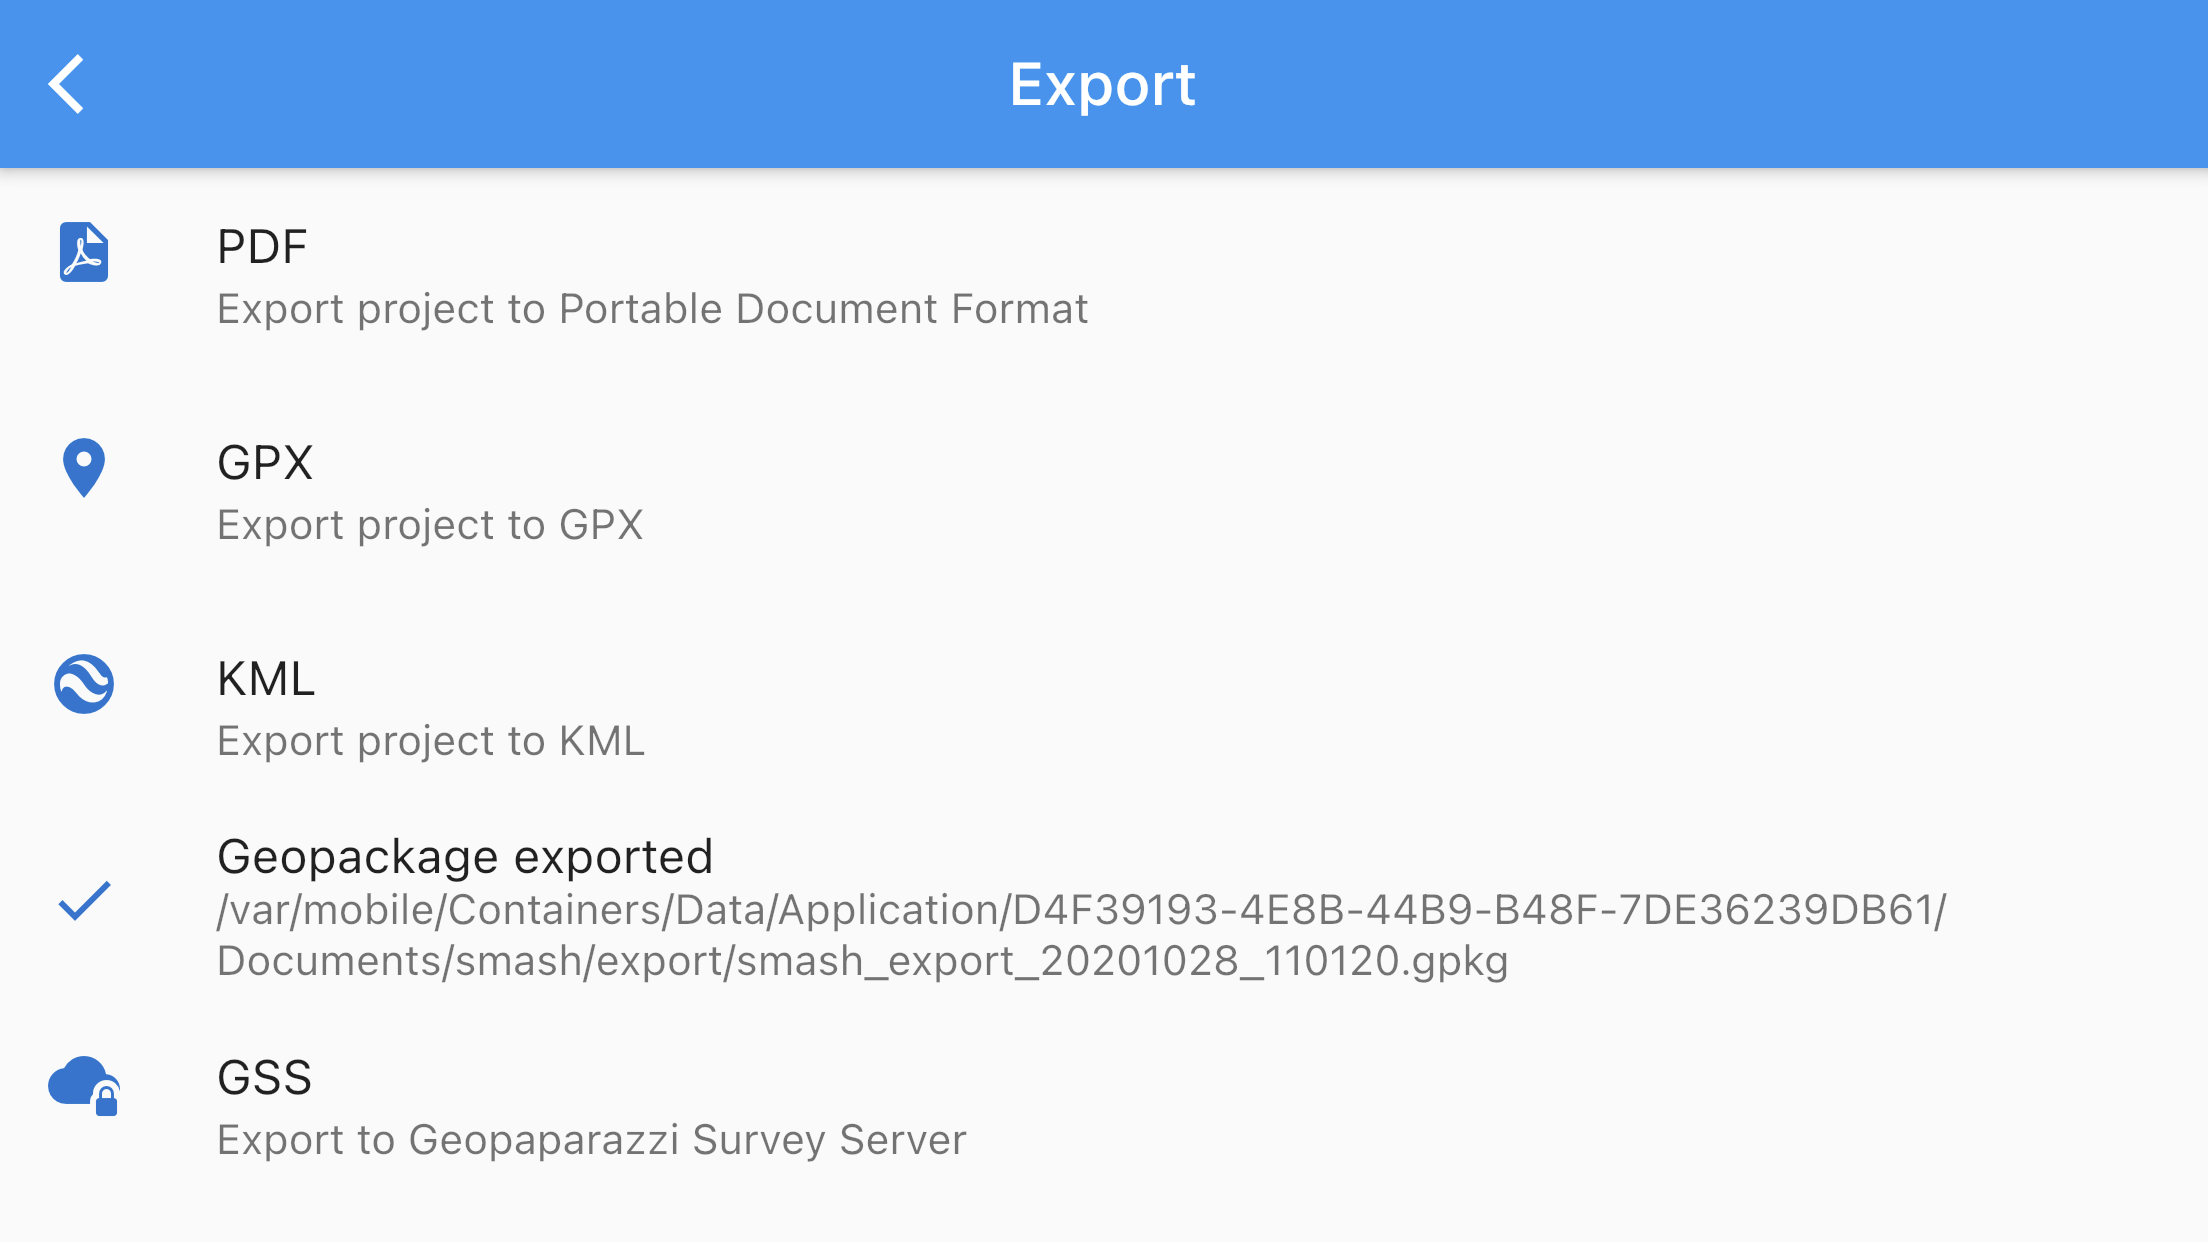
The export view.
7.3.5. GSS
When pushing the GSS export button, the stats page is presented. It shows what will be uploaded to the server if pushing the upload button.
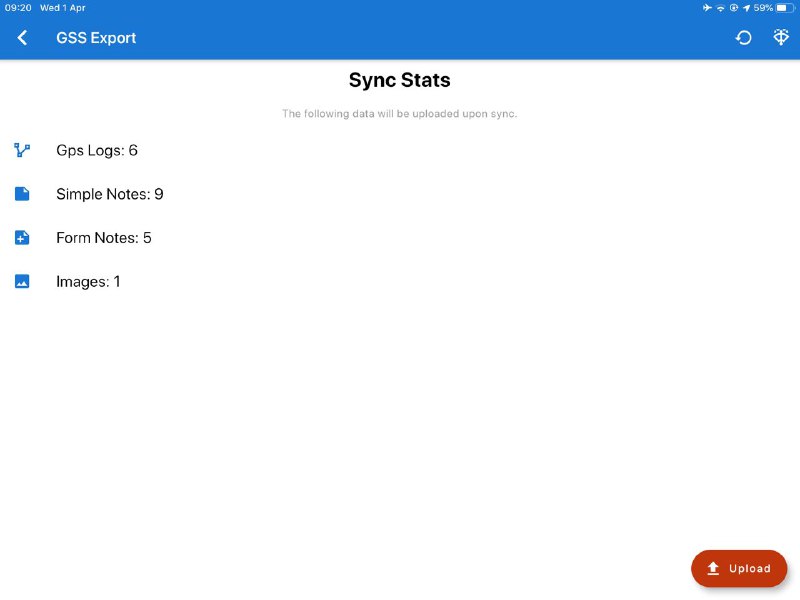
The GSS export stats view.
Once the upload button is tapped, the upload begins. A list with the progress for each resource is presented:
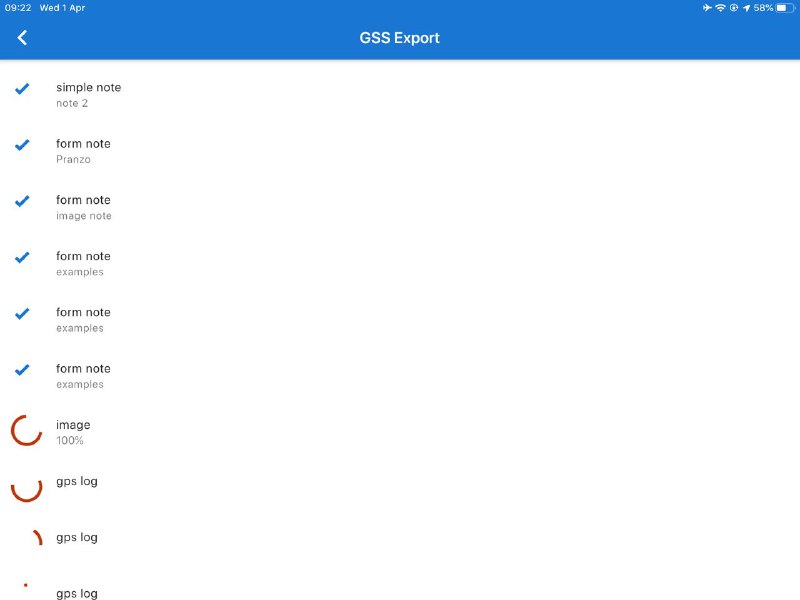
The upload progress list.
If the device is not registered with the server, the following message will appear, stopping the upload:
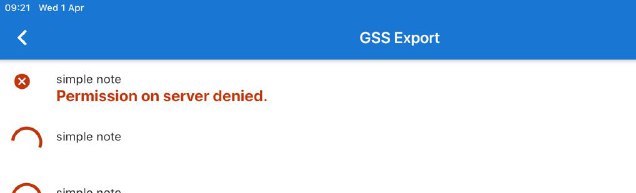
The upload error in case of no permission to upload.
7.4. Settings

The settings view.
7.4.1. GPS Settings
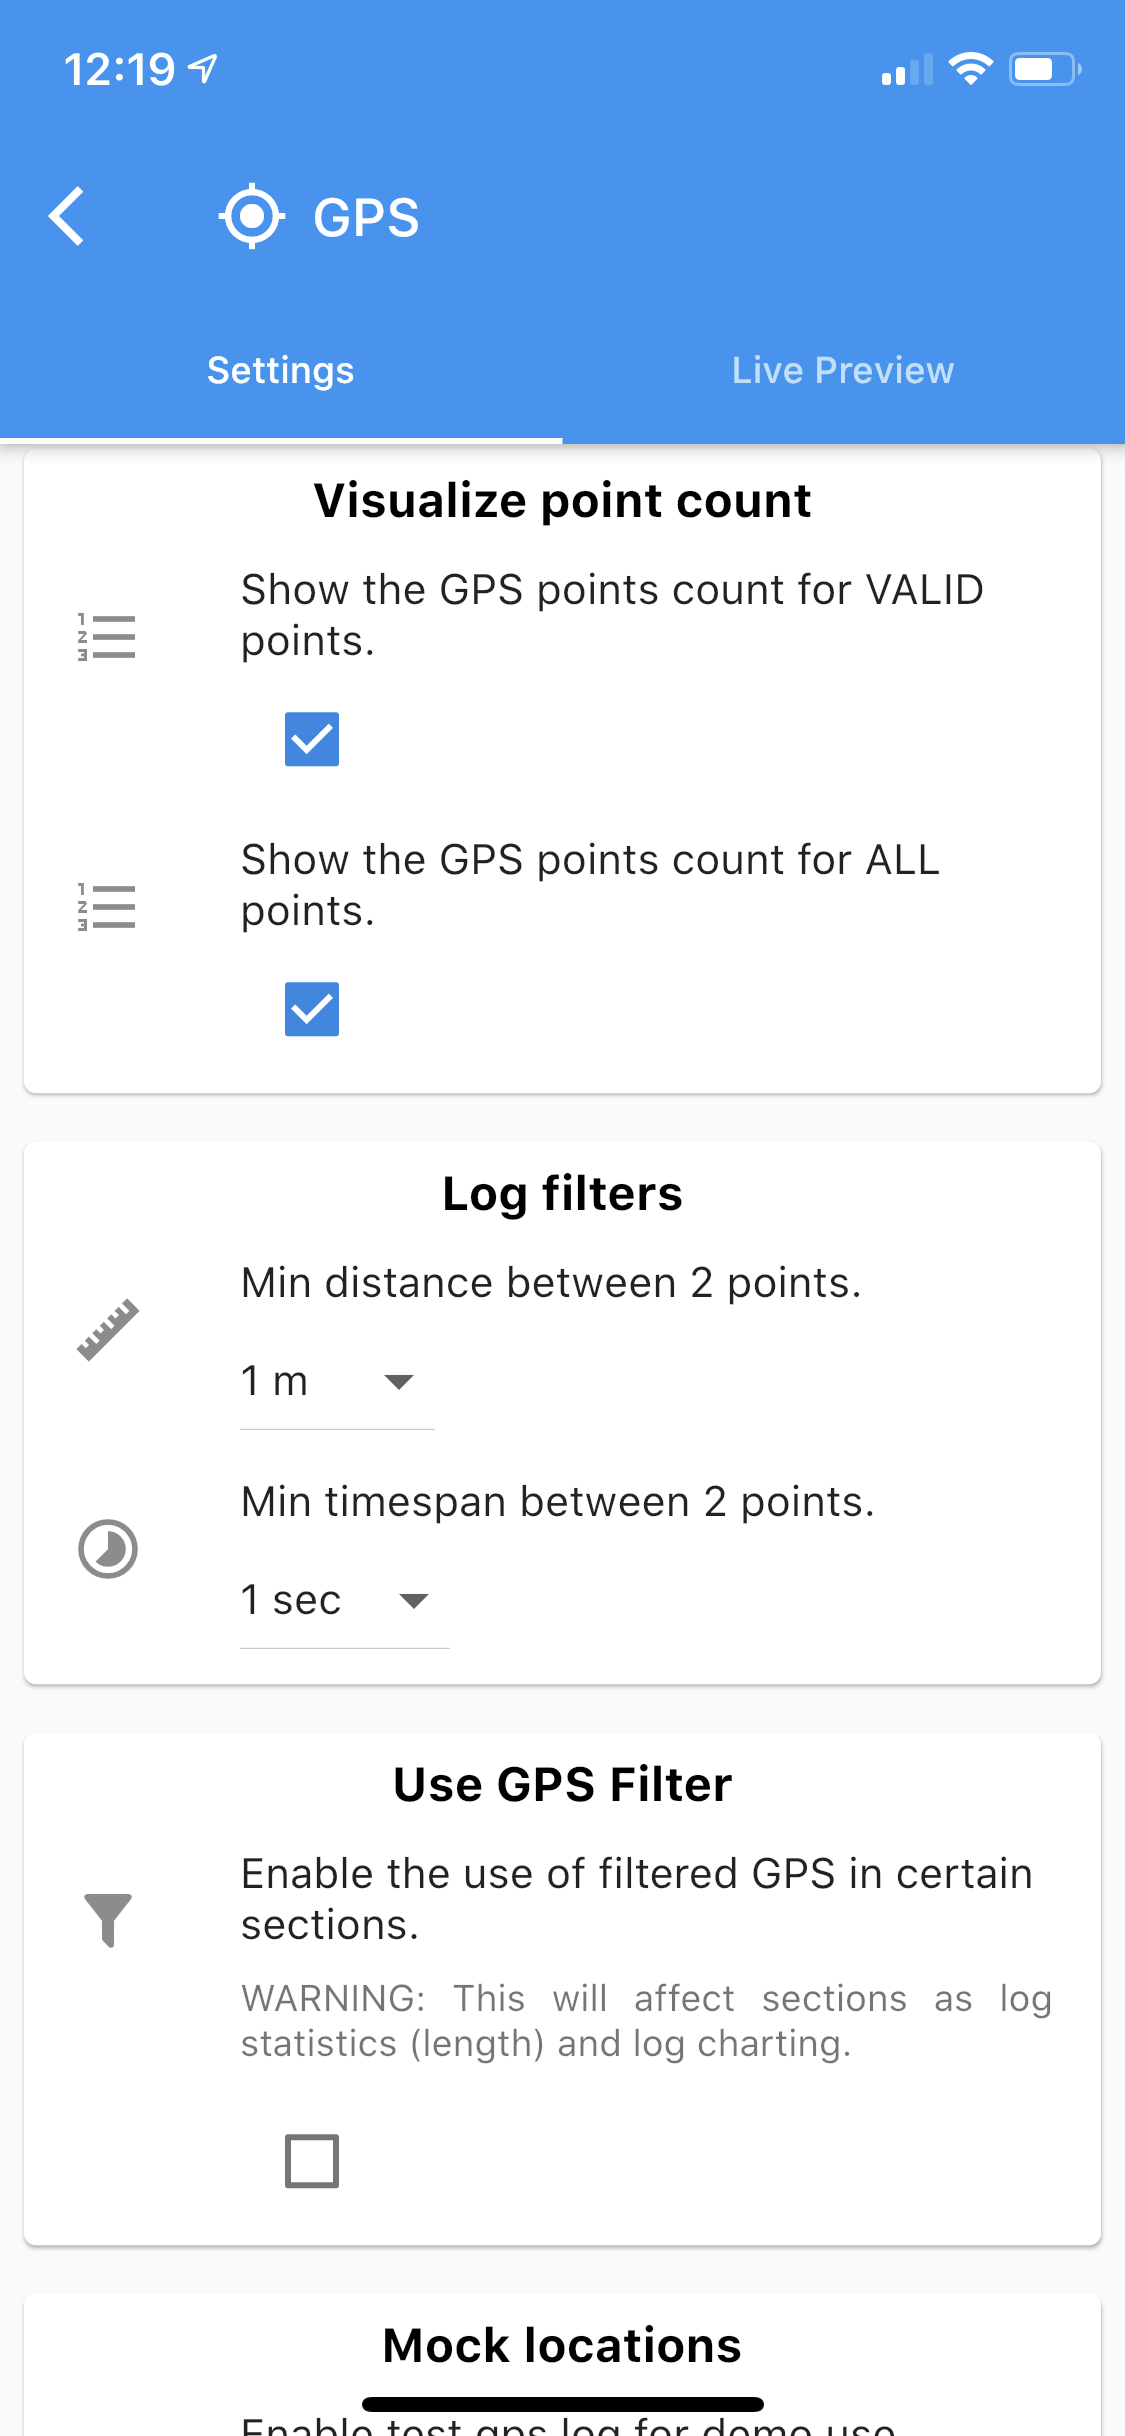
The gps settings view.
In the GPS settings the user can define filters based on distance and time interval for the logging activity.
There is also the possibility to visualize the GPS point count separated for the valid and for all points. And to decide to use the GPS filtered points (currently calculated applying the Kalman filter) to all GPS dependent features of the application (instead of the original raw data).
| In case of GPS logs original and filtered GPS signal are BOTH always saved into the database and the user can choose to look at the original and/or filtered log in the GPS Logging visualization. |
Last but not least it is possible to simulate a gps log. The device needs to have a gps fix for this to work. This can be handy when in need to demo the application’s logging functionality when sitting indoor, but still having a fix.
The second tab of the GPS setting view is dedicated to the Live Preview of the GPS. It shows in details the different points fixed by the GPS with their main attributes and the influence of the different filters applied.
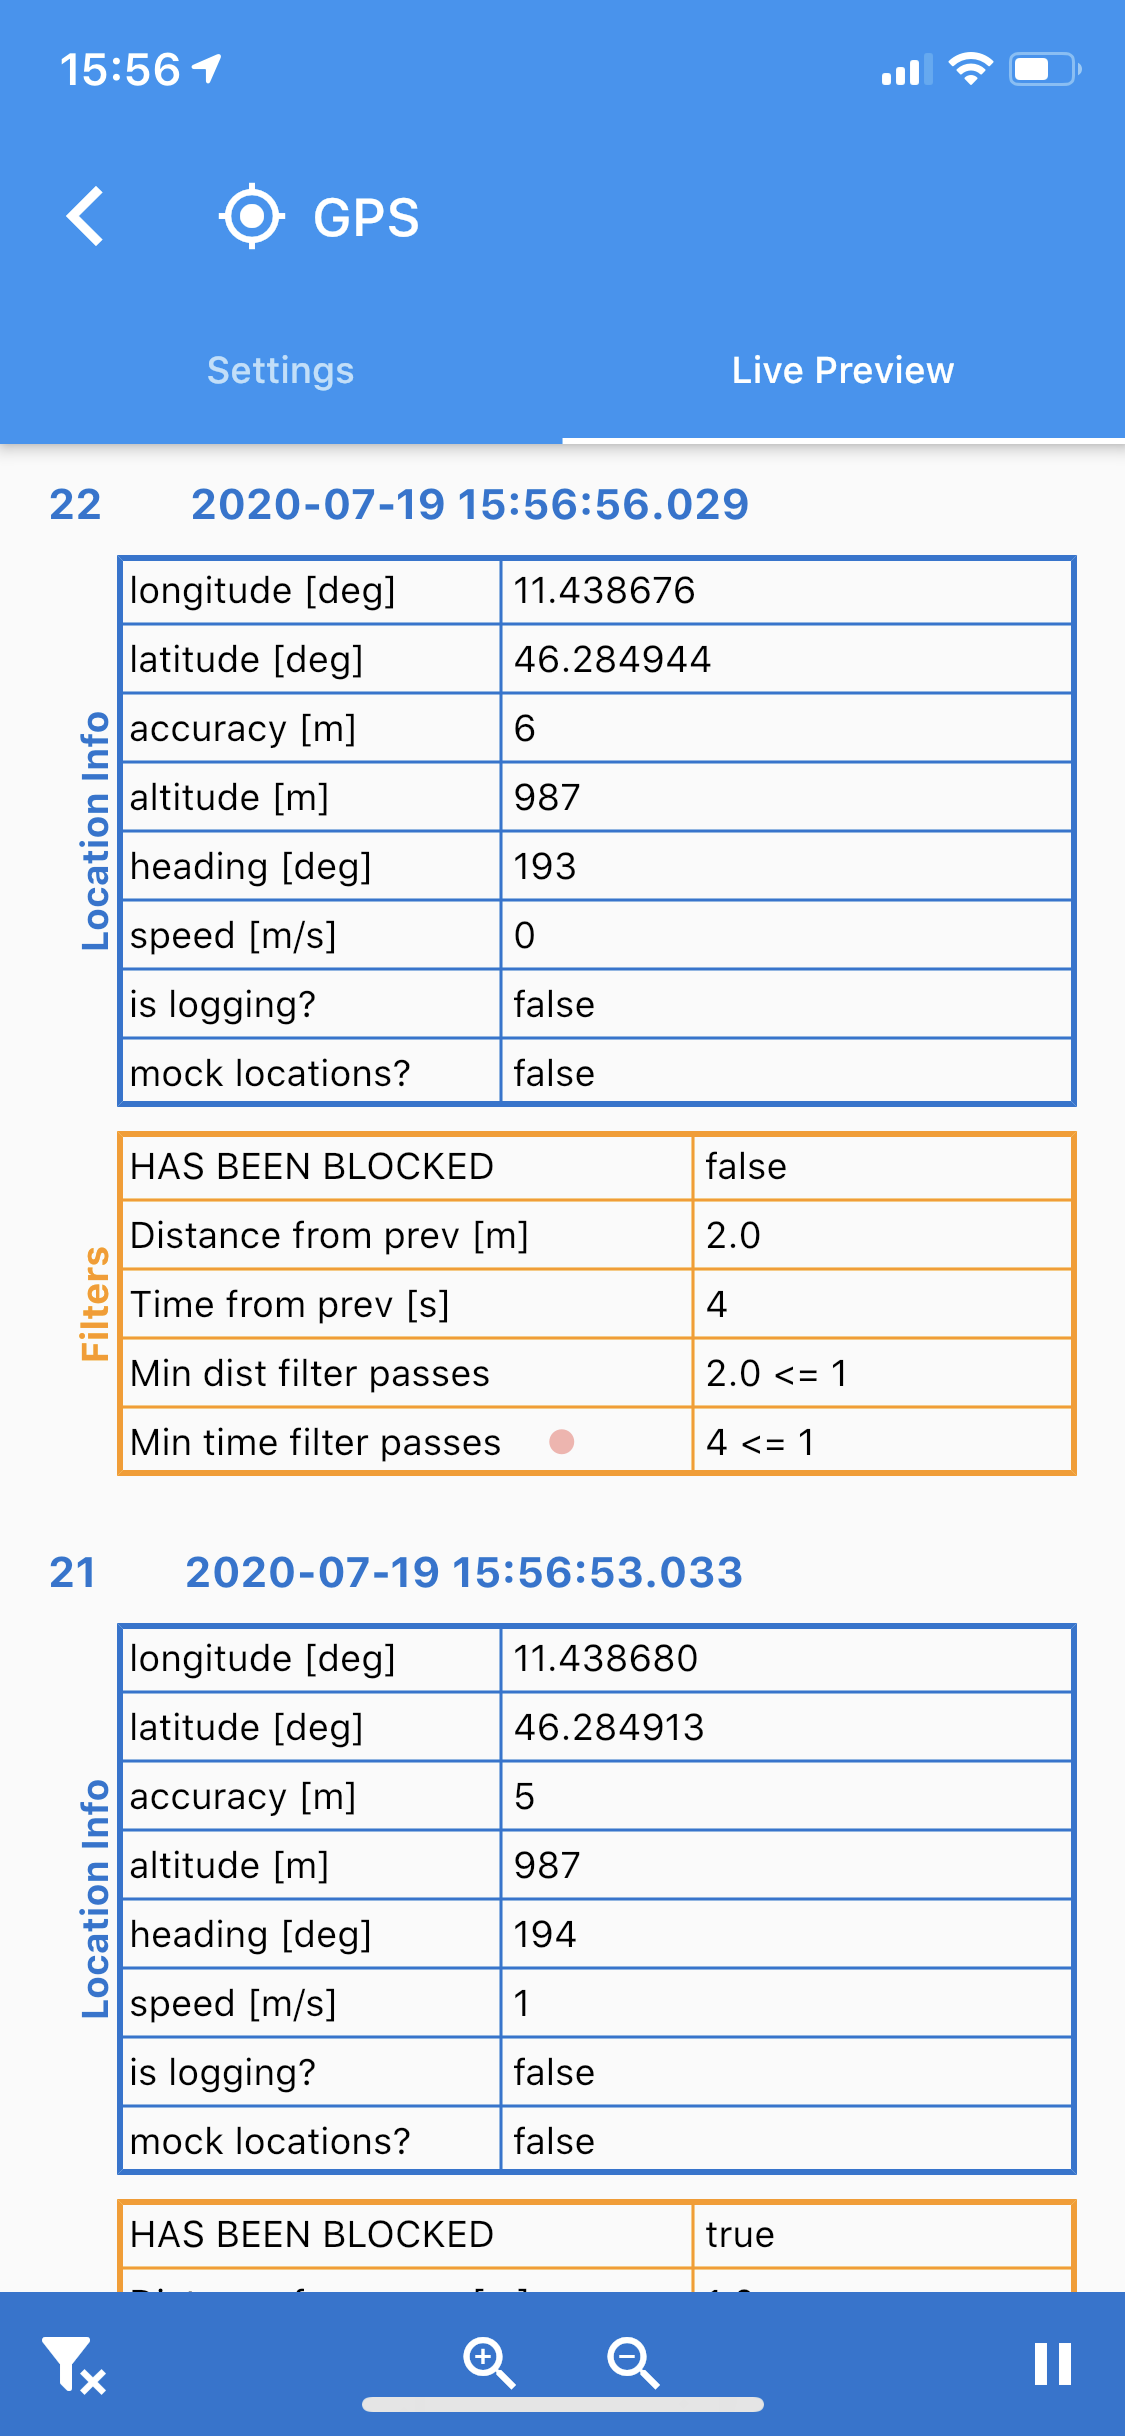
The gps settings view.
7.4.2. Screen Settings
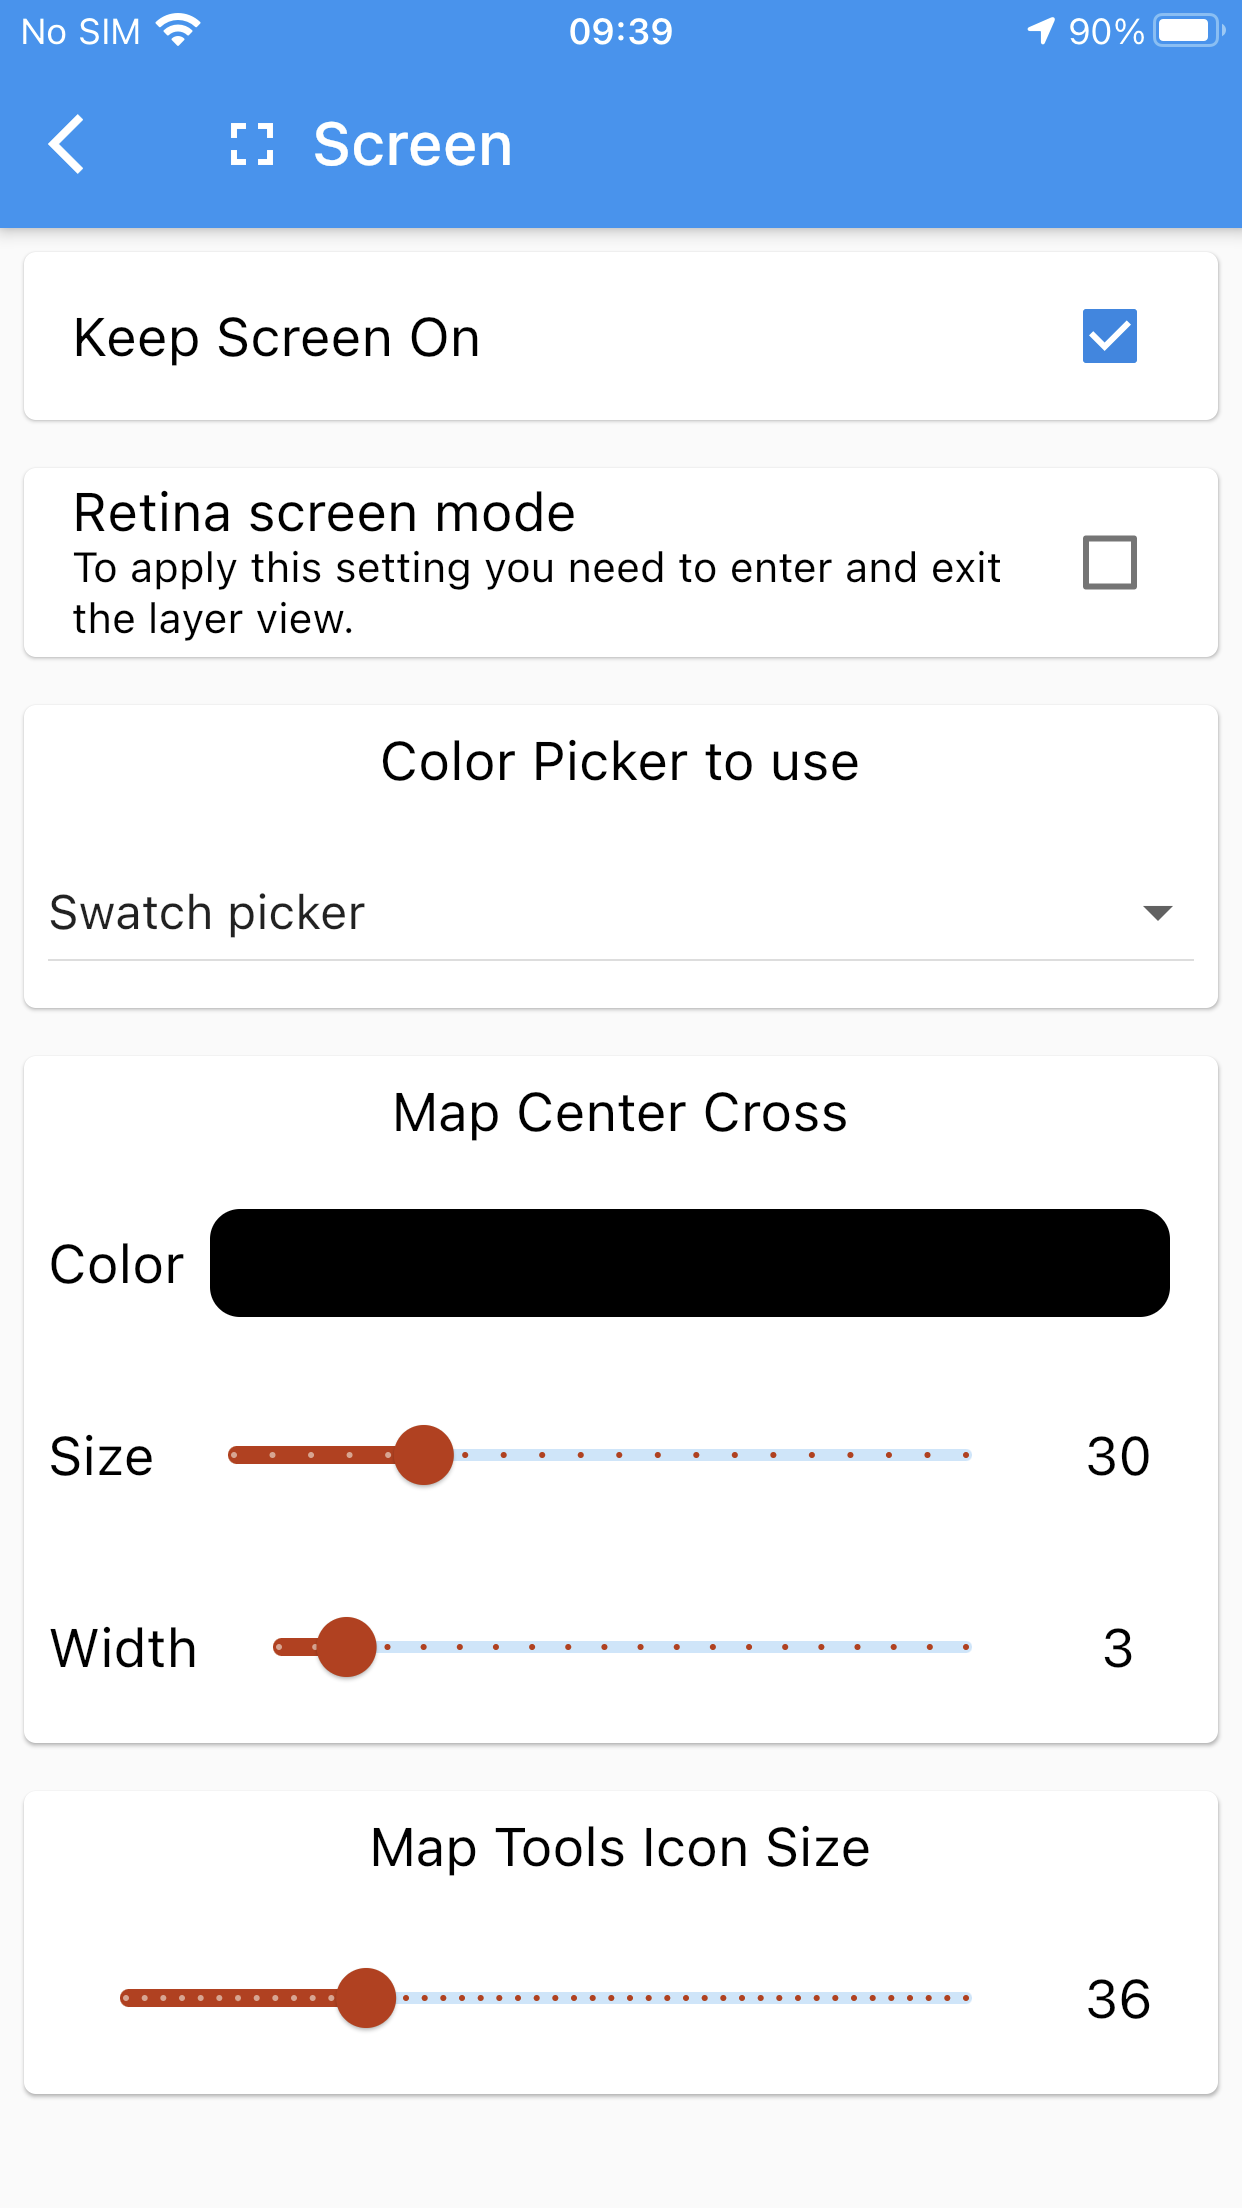
The screen settings view.
In the screen settings view it is possible to:
-
toggle the screen-always-on functionality
-
use the Retina screen mode
-
define the color picker to use in the application when setting a color
-
style the map center cross
-
change the size of the icons of the toolbar in the main view
7.4.3. Camera Settings
The camera settings allow to choose the pictures resolution between high, medium and low.
7.4.4. Vector Layers
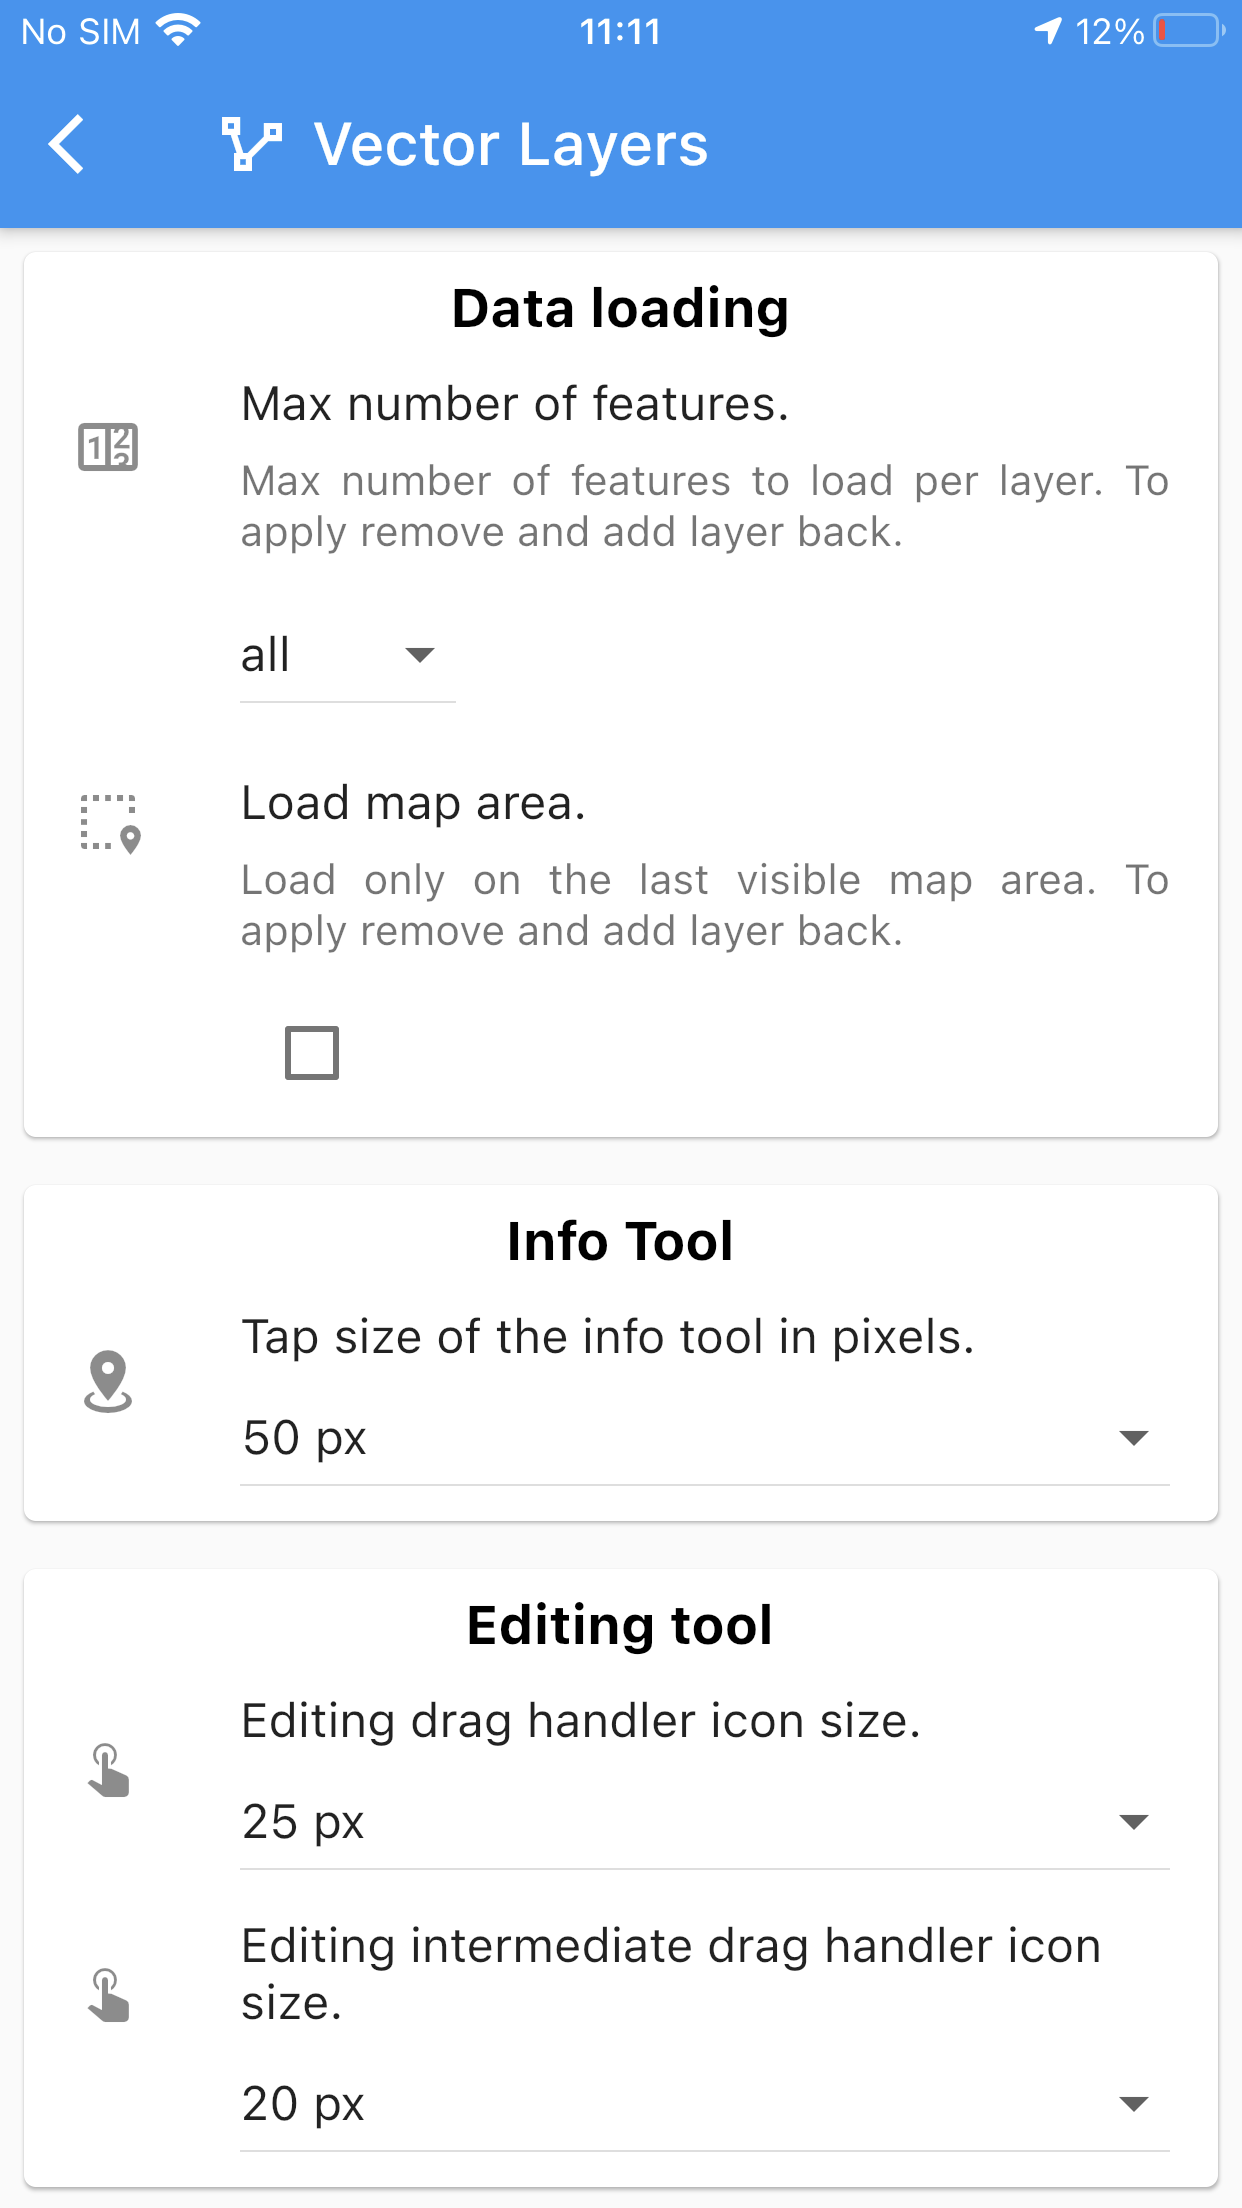
The vector layers settings view.
This settings part allows the user to:
-
define the amount of data to be loaded. This can be important for large vector datasets that would make the map navigation less smooth; options are all or a defined number of features from 50 to 10000
-
select if to load the data only on the last visible map area
-
define the radius of the tap of the info feature and editing tool
-
set the dimension of the editing drag handler size
-
set the dimension of the editing intermediate drag handler size.
7.4.5. CRS
The CRS view contains the list of supported CRS for the application with the possibility to add new projections by epsg code. Available projections are used to reproject vector datasets (geopackage layers and shapefiles) onto the map.
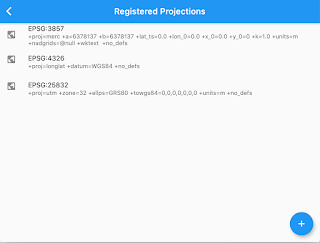
The CRS view.
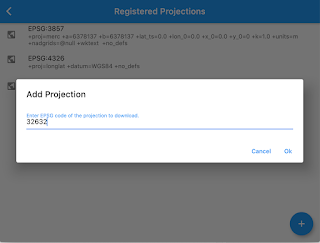
The add CRS panel.
7.4.6. Device Settings
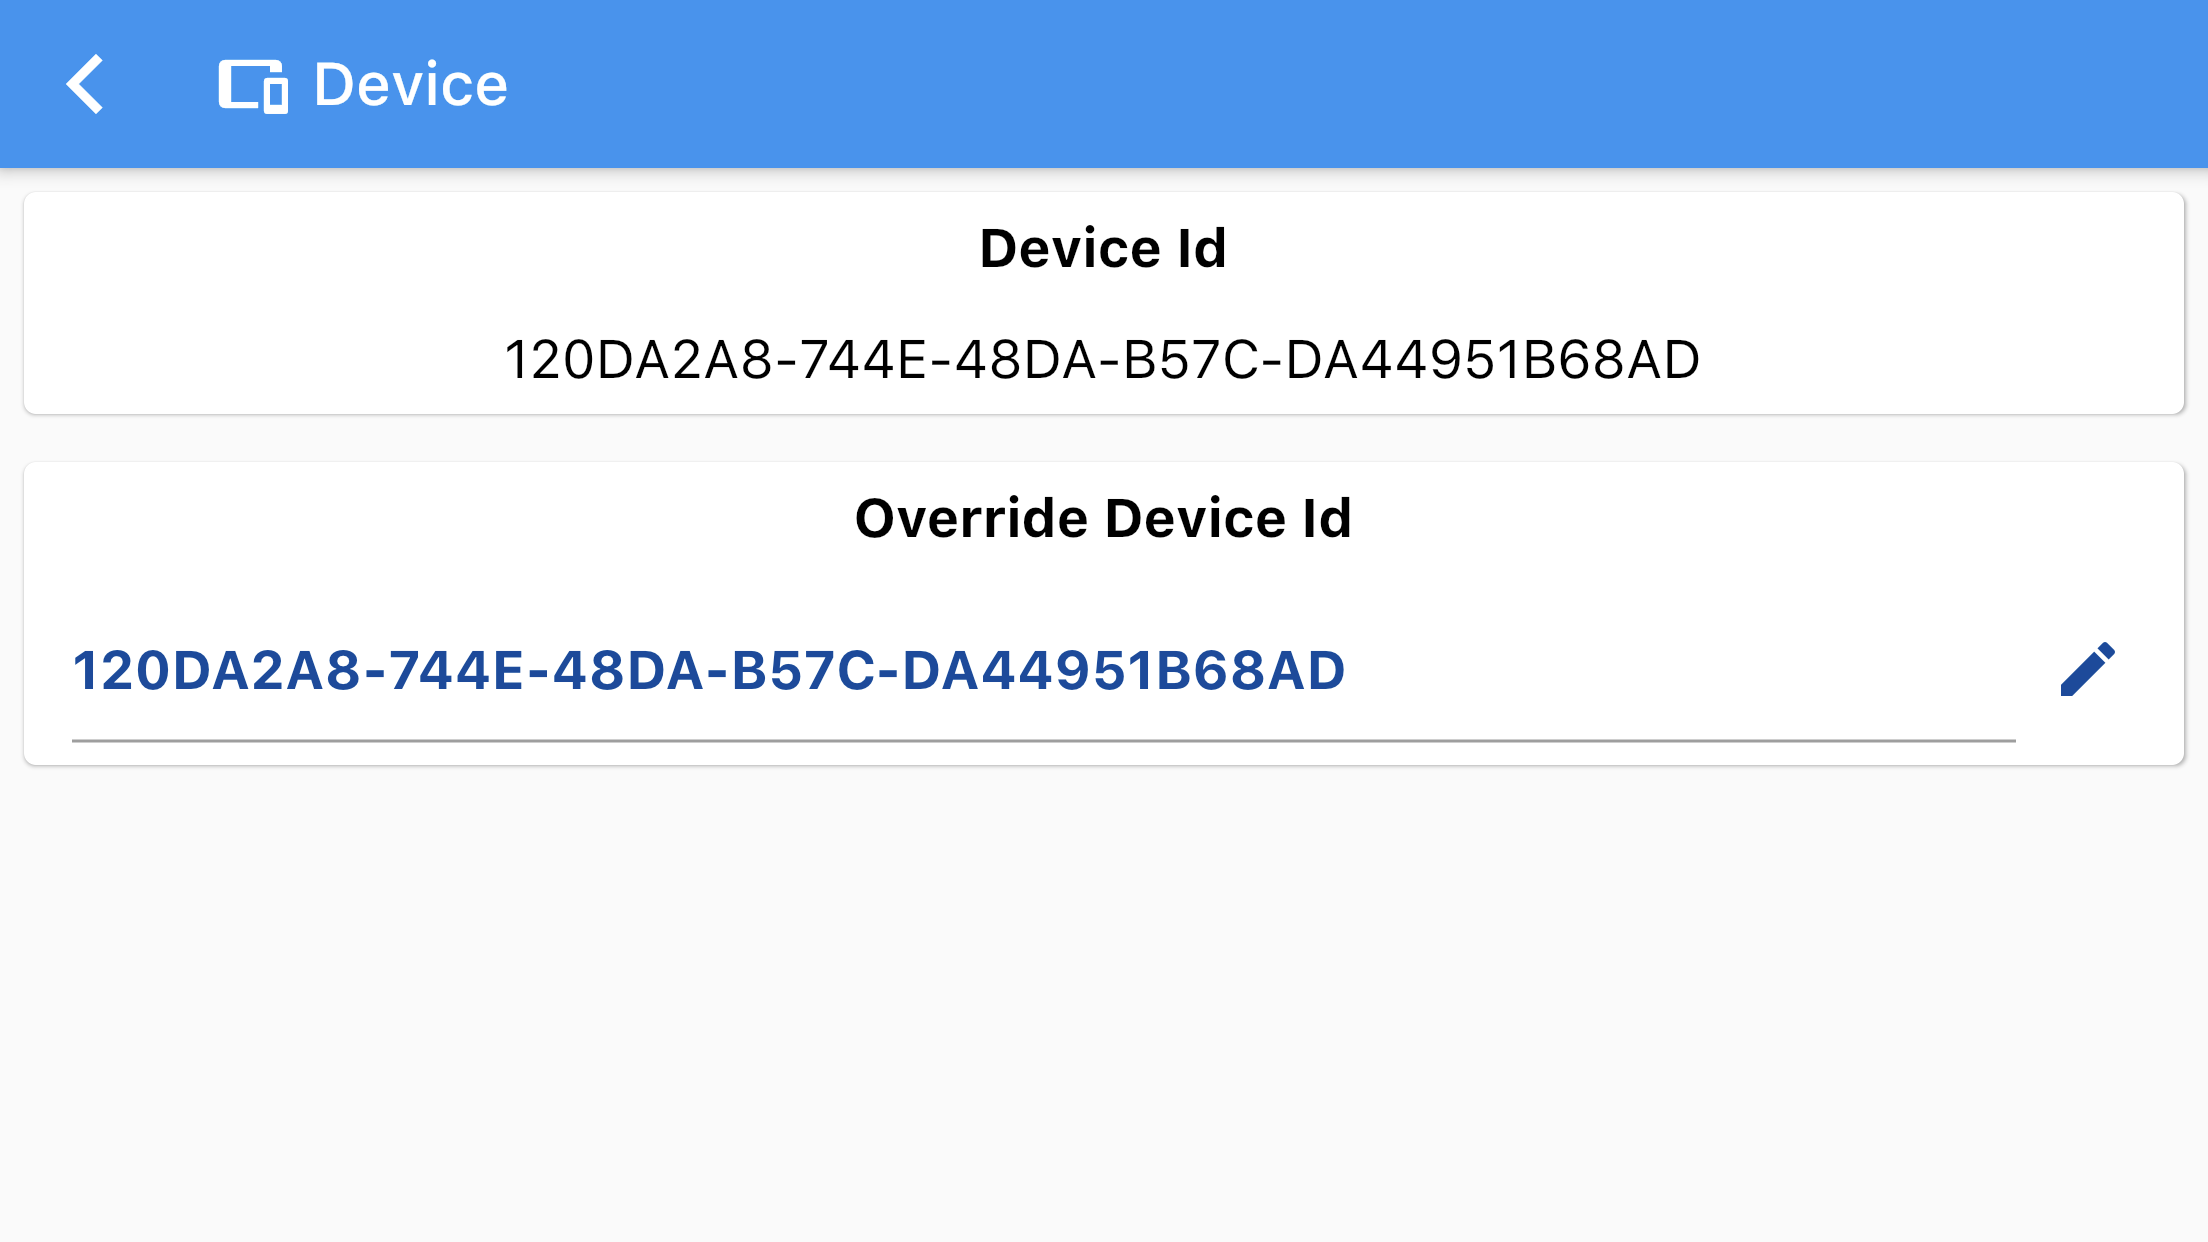
The device id view.
The device id can be necessary in various situations. This is the case of the synchronization with the Geopaparazzi Survey Server. In that case the device id is the unique identifier of a surveyor.
It is possible to override that device id for those cases in which a standardized id generation is used inside and organisation.
7.4.7. GSS Settings
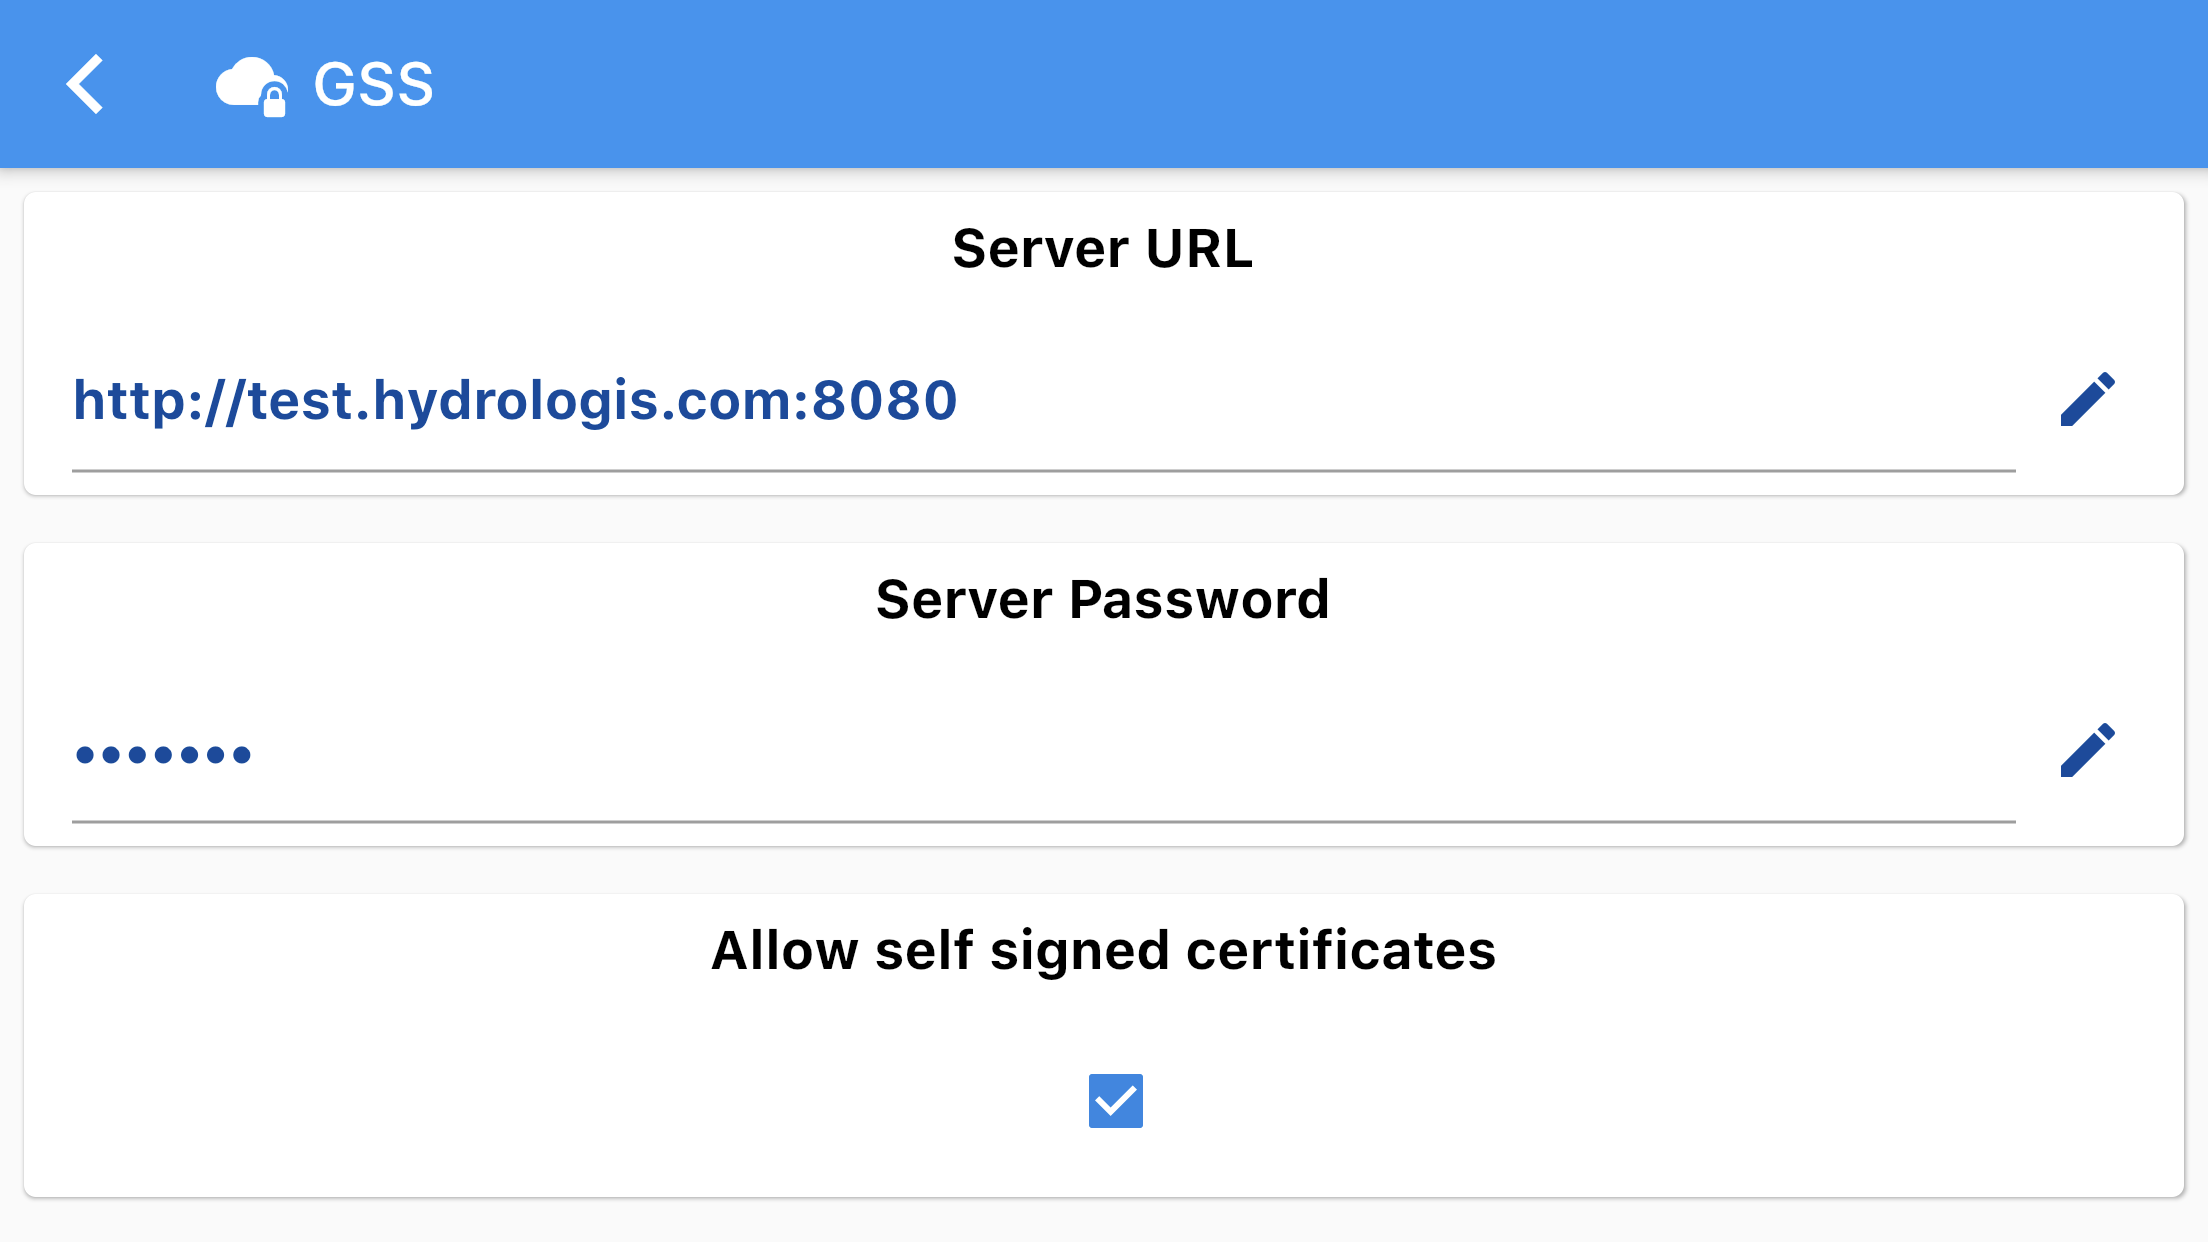
The gss setting view.
In this setting view the user can set the server url and the password on which there is an istance of the Geopaparazzi Survey Server to synchronize with.
7.4.8. Diagnostics Settings
In the diagnostics settings view it is possible to show the full debug information and filter on the main errors.
7.4.9. Turn GPS off/on or Exit
Since the behaviour of the background applications is different between Android and iOS devices, this option covers the possibility to definitely disable the application to collect data:
-
iOS: Turn GPS off (the app in background will in that case use no resources)
-
Android: use the Exit button to quit the application instead of the standard return mode.
8. Supported map types
8.1. Geopackage
SMASH supports the Geopackage format based on sqlite database both raster tiles and vector formats.
Geopackage vector layers are supported also for the editing of the attribute table.
The vector layers can be in different projections, they will be reprojected on the fly.
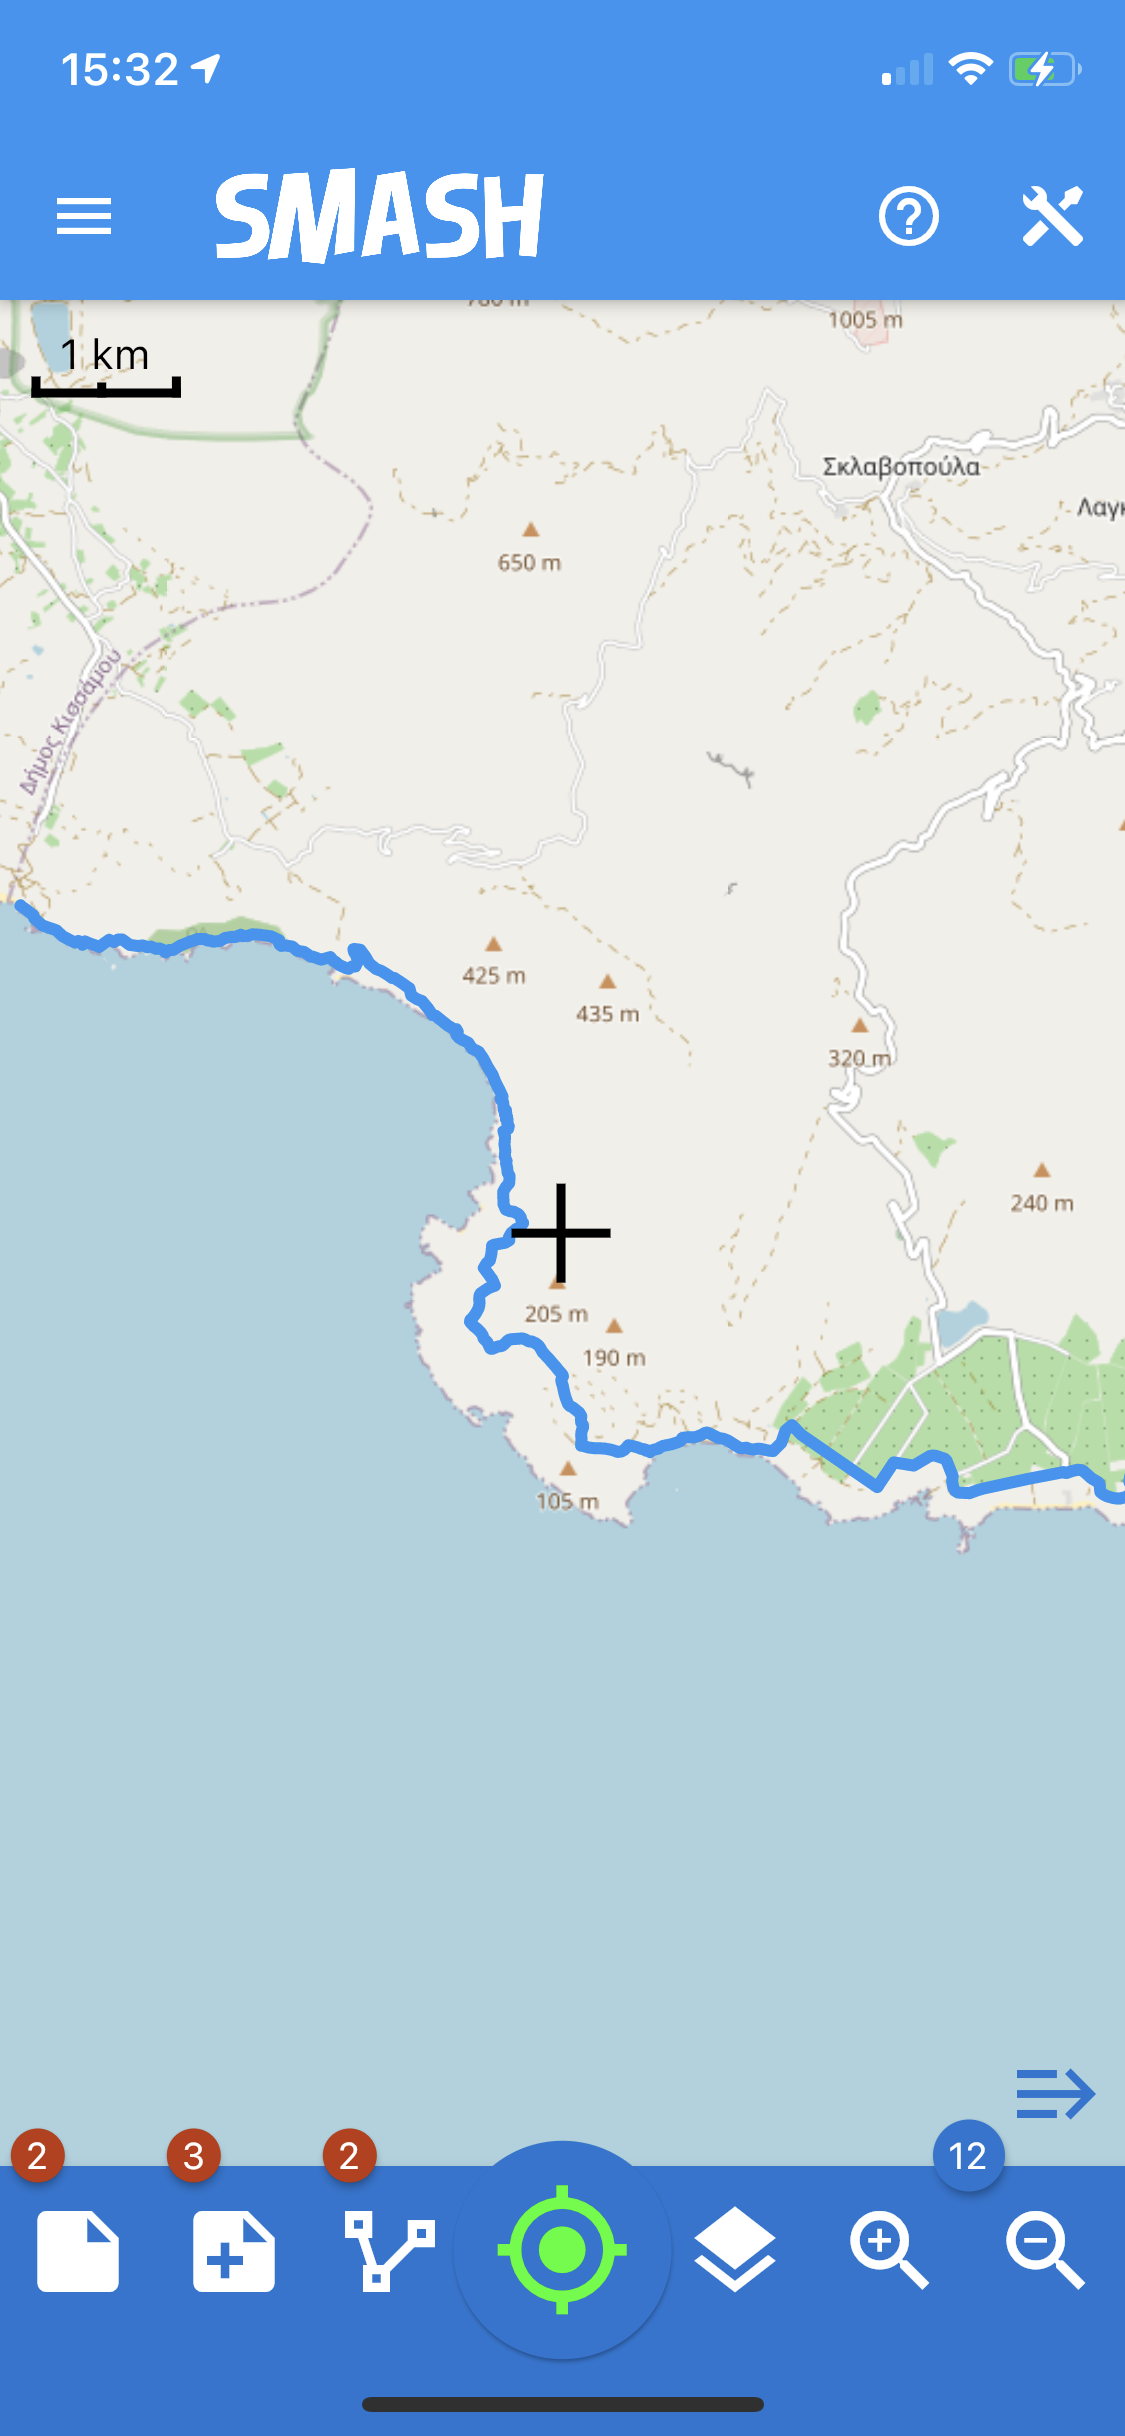
8.2. GPX
GPX files can be loaded as layers. SMASH will create different layers for the waypoint and track information contained.
It is also possible to style the gpx layers. But since the styling information is not saved anywhere (the file format doesn’t support style), it will persist only for the current session.
8.3. MBTiles
MBTiles is a file format for storing map tiles in a single file. It is, technically, a SQLite database. See the openstreetmap wiki for more information.
8.4. Mapsforge Format Data
The mapsforge project provides free and open software for the rendering of vector data based on OpenStreetMap. It developed an efficient binary format for storage of OSM map data (usually with file extension .map), and is offering country specific .map files for download. Geopaparazzi is able to render map tiles locally from .map files and will cache rendered tiles in a local MBTiles store.
Maps are maintained and distributed by the mapsforge team and can be downloaded from their download server.
In their default style they kind of look like:
The standard mapsforge map.
8.5. Mapurls: Map tiles
By default, SMASH is configured to load map Mapnik rendered tiles from OpenStreetMap’s tile server on the Internet.
It is possible to load other online tile source if they are served in the TMS format using mapurl files. A mapurl file looks like the following:
url=http://tile.openstreetmap.org/ZZZ/XXX/YYY.png
minzoom=0
maxzoom=19
center=11.42 46.8
type=google
format=png
defaultzoom=13
description=Mapnik - OpenStreetMap and contributors, ODbL.
The mandatory information is:
-
the url of the tile server, having:
-
ZZZ instead of the zoom level
-
XXX instead of the tile column number
-
YYY instead of the tile row number
-
| This information can be tested also in a browser http://tile.openstreetmap.org/9/271/182.png has ZZZ=9, XXX=271 and YYY=182 |
-
the minimum zoom level that is supported (typically 0)
-
the maximum zoom level that is supported (likely not more than 19 or 21 depending on the server)
-
the center of the tile source
-
the type of tile server. Currently both standard TMS and Google Maps based numbering of the tiles is supported by the line:
-
type=tms
-
type=google
-
9. Layers style
SMASH supports layers styling through the OGC standard SLD. There are also several editors and GIS that support SLD, so it is possible to create the styles for the survey on a GIS and transfer it together with the data on the device. SMASH supports the visualization of the the vectors in Geopackage and GPX format using the style defined as SLD. For Geopackage and GPX layers only it is also possible to create a simple personal style inside the application.
SMASH automatically visualizes vector layers as defined in theyr own SLD file (previously created in a GIS). It is also possible to create a new style for the Geopackage and GPX layers by accessing the Layer List and sliding the layer to style to the right to enter the style properties.
9.1. Style a Geopackage layer
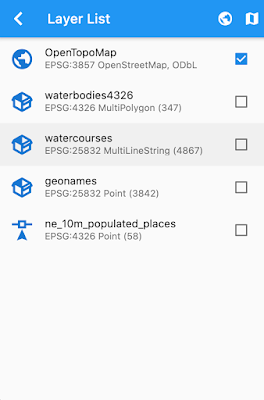
A visualization of the Layer List containing some Geopackage layers.
For a polygon layer for example it is possible to edit fill and stroke properties.
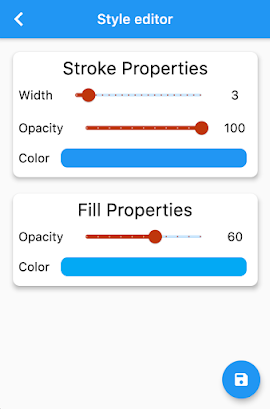
The possibilities for styling a polygon layer in SMASH.
For a line layer it is possible to edit only the stroke.
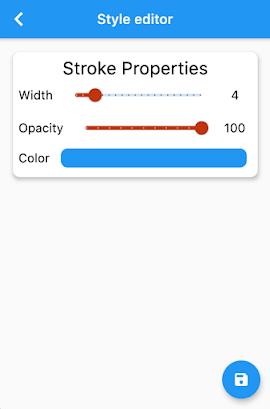
The possibilities for styling a line layer in SMASH.
And for a point layer it is possible to edit the shape, fill and to label the features.
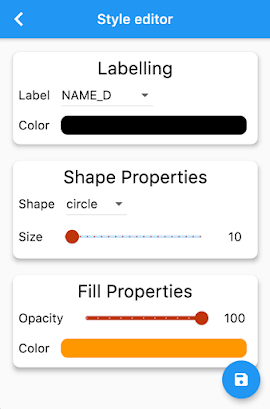
The possibilities for styling a point layer in SMASH.
| Please remember to save using the floating action bottom at the bottom. This will write the style to the database table. |
An example of styling a point layer in SMASH.
SMASH also supports the visualization and editing of one type of theming: by unique values. In this case a FeatureTypeStyle is populated with several rules that obey to a filter that supports matching of unique values from the attributes table.
If a thematic style is already defined for a layer, the properties page has buttons to change rules and modify them.
The following is an example that features 2 FeatureTypeStyles, one with just a Rule containing a textsymbolizer:
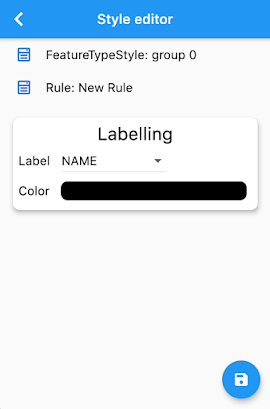
An example of theming style with one rule containing a label.
and a second one with all the Rules with filter:
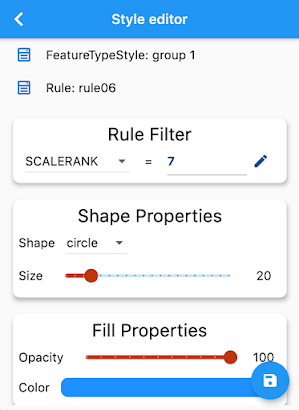
An example of theming style with all rules.
If only one FeatureTypeStyle or Rule are present, the header titles can vary:
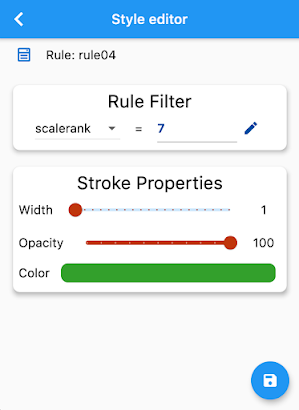
An example of theming style if only one FeatureTypeStyle or Rule are present.
The result of the previous styling settings is the following:
An example of a simple thematic style created in SMASH.
9.2. Style a GPX layer
The style properties of a GPX layer will be also saved to an SLD sidecar file to ensure style persistence.
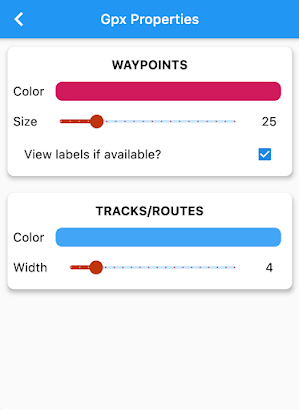
An example of the styling options of a GPX layer in SMASH.
In particular style can be defined for lines and points. If waypoints have the name tag, they can be used for labeling.
An example of the styling options of a GPX layer in SMASH.
10. Application folder structure
By default SMASH interacts with the filesystem using a folder named smash that resides in the main storage. On IOS devices that would be the Documents area of my application, while on android that usually is the internal sdcard.
Inside the smash folder, the following subfolders hold the information by category:
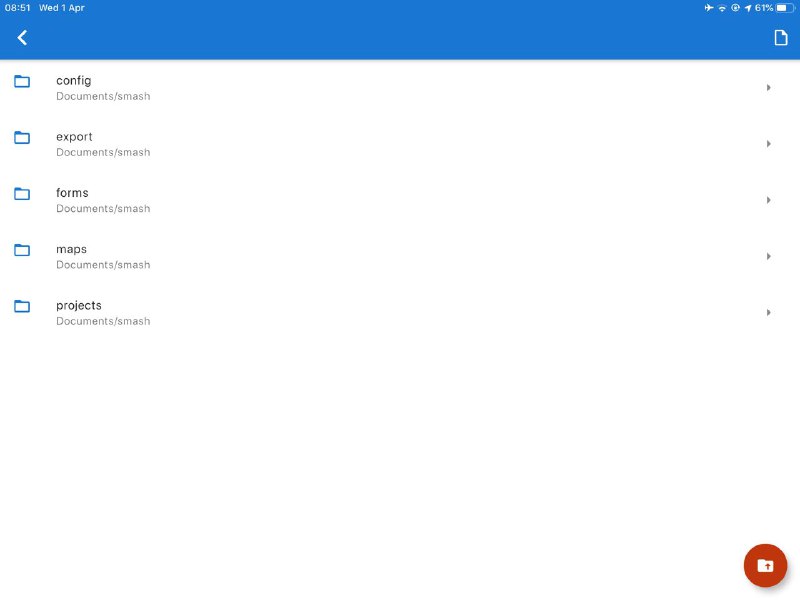
The folder structure of the application.
-
config: the folder that contains internal app configurations. For example the debug database is kept here. This can be sent to the developers in case of bugs to help solving them.
-
export: folder into which documents produced from exports are saved.
-
forms: folder for forms. Any form file in there is loaded as form note in SMASH.
-
maps: the folders in which to keep maps. Downloaded and synchronized maps are saved into this folder.
-
projects: folder inside which new projects are created.
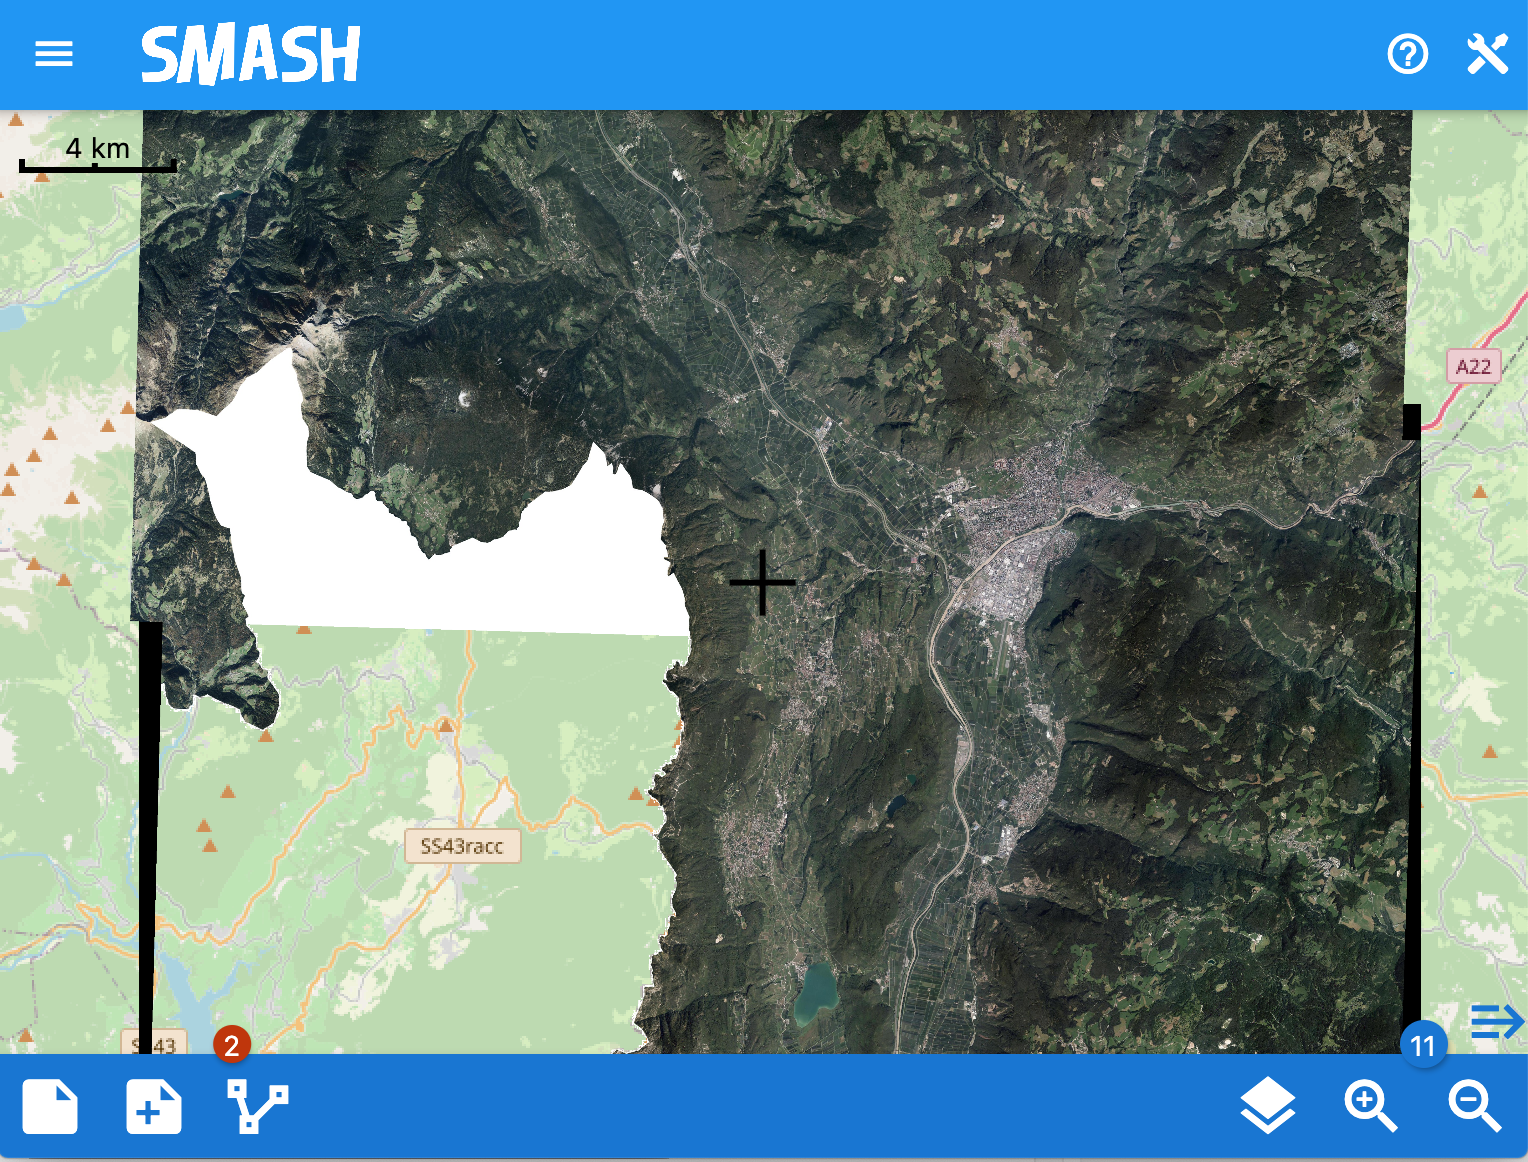
11. Appendix 1: Raster reprojection
The support for the visualization of the Geopackage raster layers allows to set different parameters like the tiling system and the projection. As for the tiling system we reccommand to use Gdal to create Geopackage rasters. In fact, Gdal by default generates only one zoomlevel at the optimal image resolution and using the best tile schema. This allows to create geopackages of big imagery maintaining more or less the same size o the original data.
Smash supports different projections and does the reprojection on the flight if it is different from the usual EPSG 3857 used as base for the application.
Geopackage tile datasets can be loaded in two different ways. The settings are available in the properties view of geopackage layers.
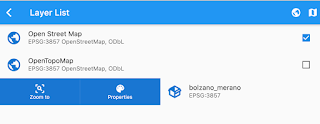
The Layers view: a detail of possibilities for a Geopackage layer.
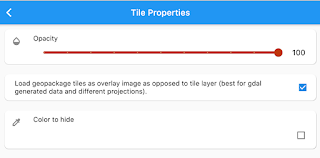
The properties view of a geopackage layer.
The available options are:
-
the opacity value of the entire map
-
the possibility to load a wider range of tiles schemas: to use for an ortophoto reprojected with gdal and packaged as geopackage
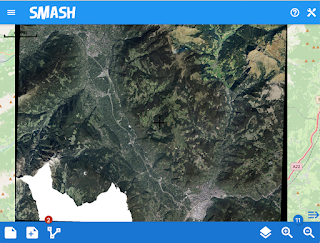
The visualization of a geopackage layer with an ortophoto reprojected with gdal.
| This feature has a larger memory footprint as it loads the tiles in memory as an image. So if the dataset is too large for your device it will not work and it has to be disabled. |
-
the color to make transparent: this is useful when there is the need to overlay technical maps over an elevation model or ortophoto. But it also solves a situation like this:
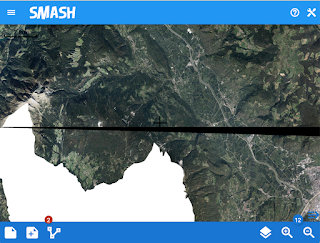
The visualization of two geopackage layers with an ortophoto reprojected with gdal, note the black collar.
where there are two geopackage layers of a reprojected ortophoto. When both loaded the black collar of one covers the other. It is possible to set the black collar to transparent by selecting the black color in the picker.

The visualization of two geopackage layers with an ortophoto reprojected with gdal, with the black color set to transparent.
| when the jpeg geopackage tiles are generated, there is some interpolation and antialiasing going on, which makes part of the color not completely black, hence some pixel will remaining. |