1. The Geopaparazzi Survey Server
The Geopaparazzi Survey Server (GSS) is a web application that allows SMASH users to synchronize their survey data with a central server.
Also geopaparazzi users can make use of the GSS, since the project databases for geopaparazzi and SMASH are completely compatible. The additional step for geopaparazzi users is that they have to use SMASH to upload their data, even if surveyed with geopaparazzi.
Please refer to the SMASH manual to see how data are uploaded from SMASH to GSS. This manual only describes the GSS application side.
It is important to have clear in mind that:
-
SMASH can synchronize SMASH / geopaparazzi databasese using its unique device ID to upload the data to the server.
-
any device, to be able to connect to the server, needs to be registered in the surveyor settings section of the server by an administrator user. If you try to uplopad without being registered, you will get a permission denied error.
The applications are available as Free and Open Source software. The server is available under GPL 3.0 license. The source code of the server, which is written part in java and part in flutter, is available at this repository.
2. Installation and run
2.1. Preparing the data folder
To run GSS you can prepare the data folder for the server, which will contain the database (if it doesn’t exist, it is created from scratch) and optional mapsforge *.map files for local tiles generation.
| You can just start with an empty folder, which will be filled with the bare minimum necessary to run GSS. |
Let’s assume you are a heavy lifter and want to do things on your own, and that the data folder is named TESTGSS, then the folder structure needs contain at least the following:
TESTGSS/
|-- DATA
|   |-- database.mv.db --> if you are using H2GIS
|   `-- italy.map --> local mapsforge tiles datasource
`-- WORKSPACE
2.2. Installation and run through docker
Since version 3.0 the default installation supplied is based on docker and uses PostGIS as its default database, also bundled in the docker image.
The installation is a two step process:
-
run postgis
-
run the GSS application
First you need to define the variable for the local workspace you want to use:
WORKSPACE=/path/to/GSSSERVERthen run the db through docker:
docker run  --rm --name=gss-postgis \
  -d -v $WORKSPACE:/home/gssworkspace \
  -e POSTGRES_USER=test -e POSTGRES_PASS=test -e POSTGRES_DBNAME=test \
  -e ALLOW_IP_RANGE=0.0.0.0/0 \
  -p 8080:8080 -p 5432:5432 \
  -v $WORKSPACE:/var/lib/postgresql \
  moovida/gss:v3.0beta
Note that here you are defining some configuration parameters:
-
the postgis database name, user and password (yo need them later when you start the application)
-
the port mapping for db and application
-
the mapping of the local folder to use (the workspace set before)
-
note that in the above v3.0beta is the used GSS version, as seen on docker hub (discussed later).
Running the command returns the ID of the just launched docker container. Place that id in a new variable:
GSS_CONTAINER_ID=youridand then run the application:
docker exec -ti $GSS_CONTAINER_ID \
  java -Xmx1g -jar gss-backbone-0.1.0.jar /home/gssworkspace \
  testPwd \
  jdbc:postgresql://localhost:5432/test
where:
-
-Xmx1g is the memory that the webapplication can make use of.
-
testPwd is the password that the server expects from the connecting devices. You need to set it inside the GSS connection settings of SMASH.
-
jdbc:postgresql… is the parameter that tells the webapp which database to use. The user and password of the database are asked on execution of the command (if the database has a name different from test).
|
To check on the latest version of the GSS, just head to the GSS docker hub page, where all the versions are listed as tags: 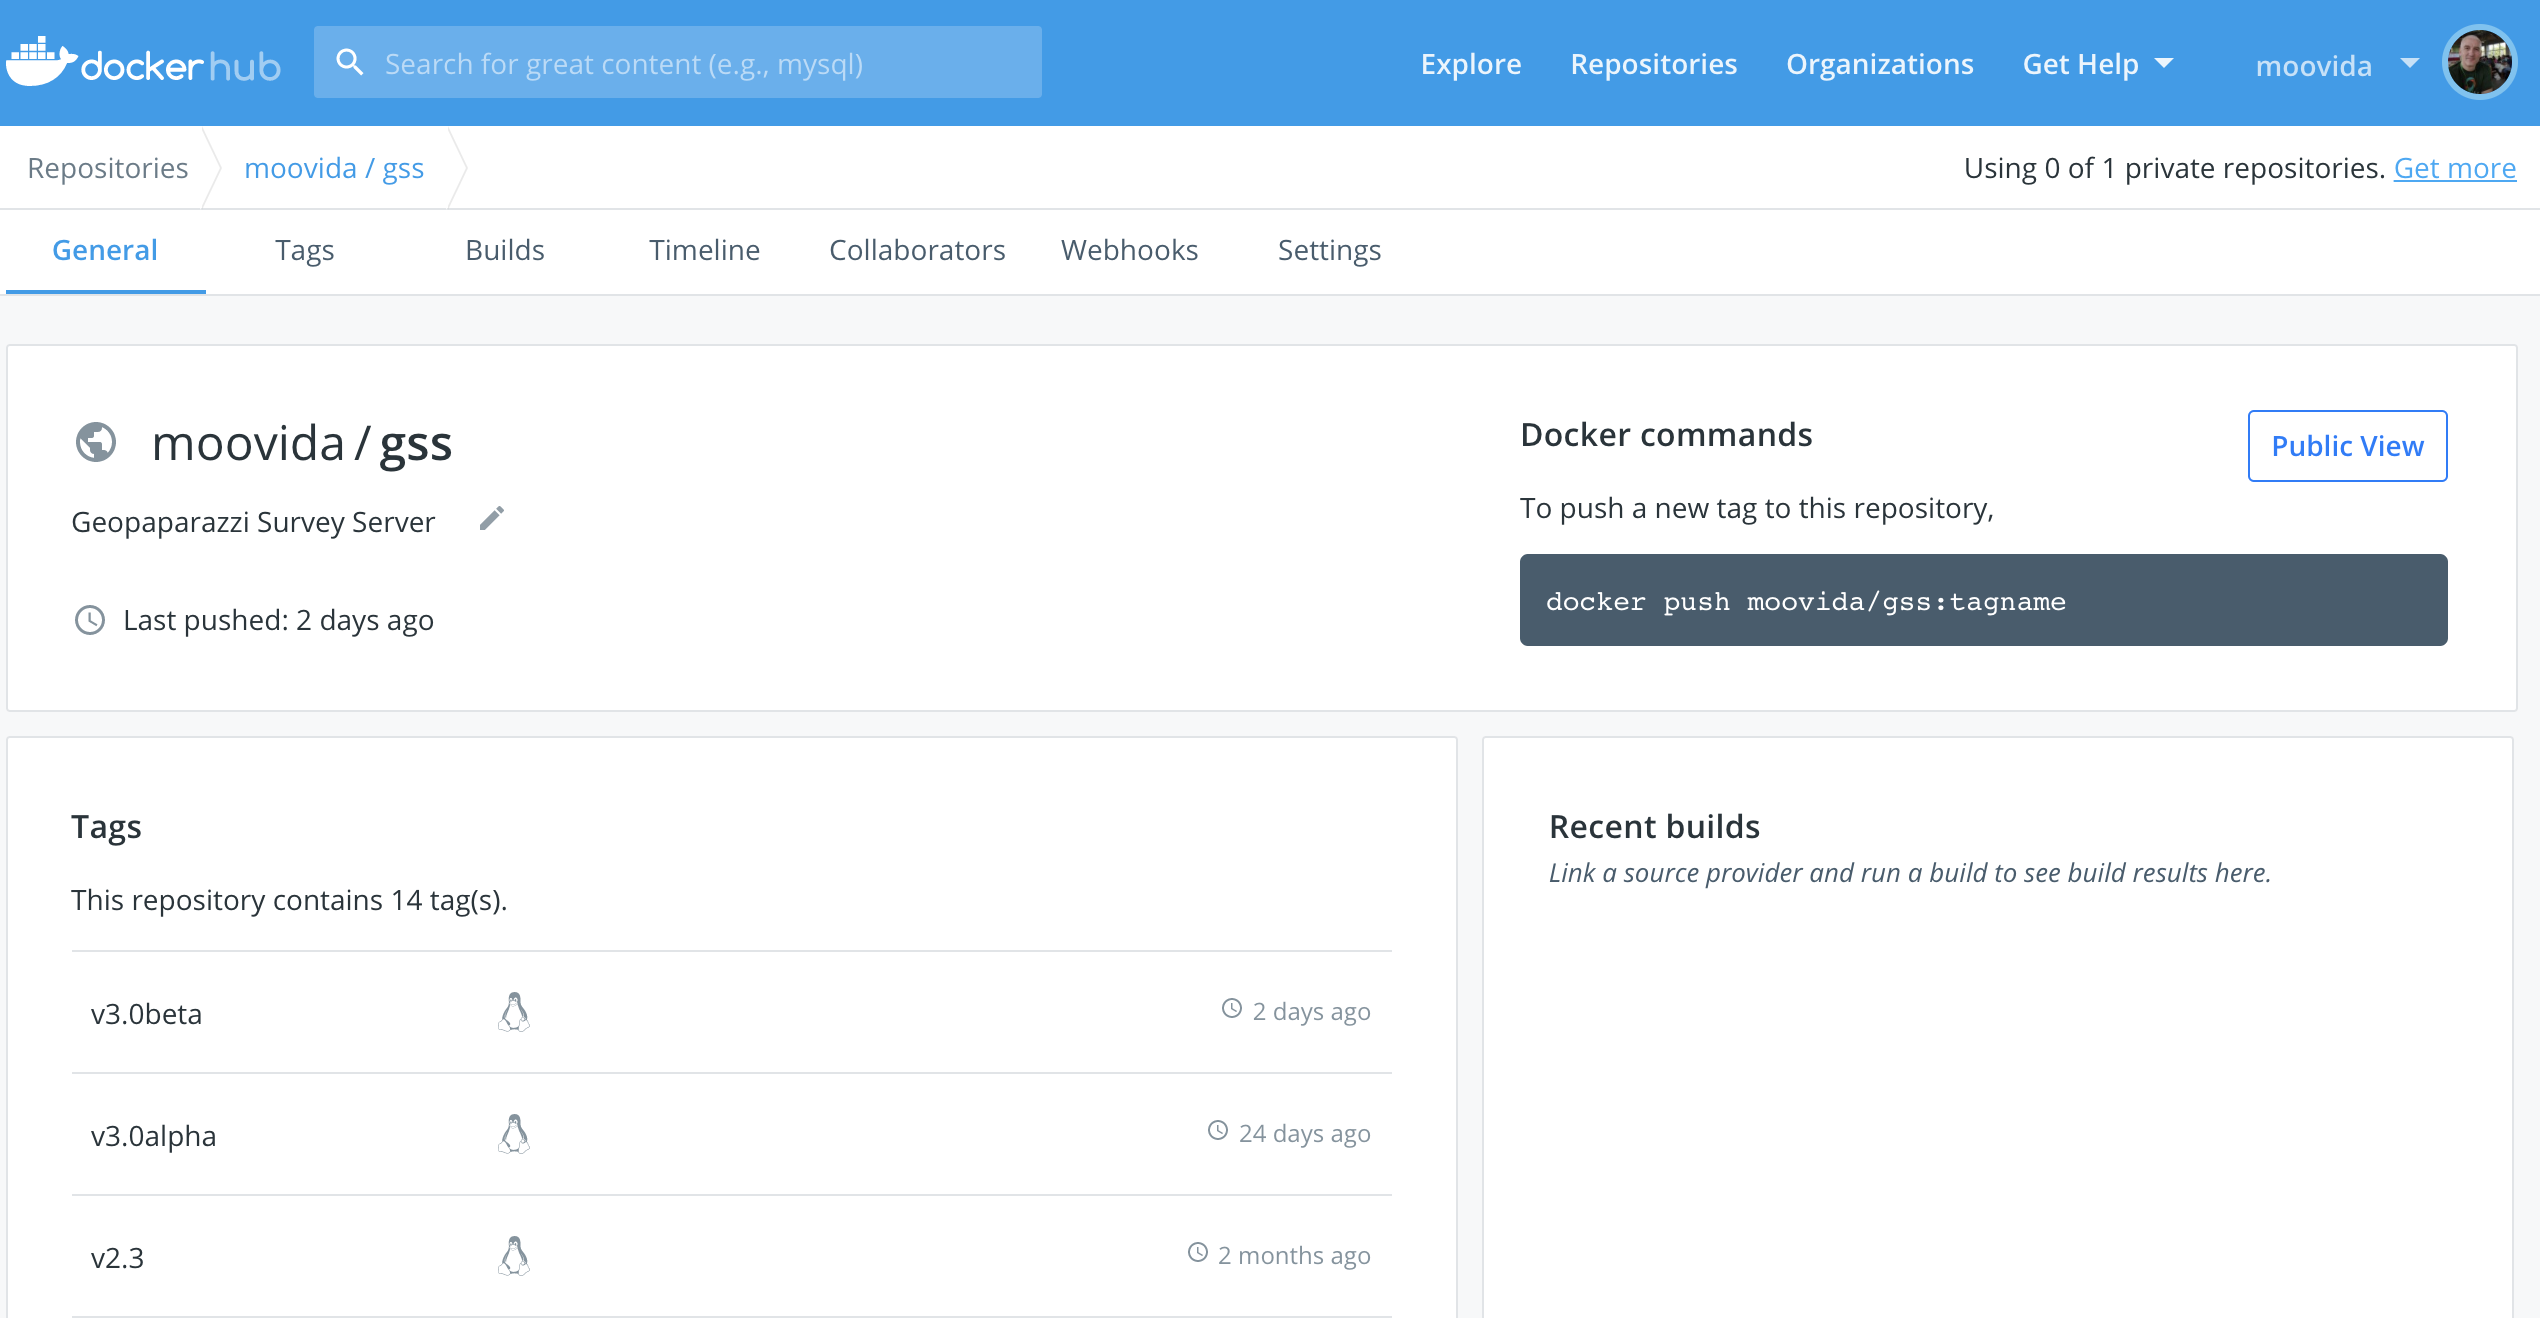
|
Once run you should now be able to access the web app in the browser at port 8080 ( http://localhost:8080 if run locally).
You should get the following login screen:
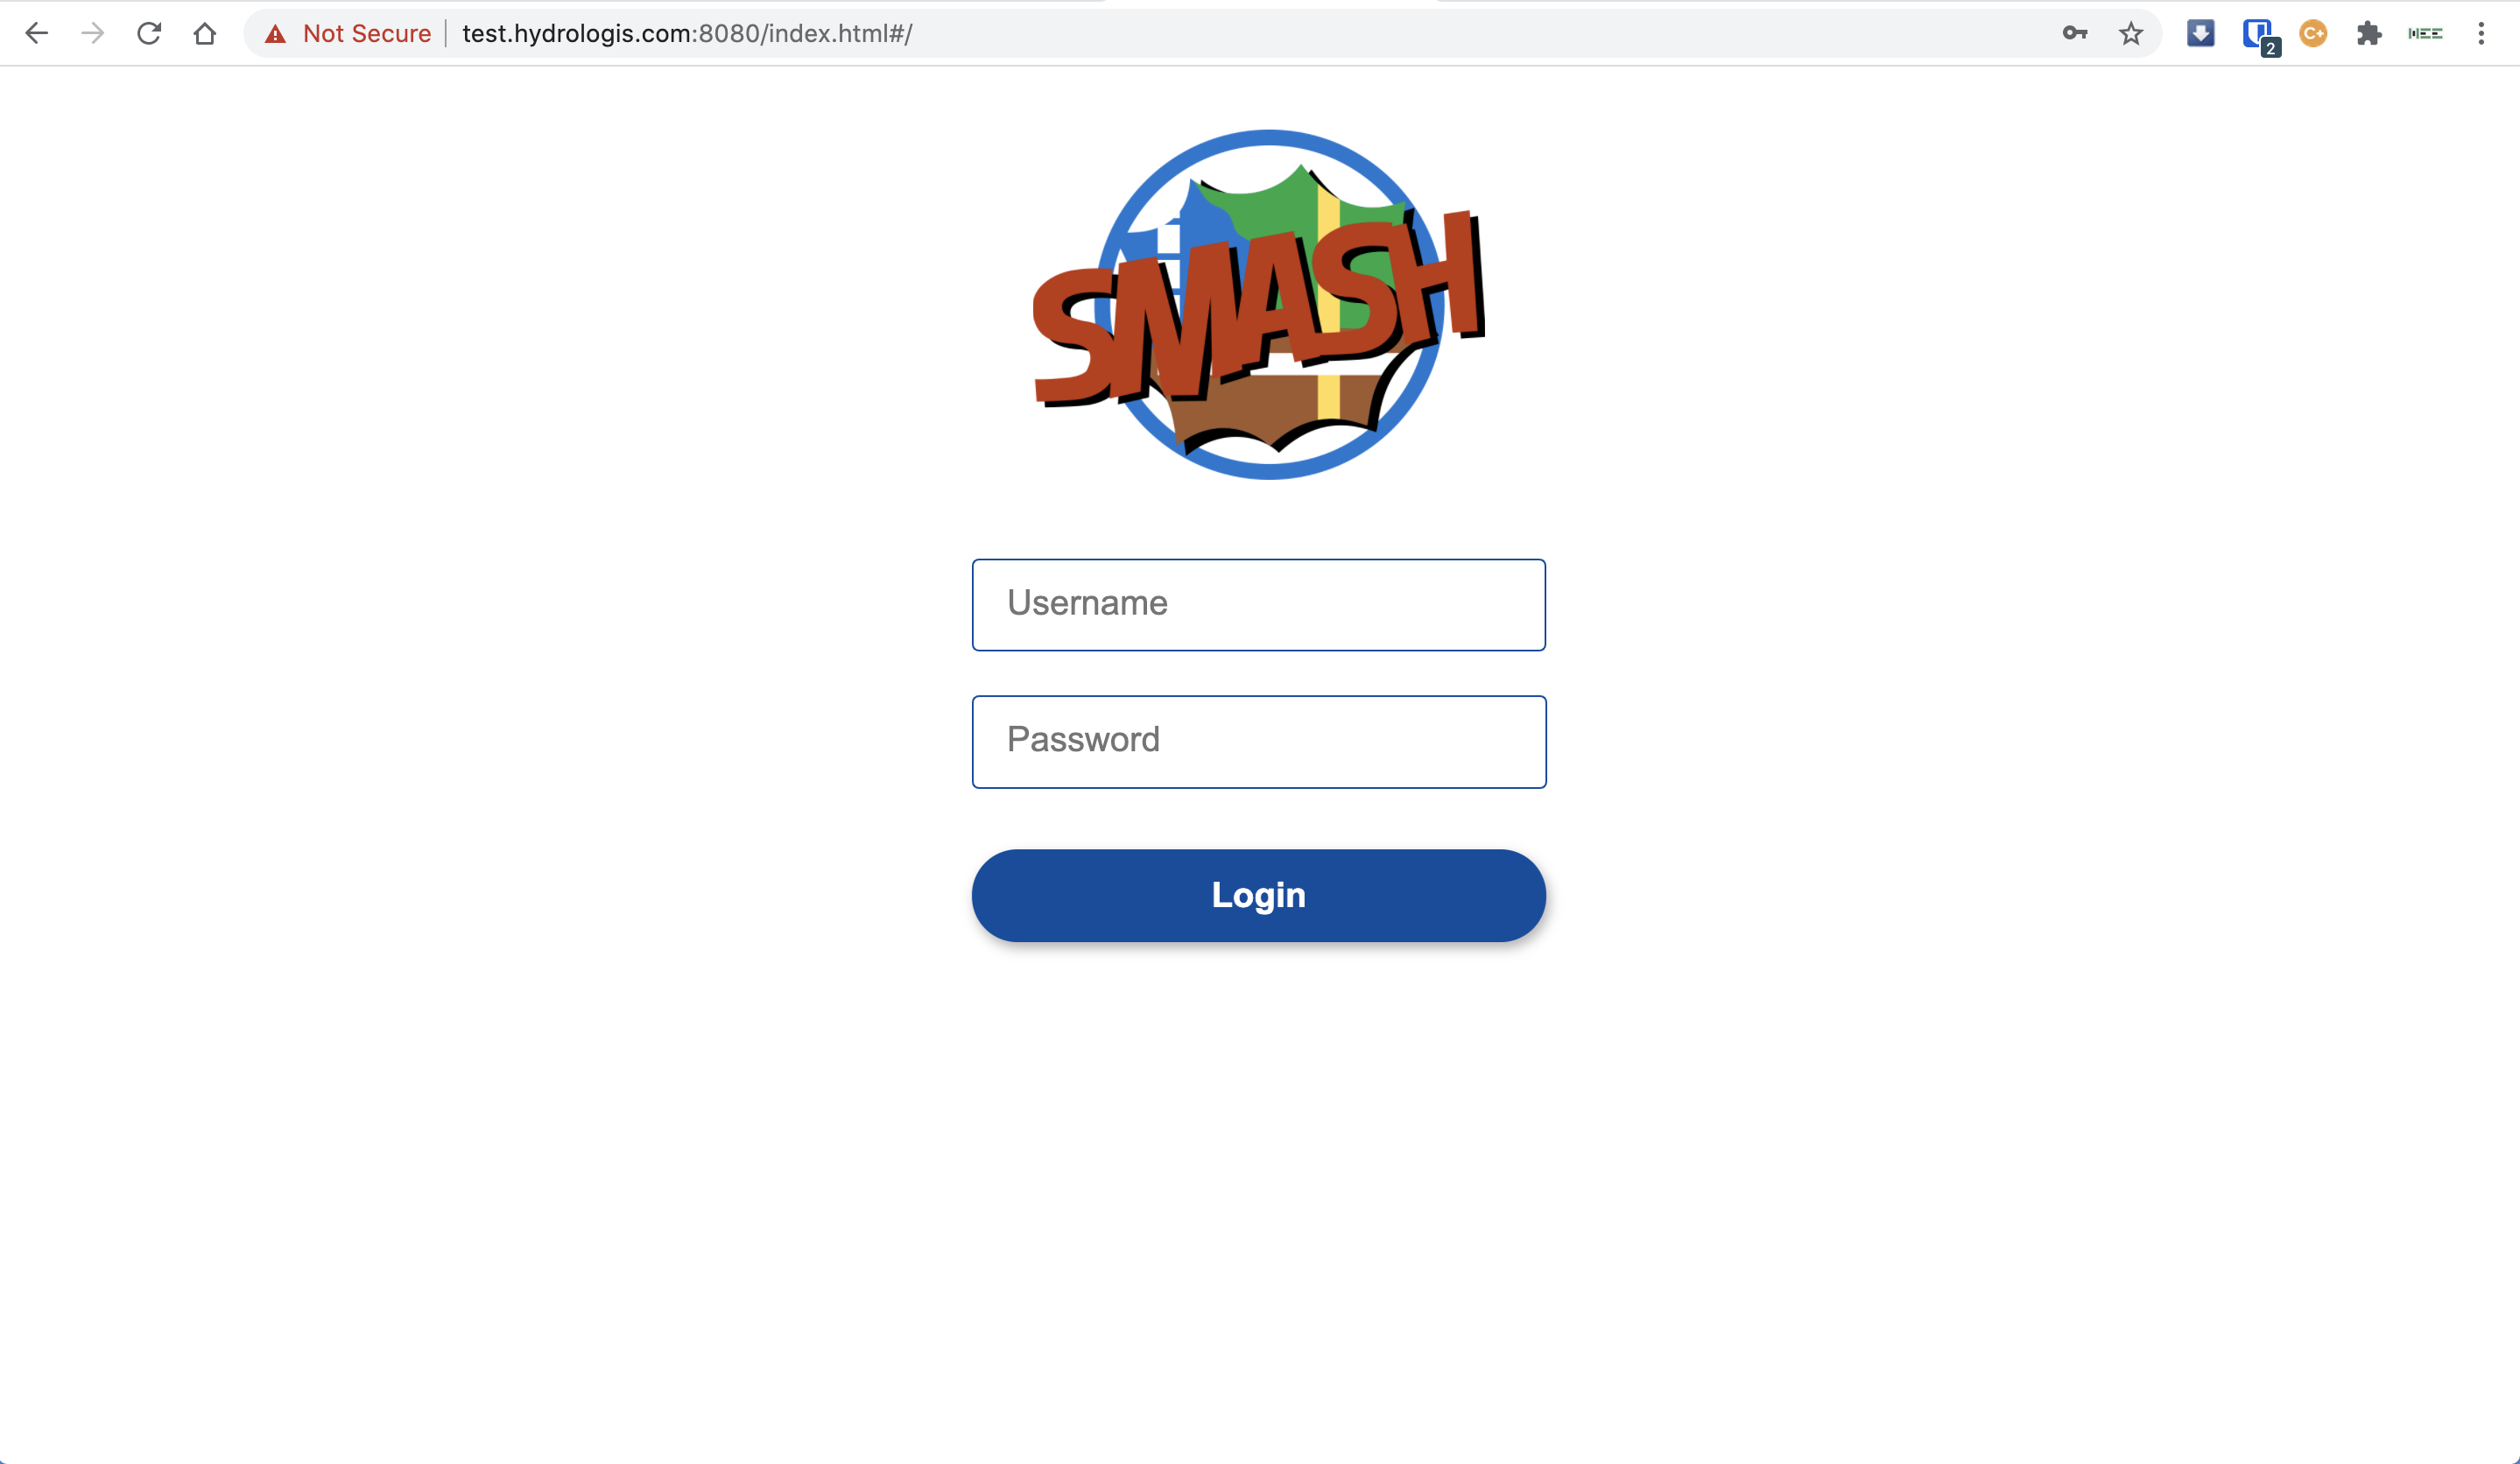
The GSS login screen.
This means that you are ready to rumble!
You can login with:
-
user: god
-
password: god
Which already tells us that the user has quite some admin rights.
For normal user access use:
-
user: user
-
password: user
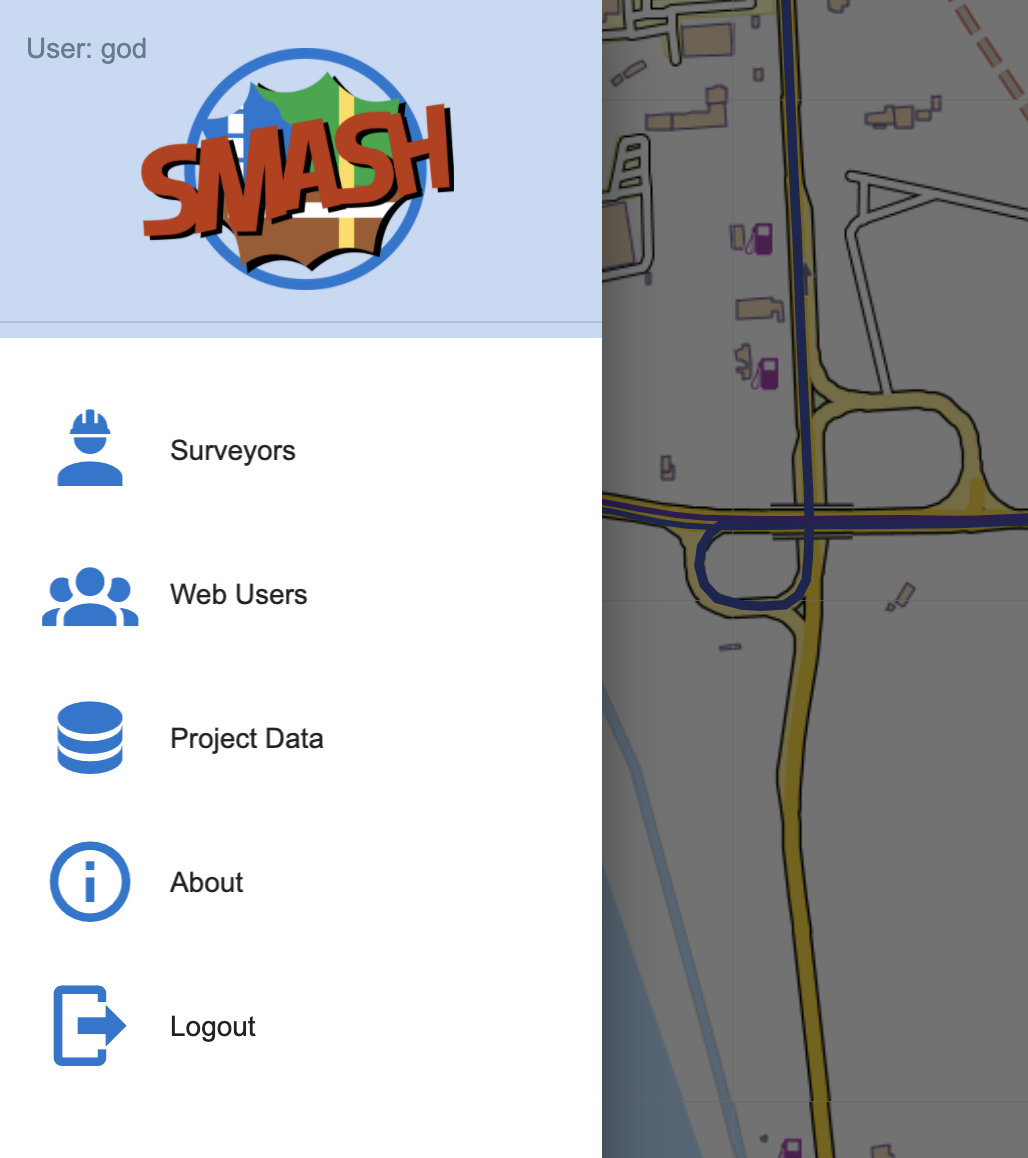
Once logged in, the dashboard view is shown.
2.3. Installation without docker
It is possible to install the GSS also without docker. It is way more customizable, but in that case the user will have to build the application from the source code.
3. Anatomy of the GSS
The GSS views are organized as follows. The main view is the map view. From there different toolsets and sections can be accessed:
-
left upper menu icon. This gives access to:
-
the drawer header which also shows the current logged user
-
the Surveyors view
-
the Web Users view
-
the Project Data view
-
the About view
-
the logout button
-
-
the upper central navigation buttons
-
various tools at the upper right part of the map
-
the bottom attributes table, if enabled
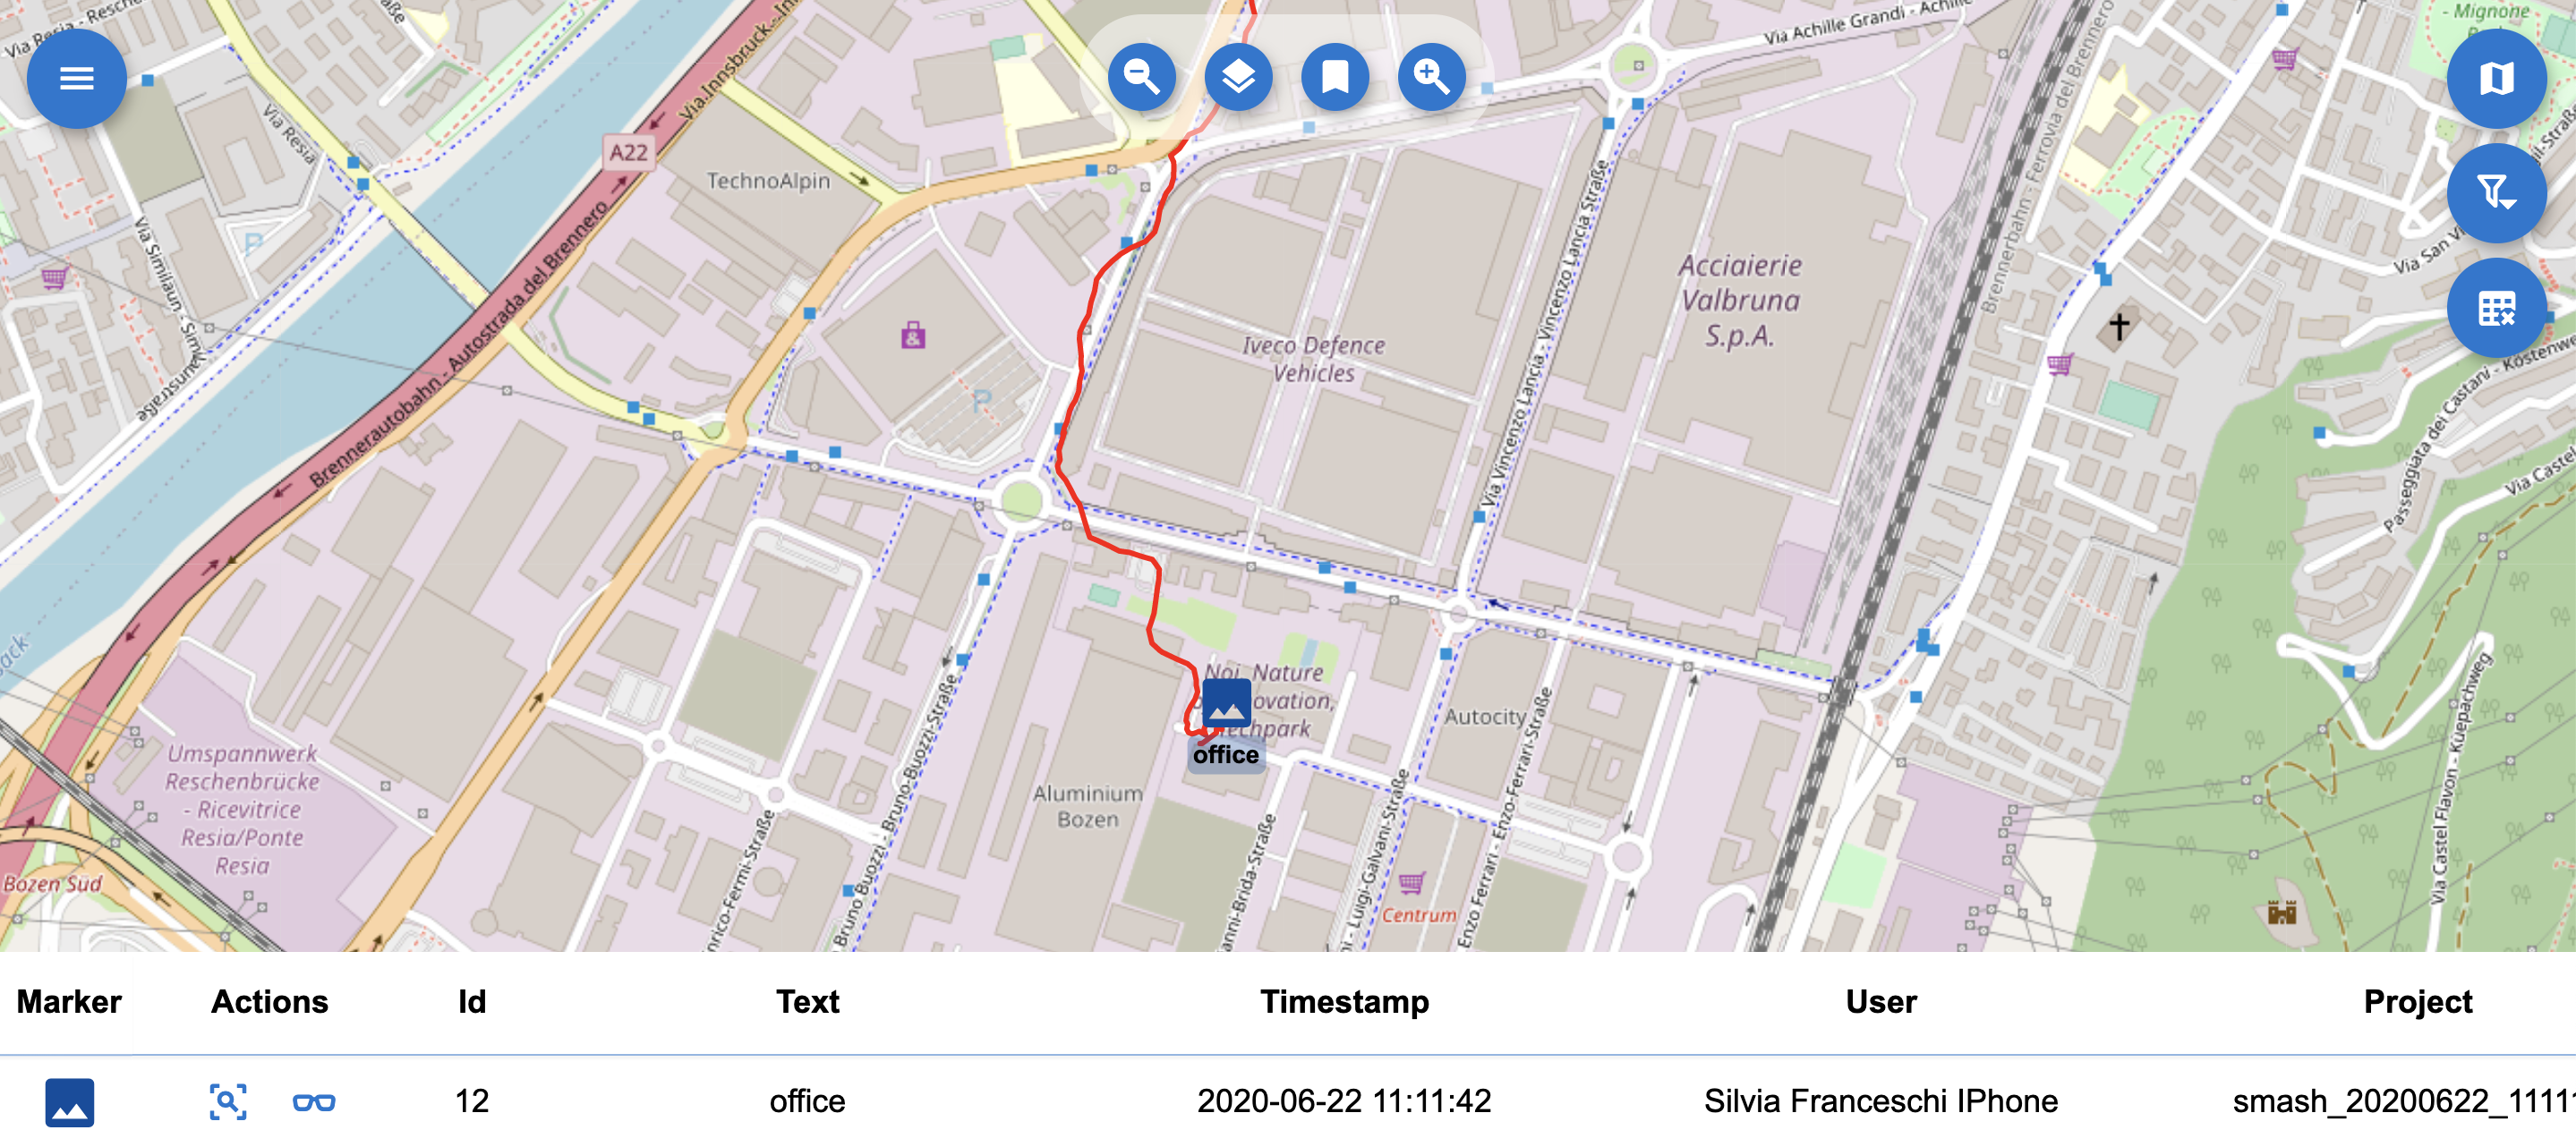
3.1. The mapview
The main map view features a background map and the survey data on top of it. The survey data are clickable and the proper widgets will open to show the data content, being it images, simple notes or form based notes.
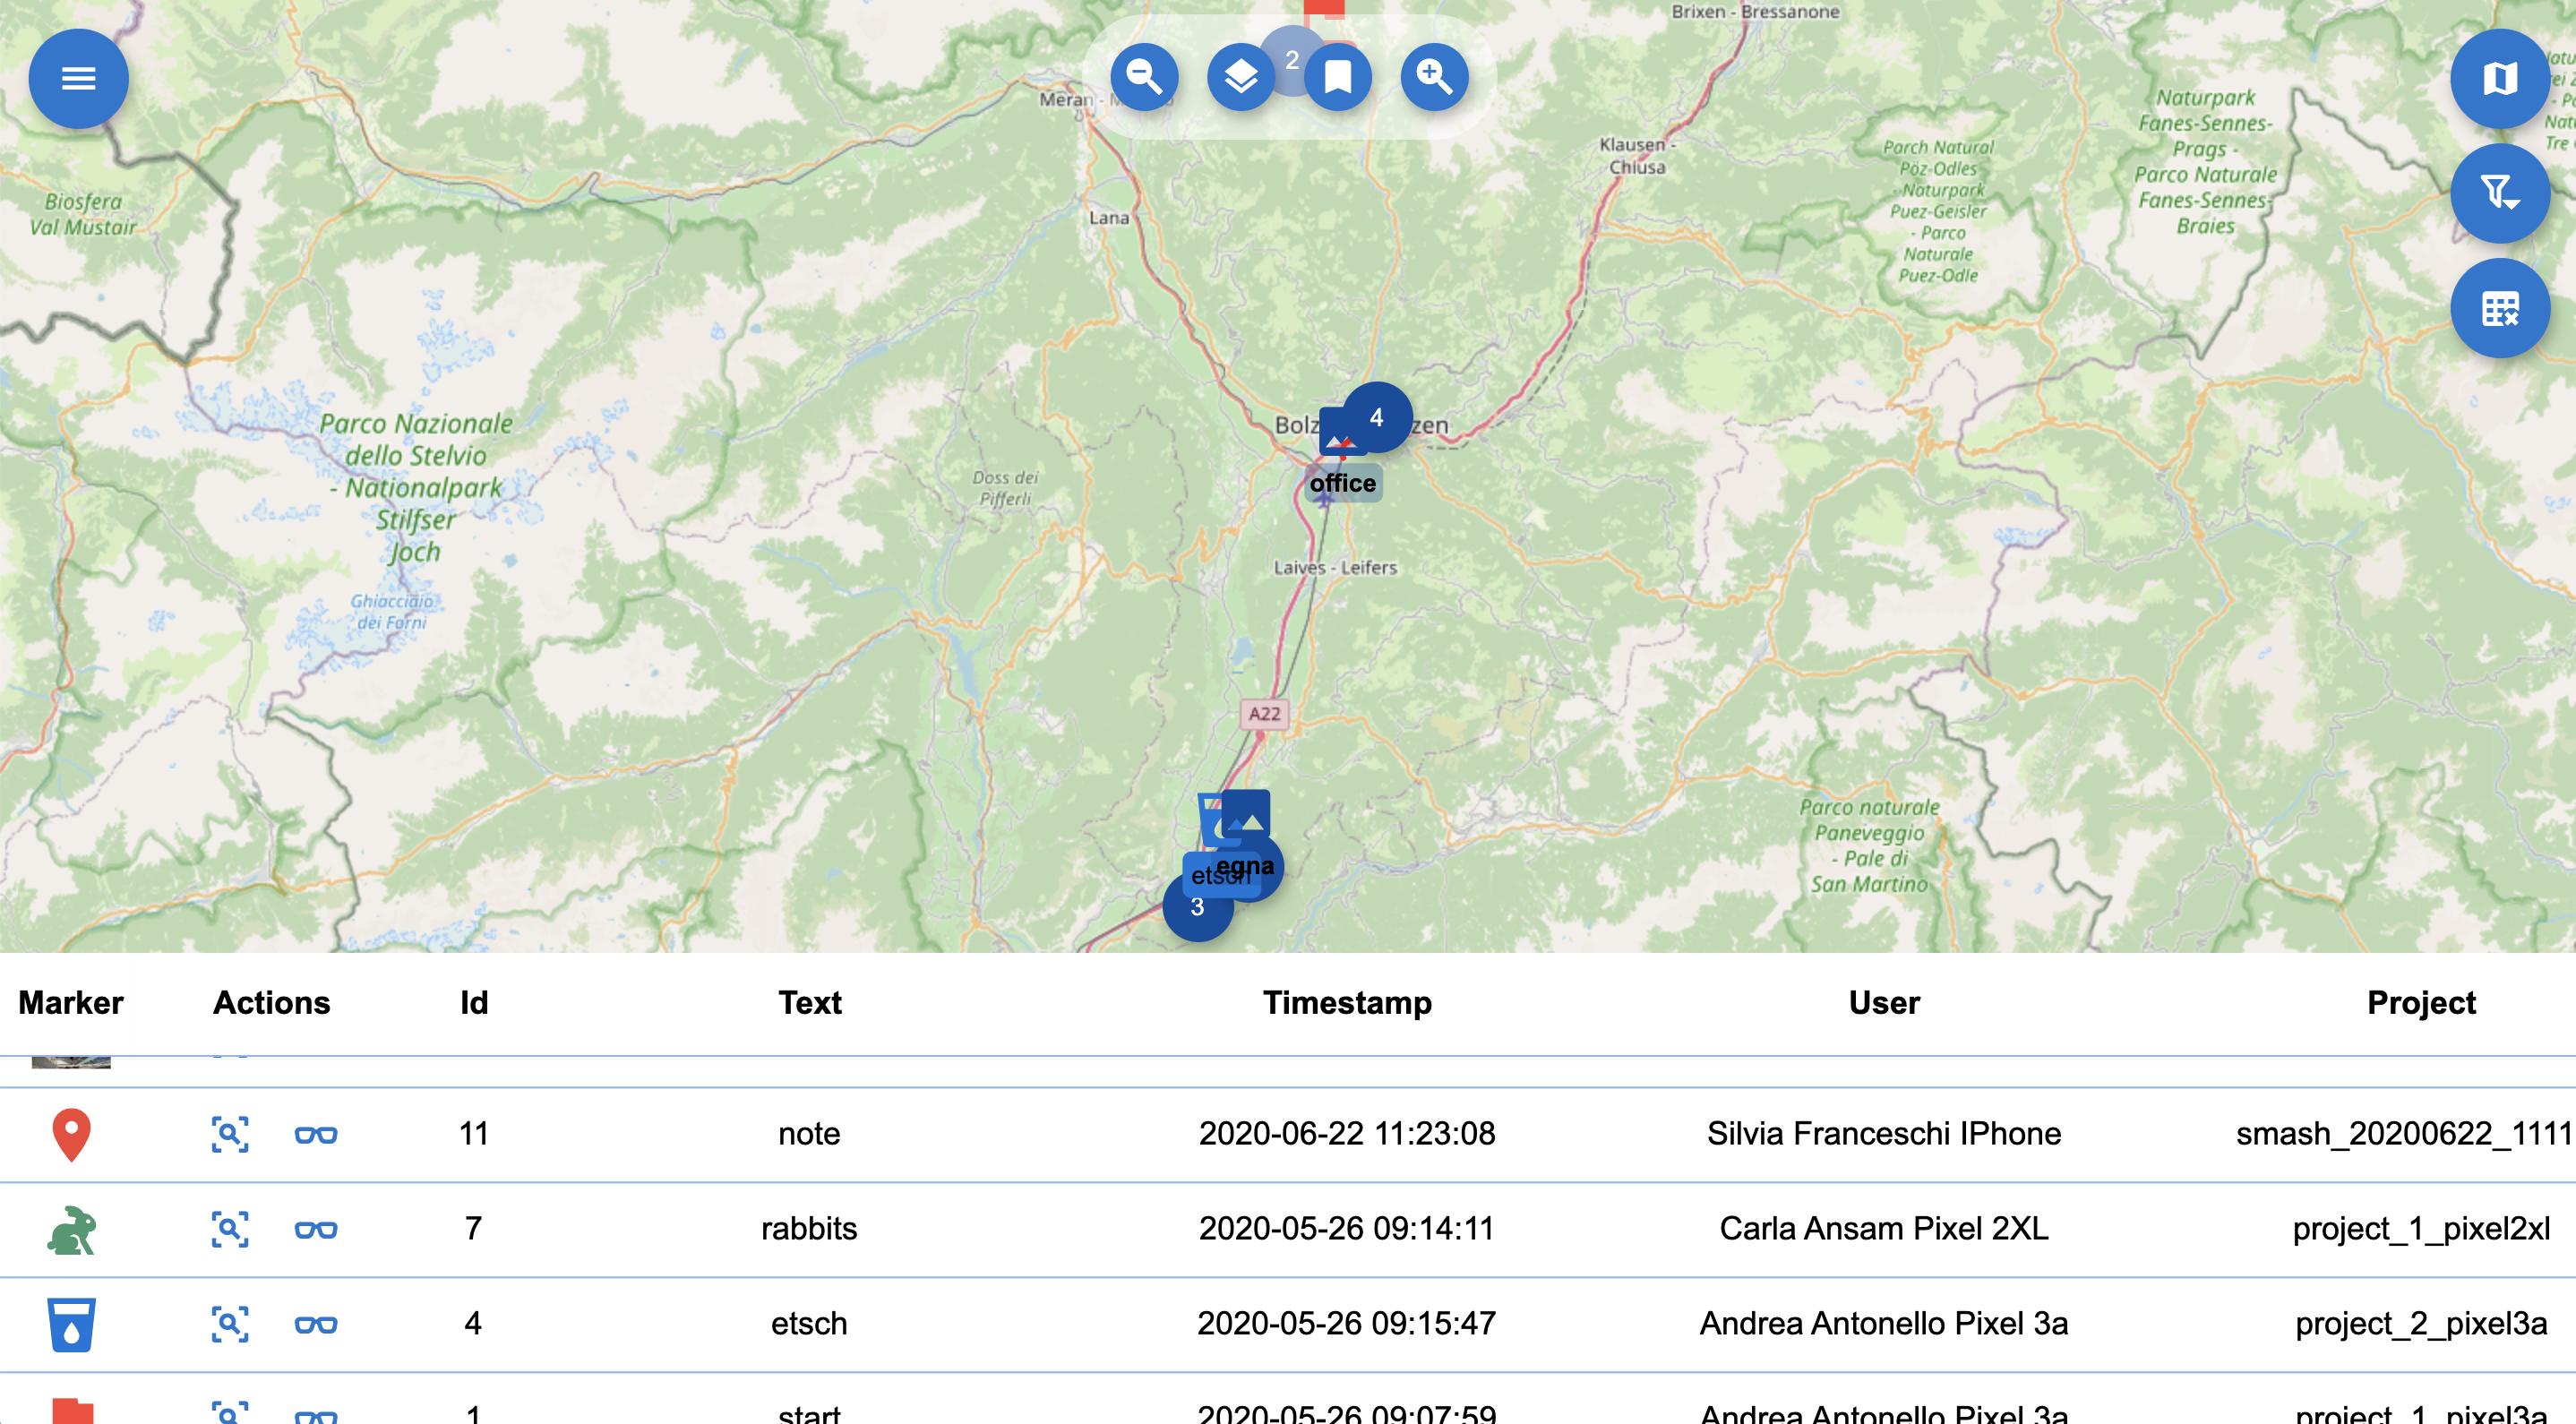
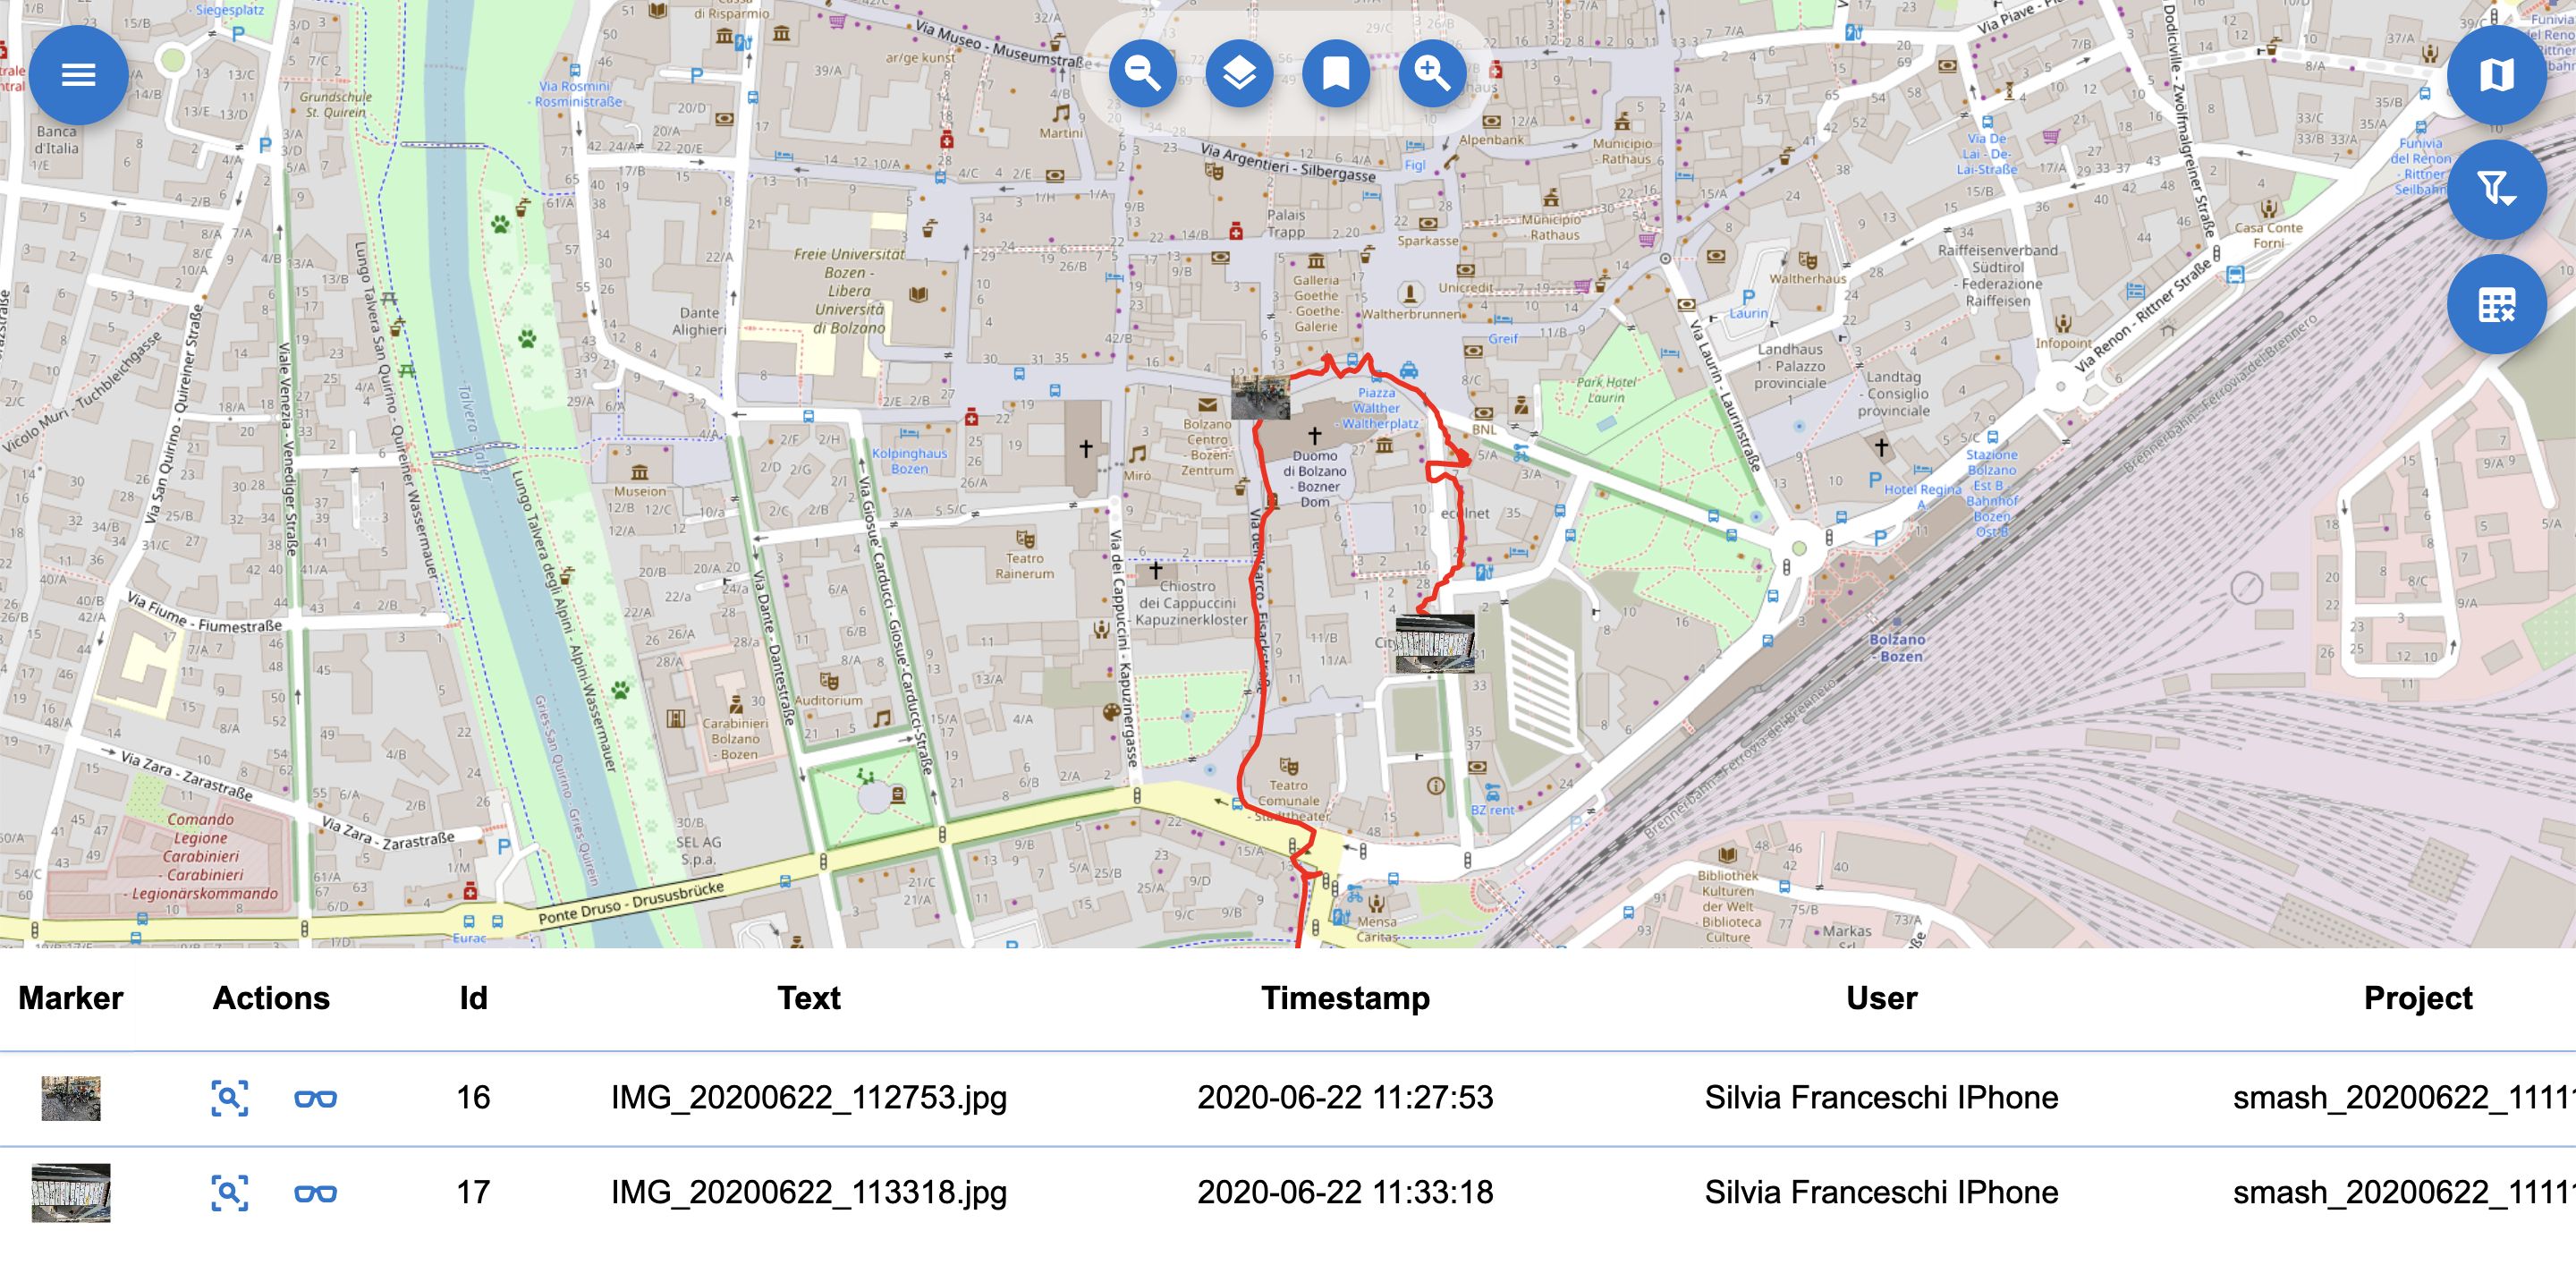
The mapview with opened attributes table.
3.2. The navigation buttons
The navigation tools are basically 4 buttons. The first and last buttons are the well known zoom in and zoom out buttons and do not need explanation. Zooming can be achieved also by scrolling with the mouse wheel. To pan the map, the mouse can be used pushing the left button and dragging the map.
The second navigation button from the left is the zoom to data button and sets the boundaries of the map to the bounds of all the currently loaded data.
The third navigation button is the bookmarks button. Pushing it opens the bookmarks view.
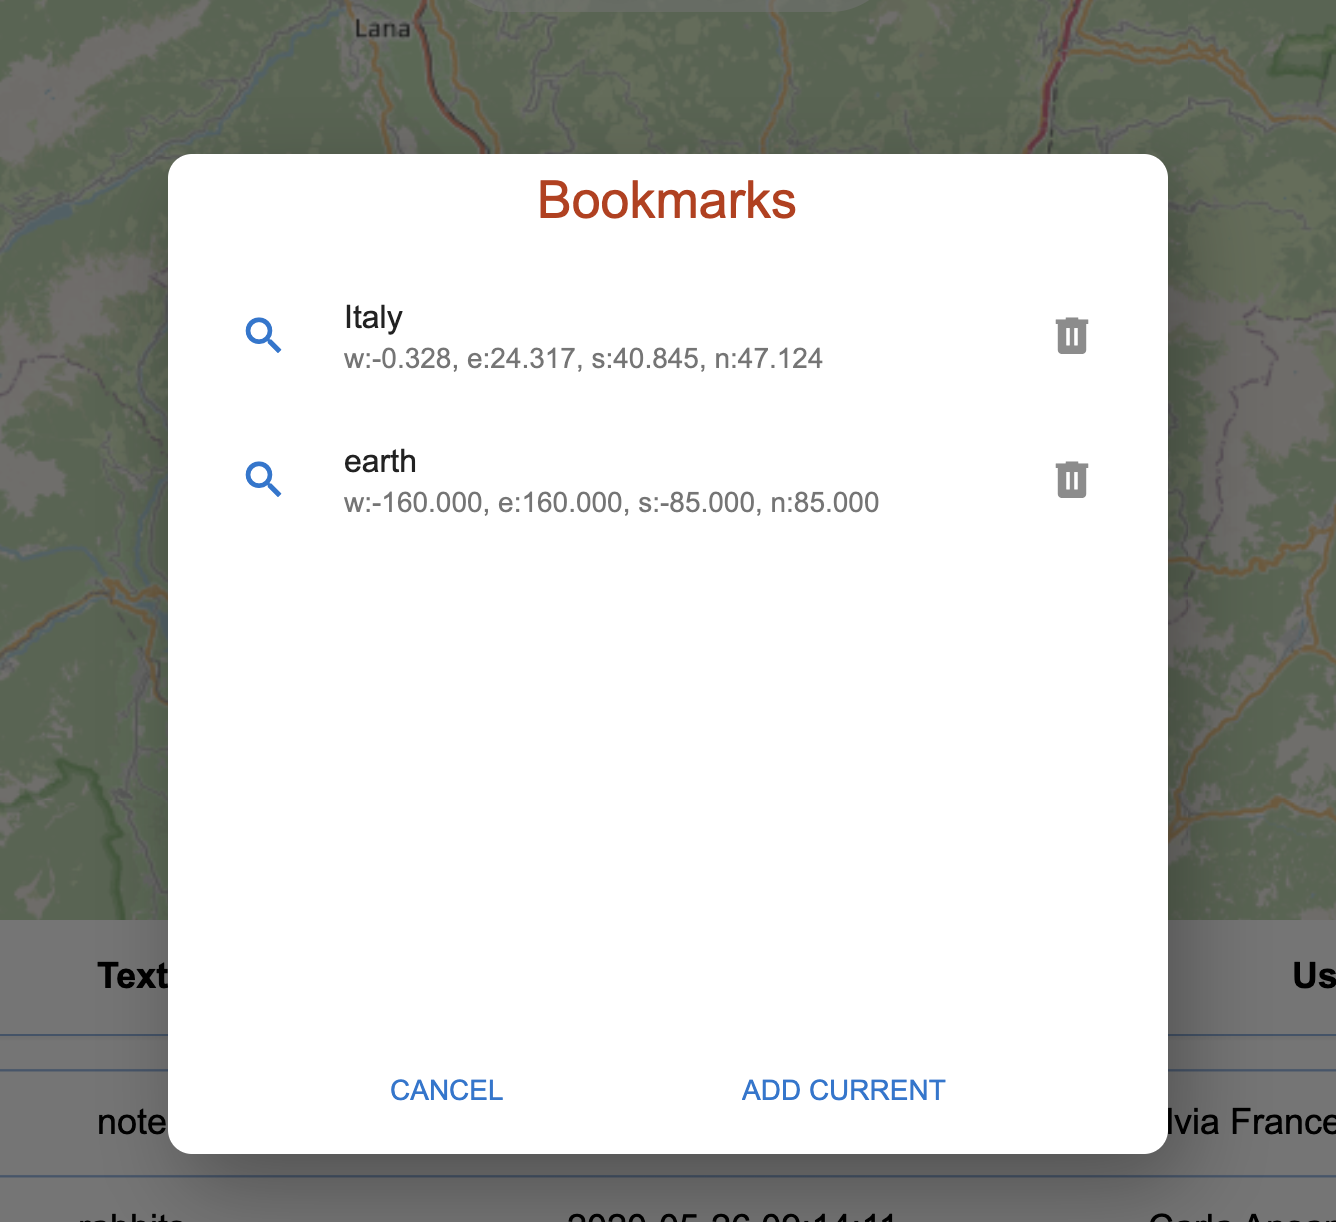
The bookmarks view.
The view contains a set of bookmarks, that can be selected by pushing the magnification icon on the left. To add a bookmark just push ADD CURRENT, which will create a new bookmark using the last visible map area. To remove a bookmark, the rightside trash icon can be used.
3.3. Map selector, filters and attribute table
At the upper right side of the map, we find 3 icons.
The map selector: the map selector button opens a view that allows the user to select from a set of maps the one to use in the map view.
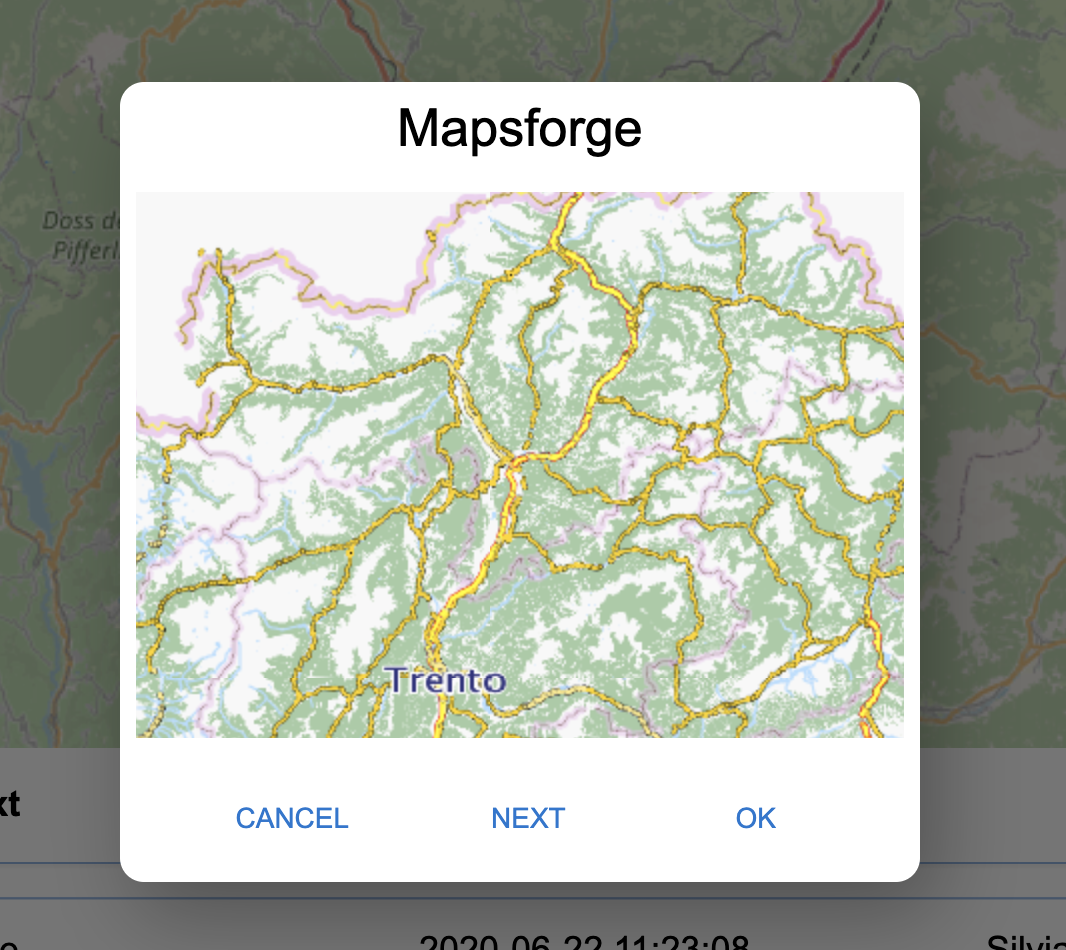
The map selector view.
It is important to note that the first map is a map that is generated from the server itself, if mapsforge *.map files are present in the DATA folder of the installation of the GSS.
The filter dialog: the filter button opens the filter dialog, which allows for some very simple filtering of the data, based on the surveyors:
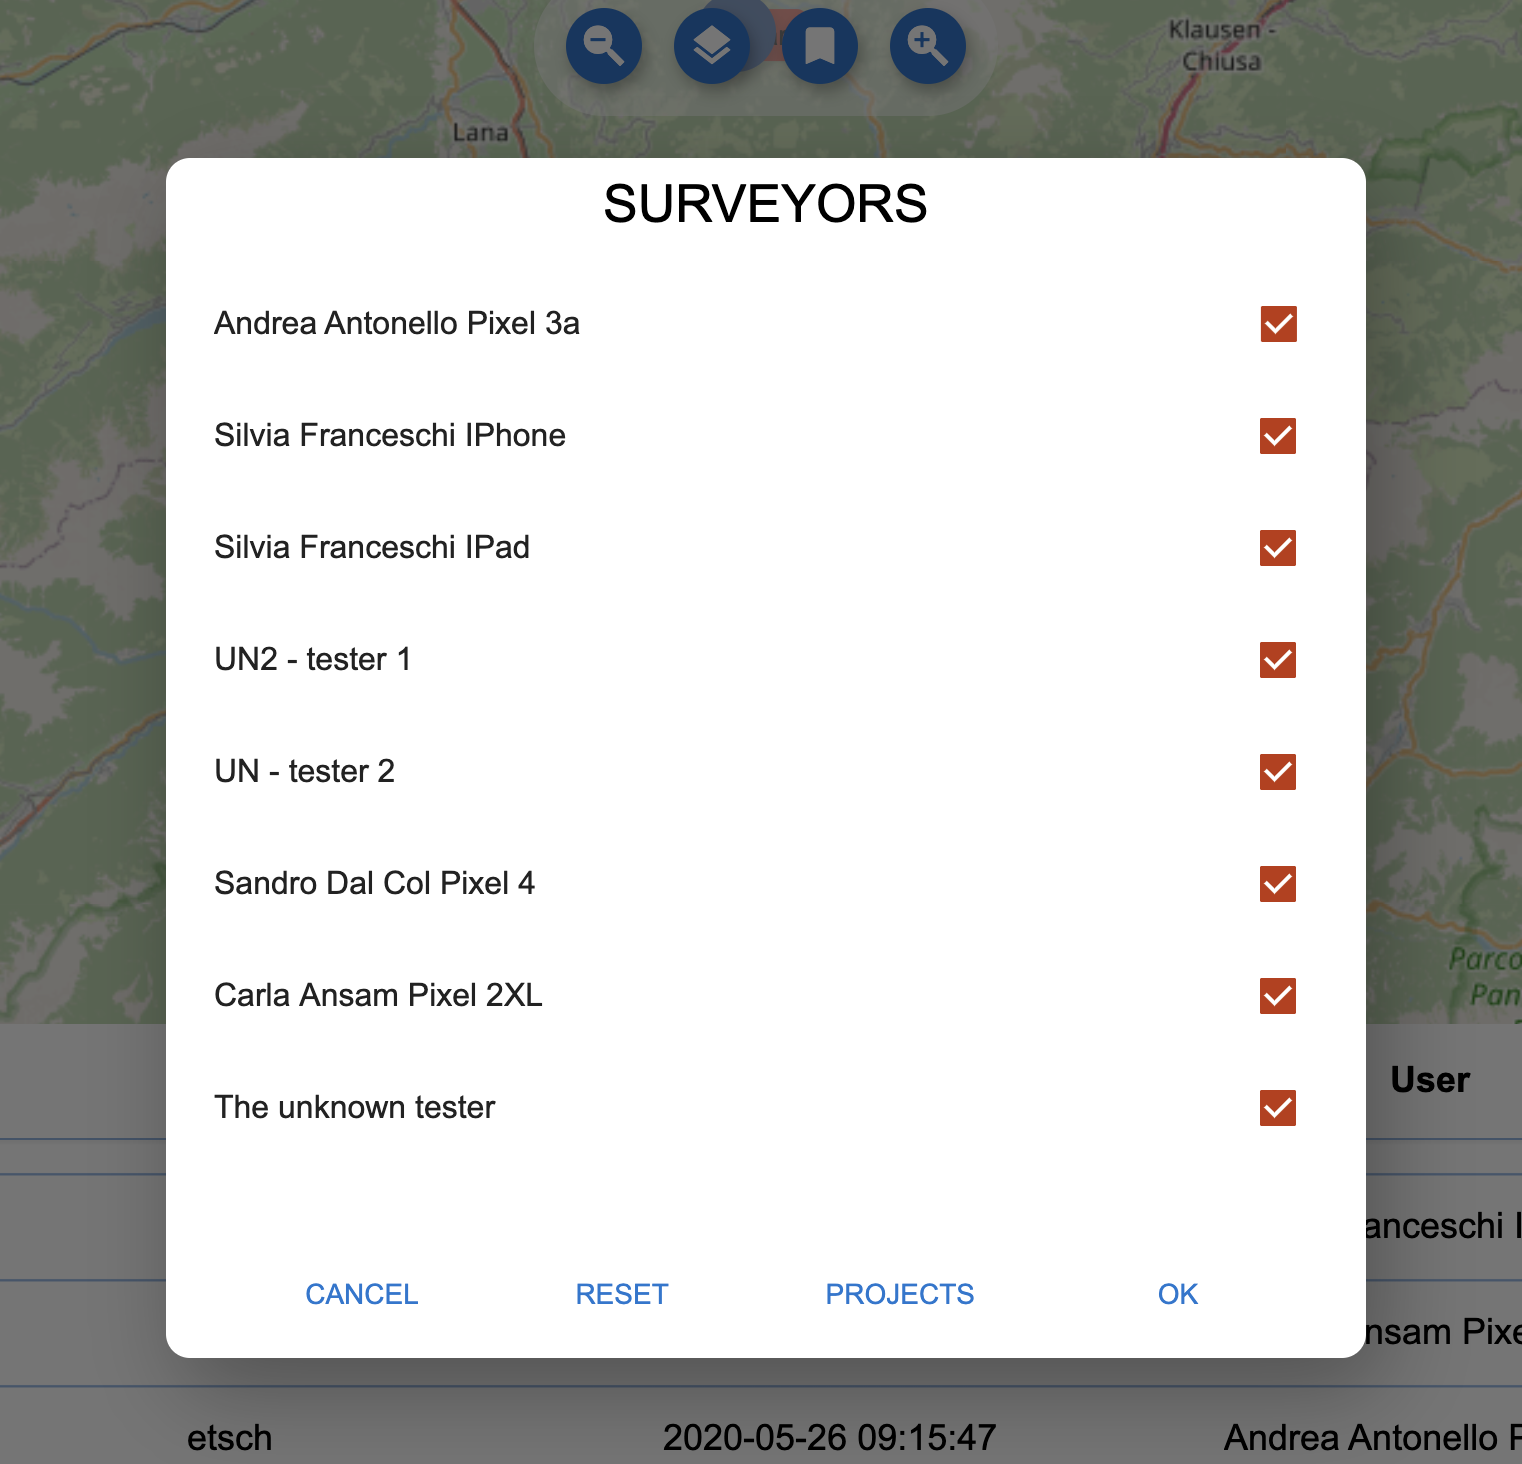
The filter dialog for surveyors.
or on projects:
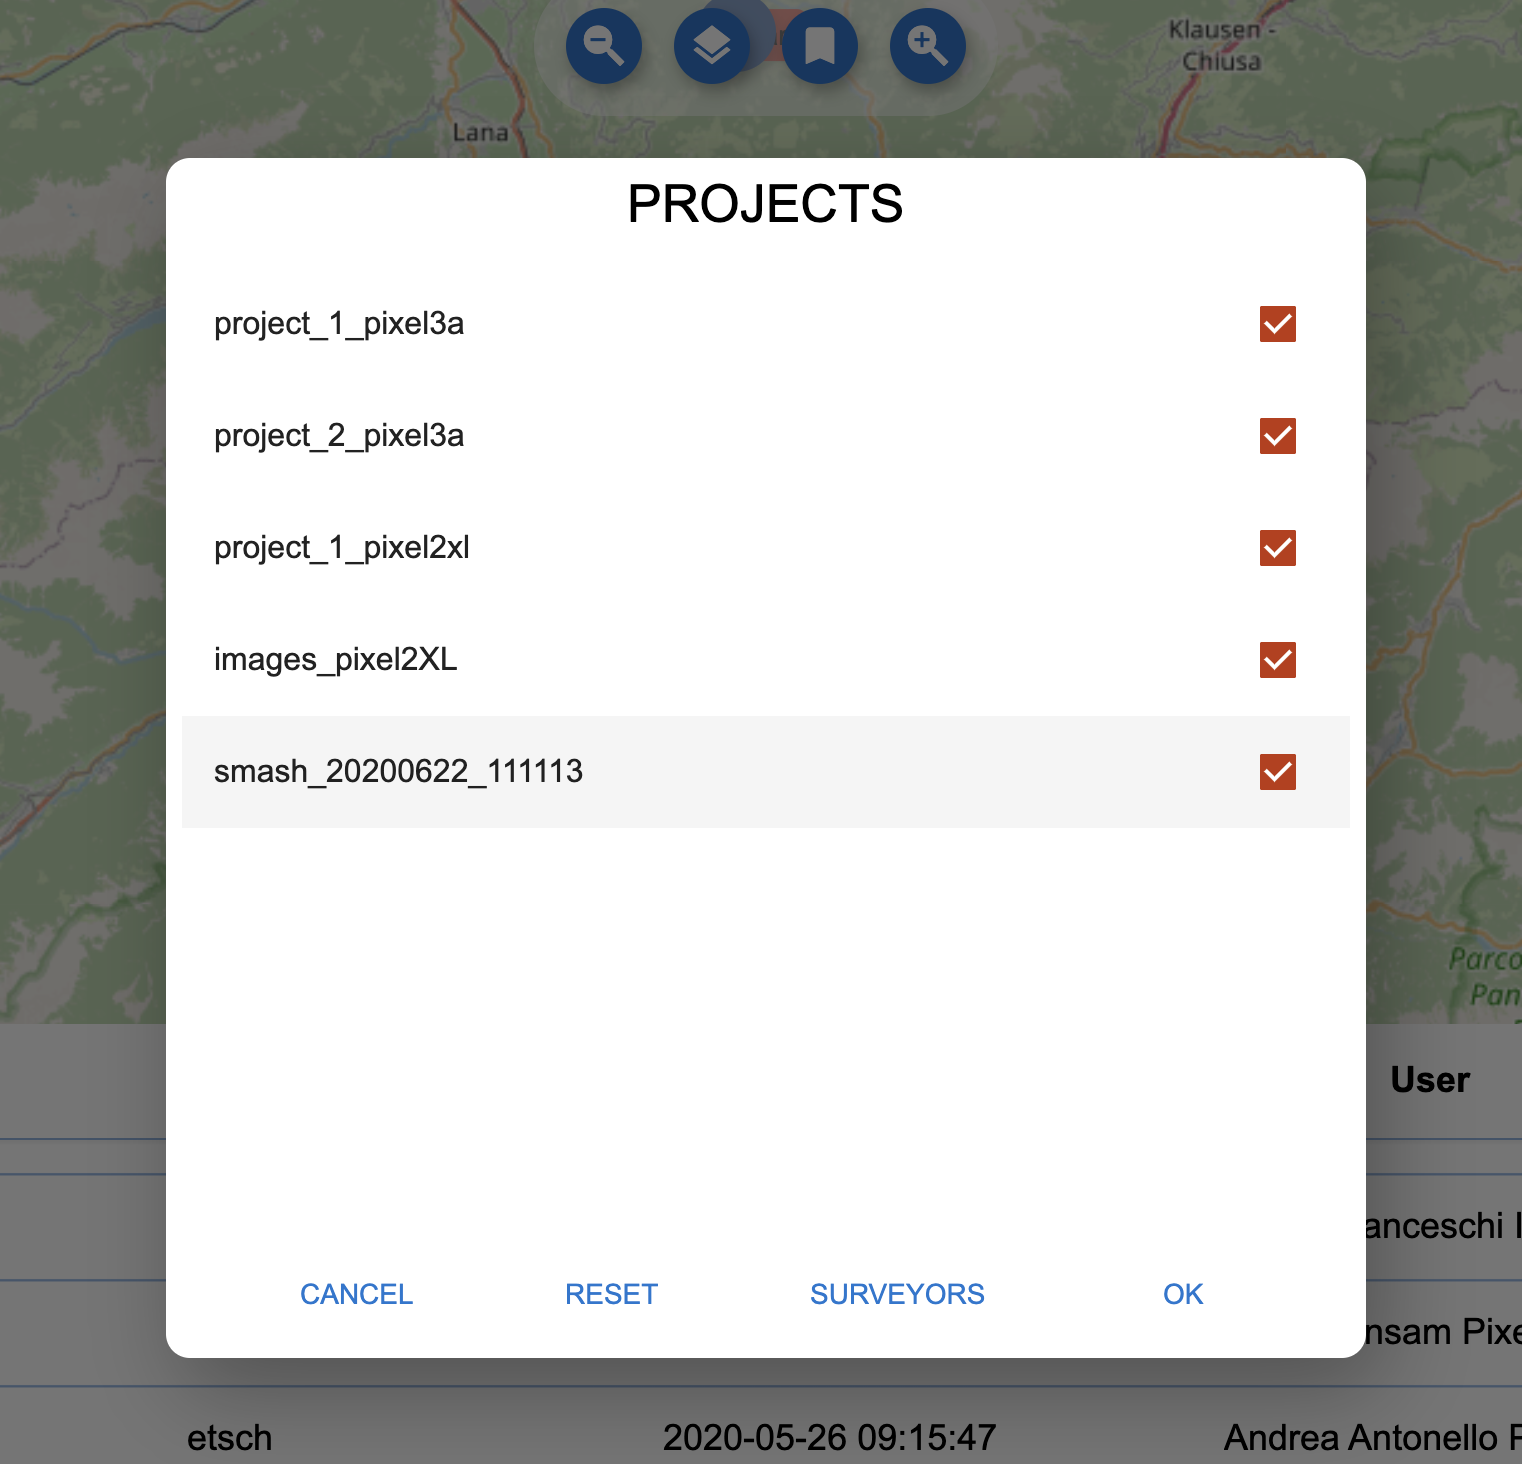
The filter dialog for projects.
From the dialog it is simple to enable or disable surveyors or projects.
Once OK is pushed, the data on the map view are reloaded to reflect the filter applied.
The attributes table: the attributes table button toggles the visibility of the attributes table.
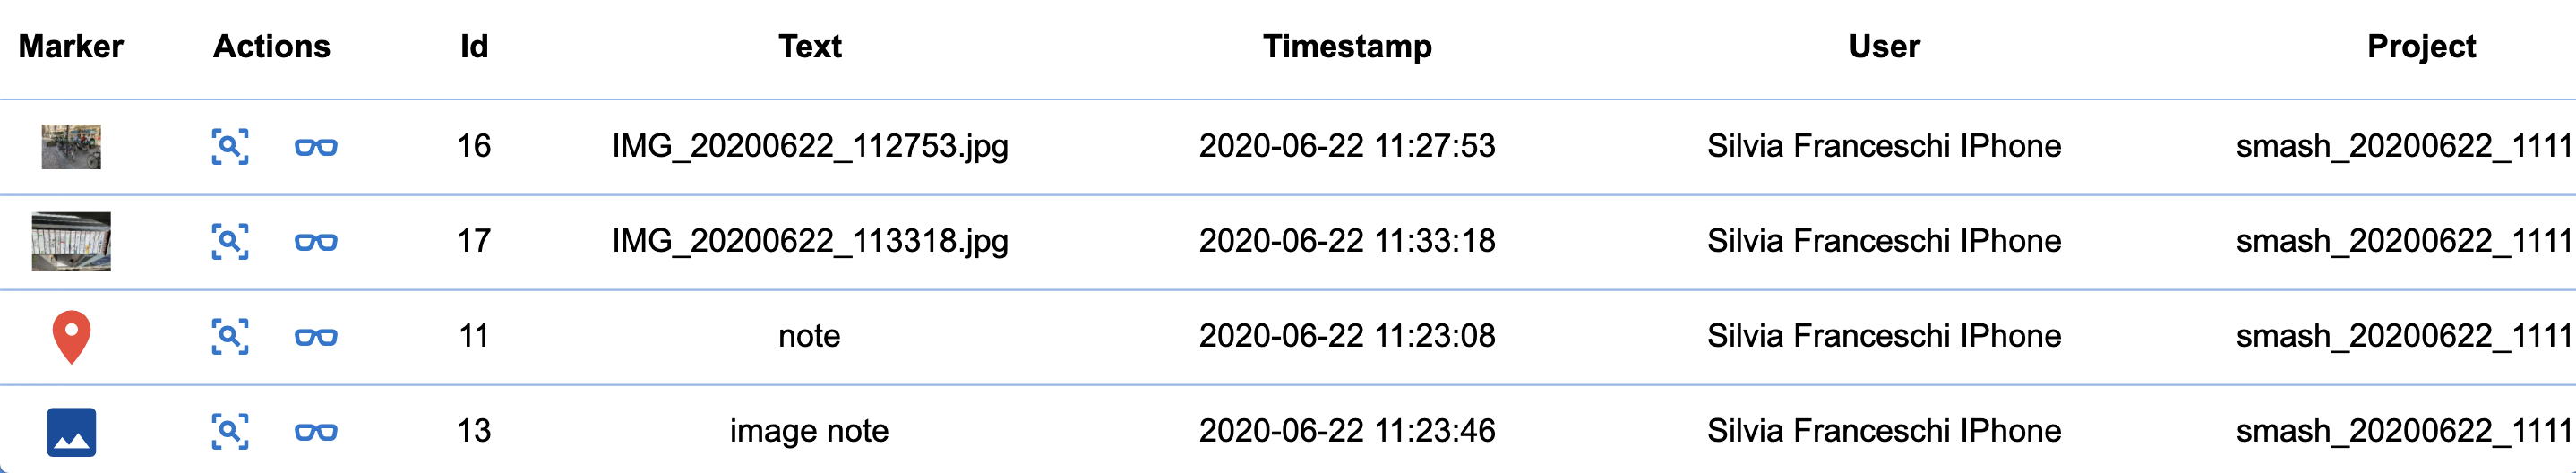
The attributes table lists only the data currently visible on the map view. It features information about the survey notes, showing the proper icon, note title, the timestamp as well as the surveyor and project the note is part of.
It also allows the user to zoom to the selected note or open the note through the buttons in the Actions column.
3.4. Visualizing data
To view a note, image or form the user can just click on it in the map view or, to have better control, use the open action in the attributes table.
Image notes: Image notes are visible on the map as little thumbnail images.
The image note thumbnails on the map.
Clicking on them opens the image in larger mode:
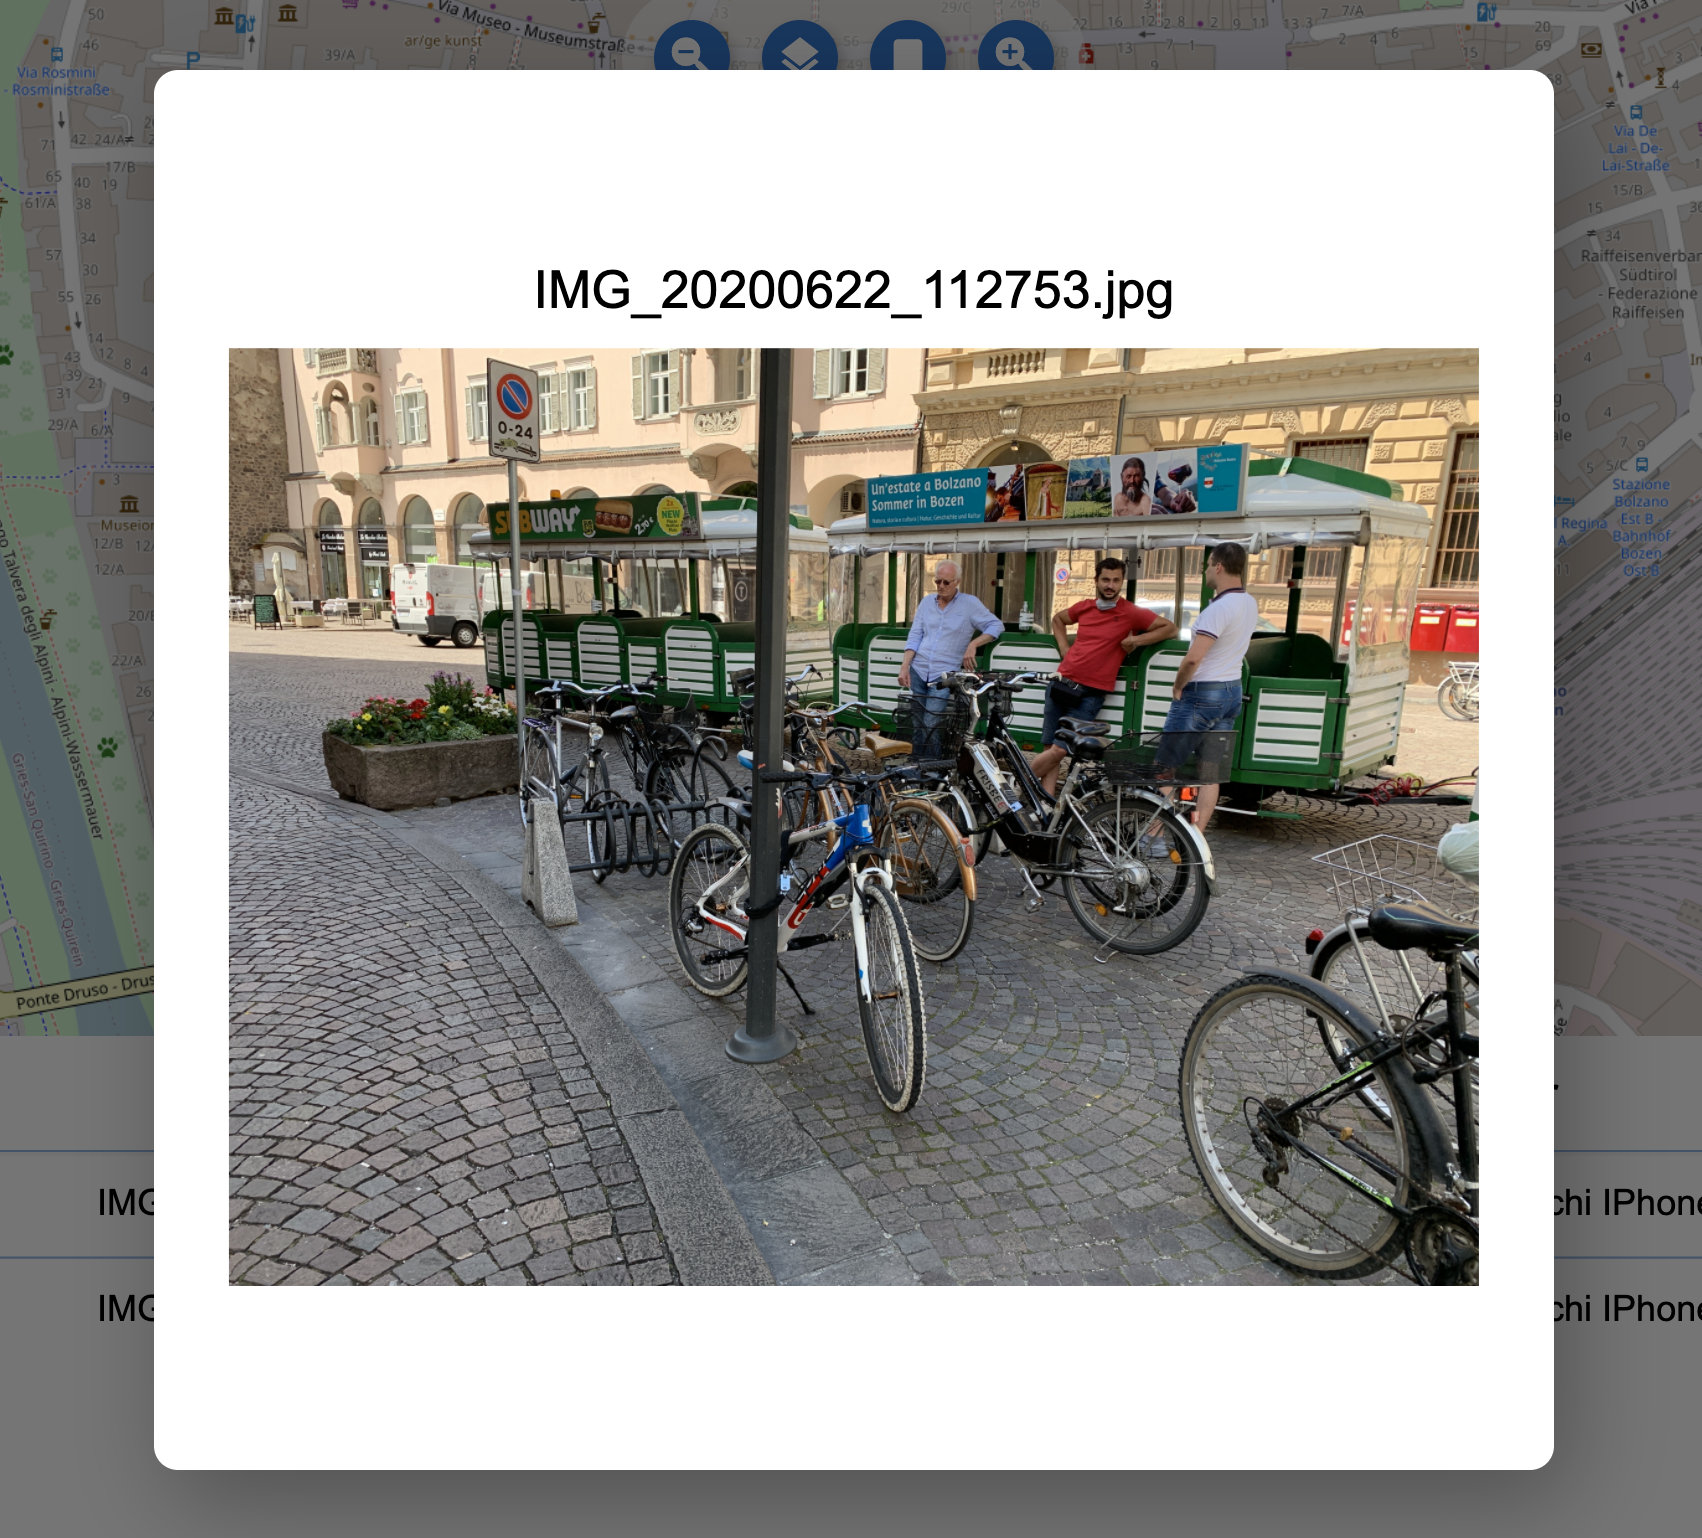
The image note.
Simple notes: Simple notes are visible on the map using the icon that has been chosen during the survey with SMASH. If the survey was done with geopaparazzi, which doesn’t support note icons, then a default marker icon is used.
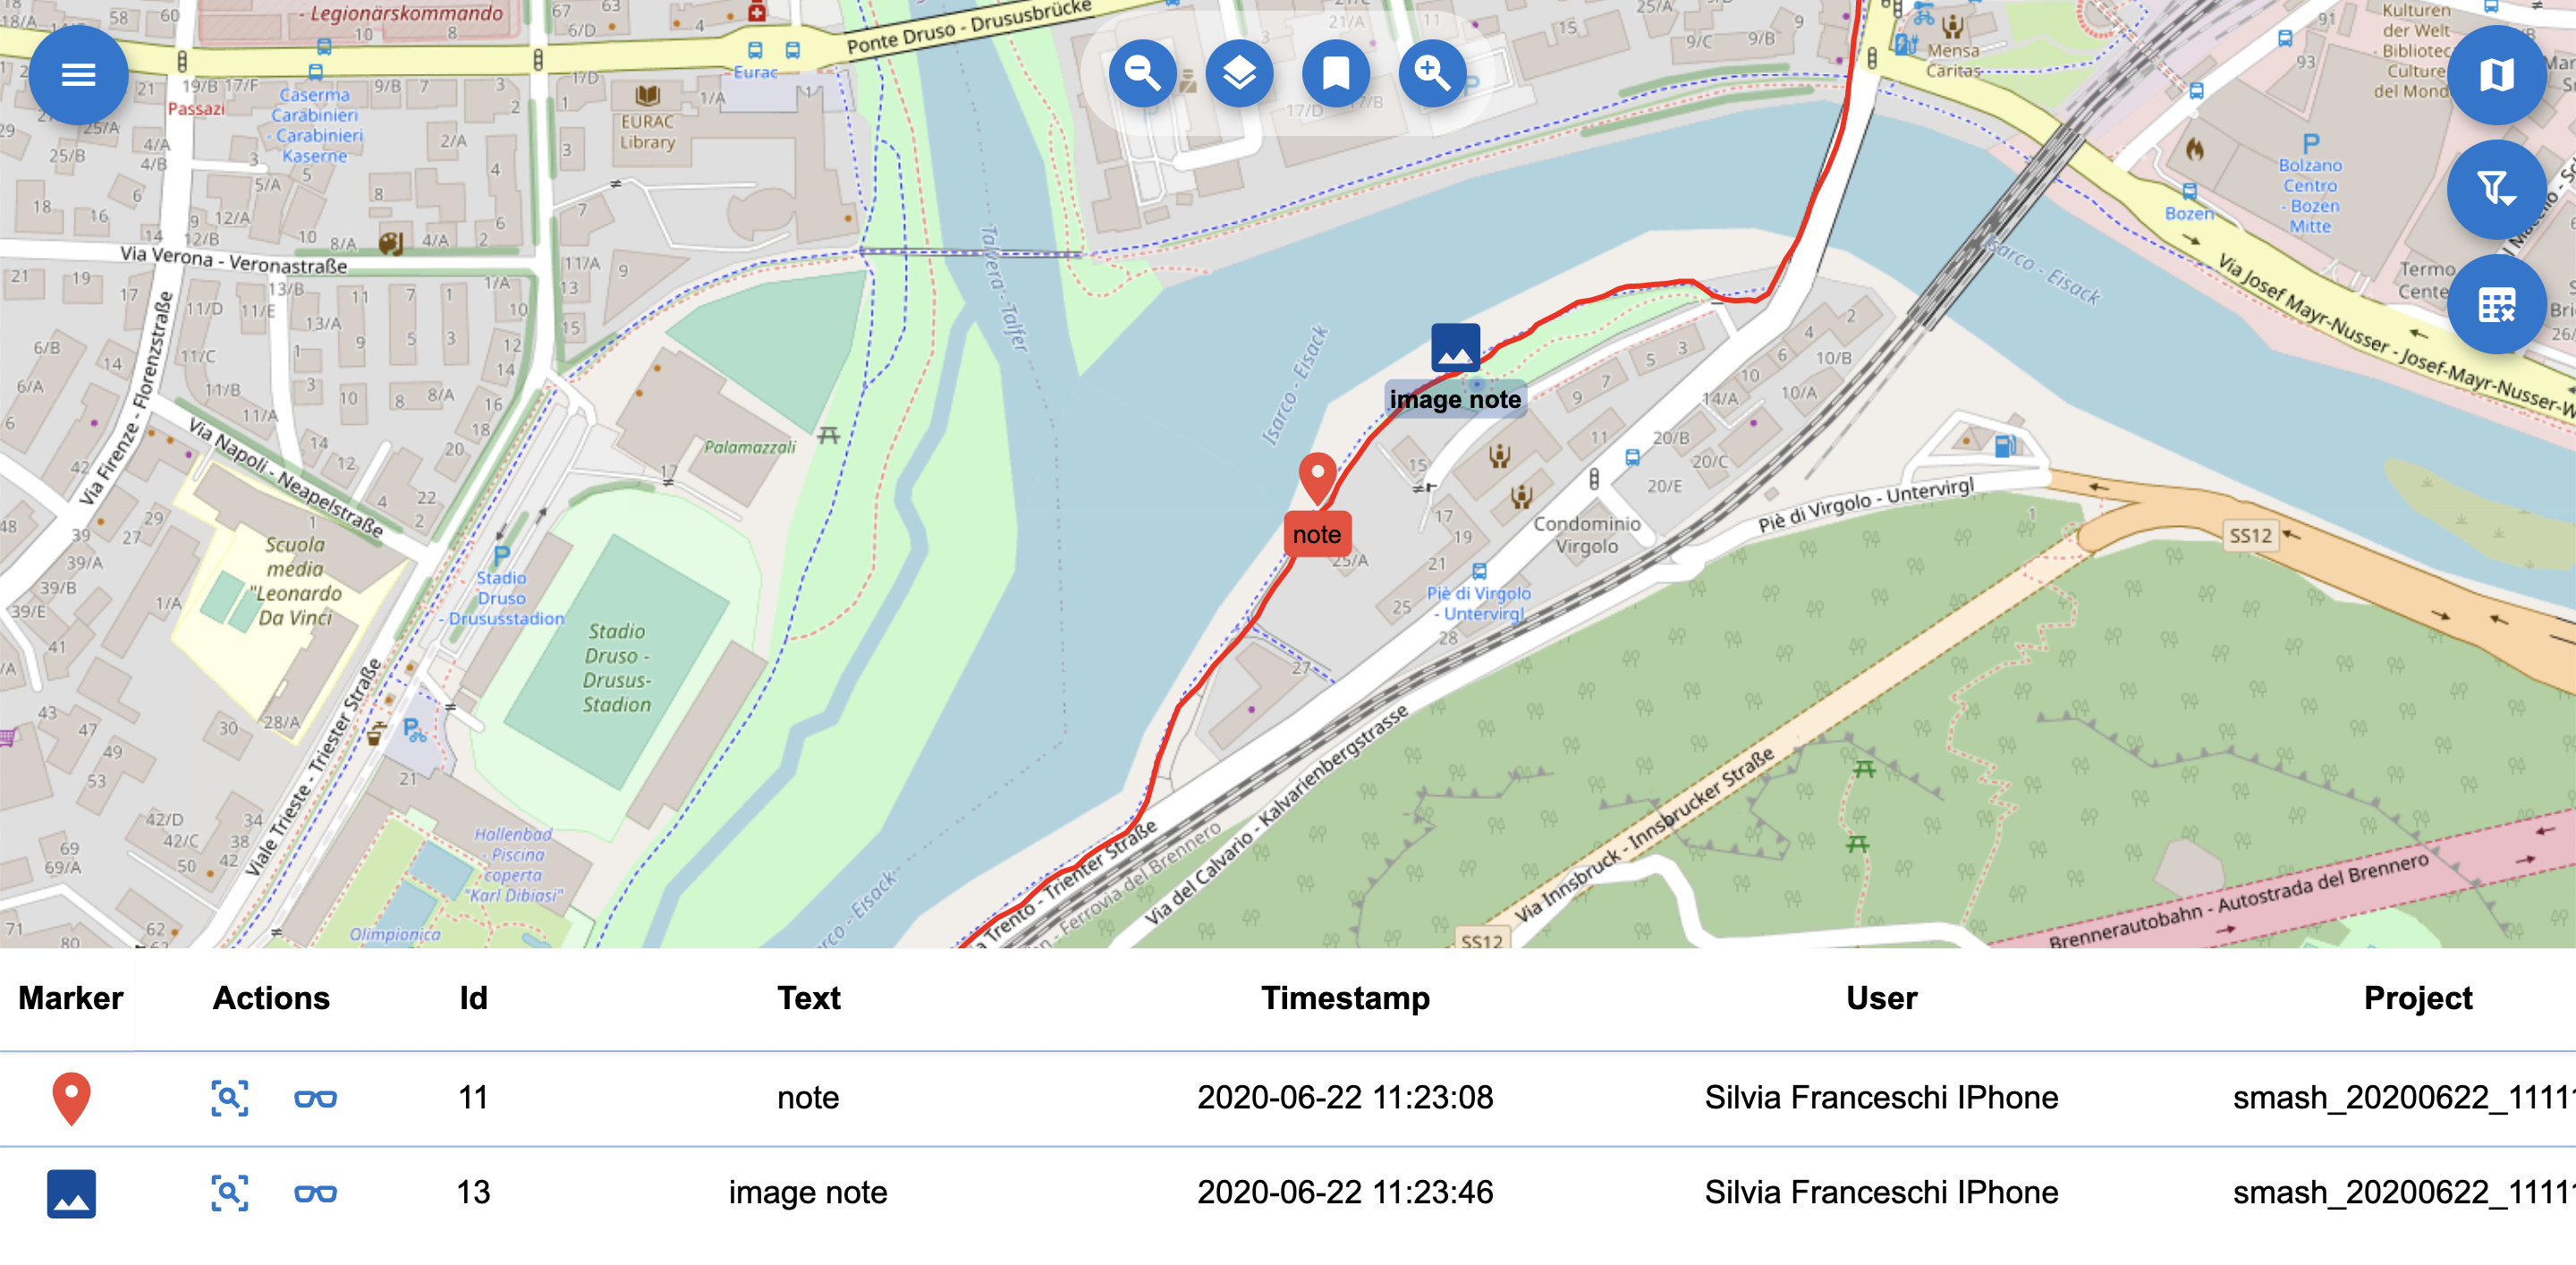
A simple note on the map.
Clicking on it will open a simple dialog with the note information:
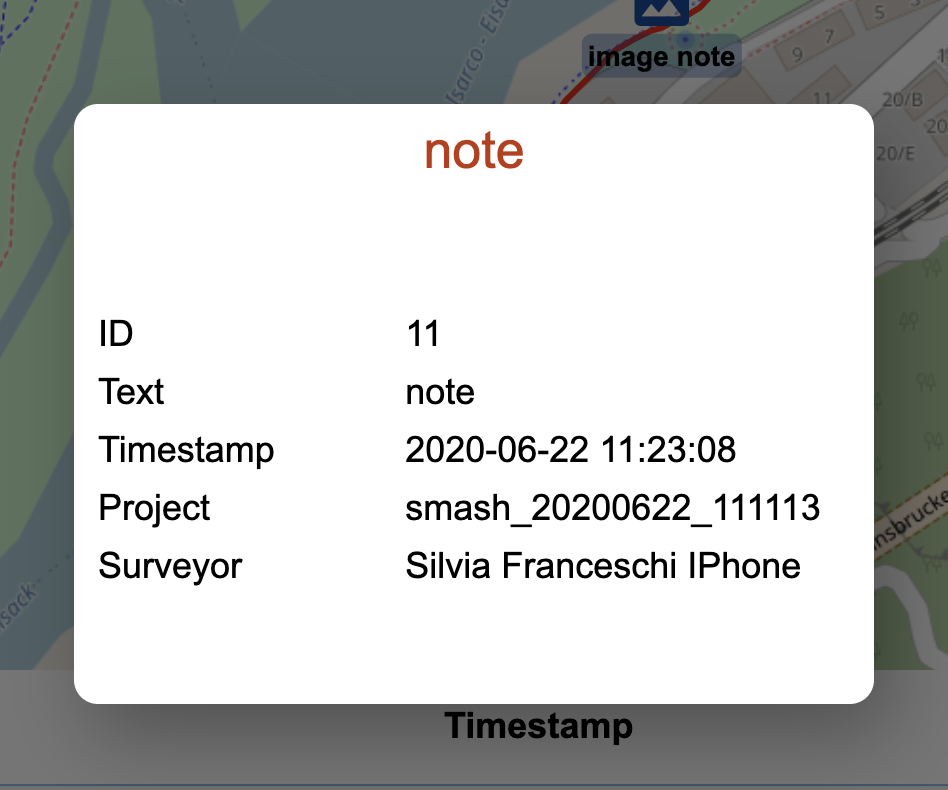
The simple note dialog.
Form notes: Form notes are visible on the map using the icon that has been chosen during the survey with SMASH. If the survey was done with geopaparazzi, which doesn’t support note icons, then a default marker icon is used.
A form note on the map.
Clicking on it will open the form notes dialog we are used to see in SMASH:

The form note dialog.
| In form notes, if images are present, a double click on the thumbnail will open the image. |
Gps Logs: GPS logs are transfered to the server with the properties set by the user in SMASH or geopaparazzi.
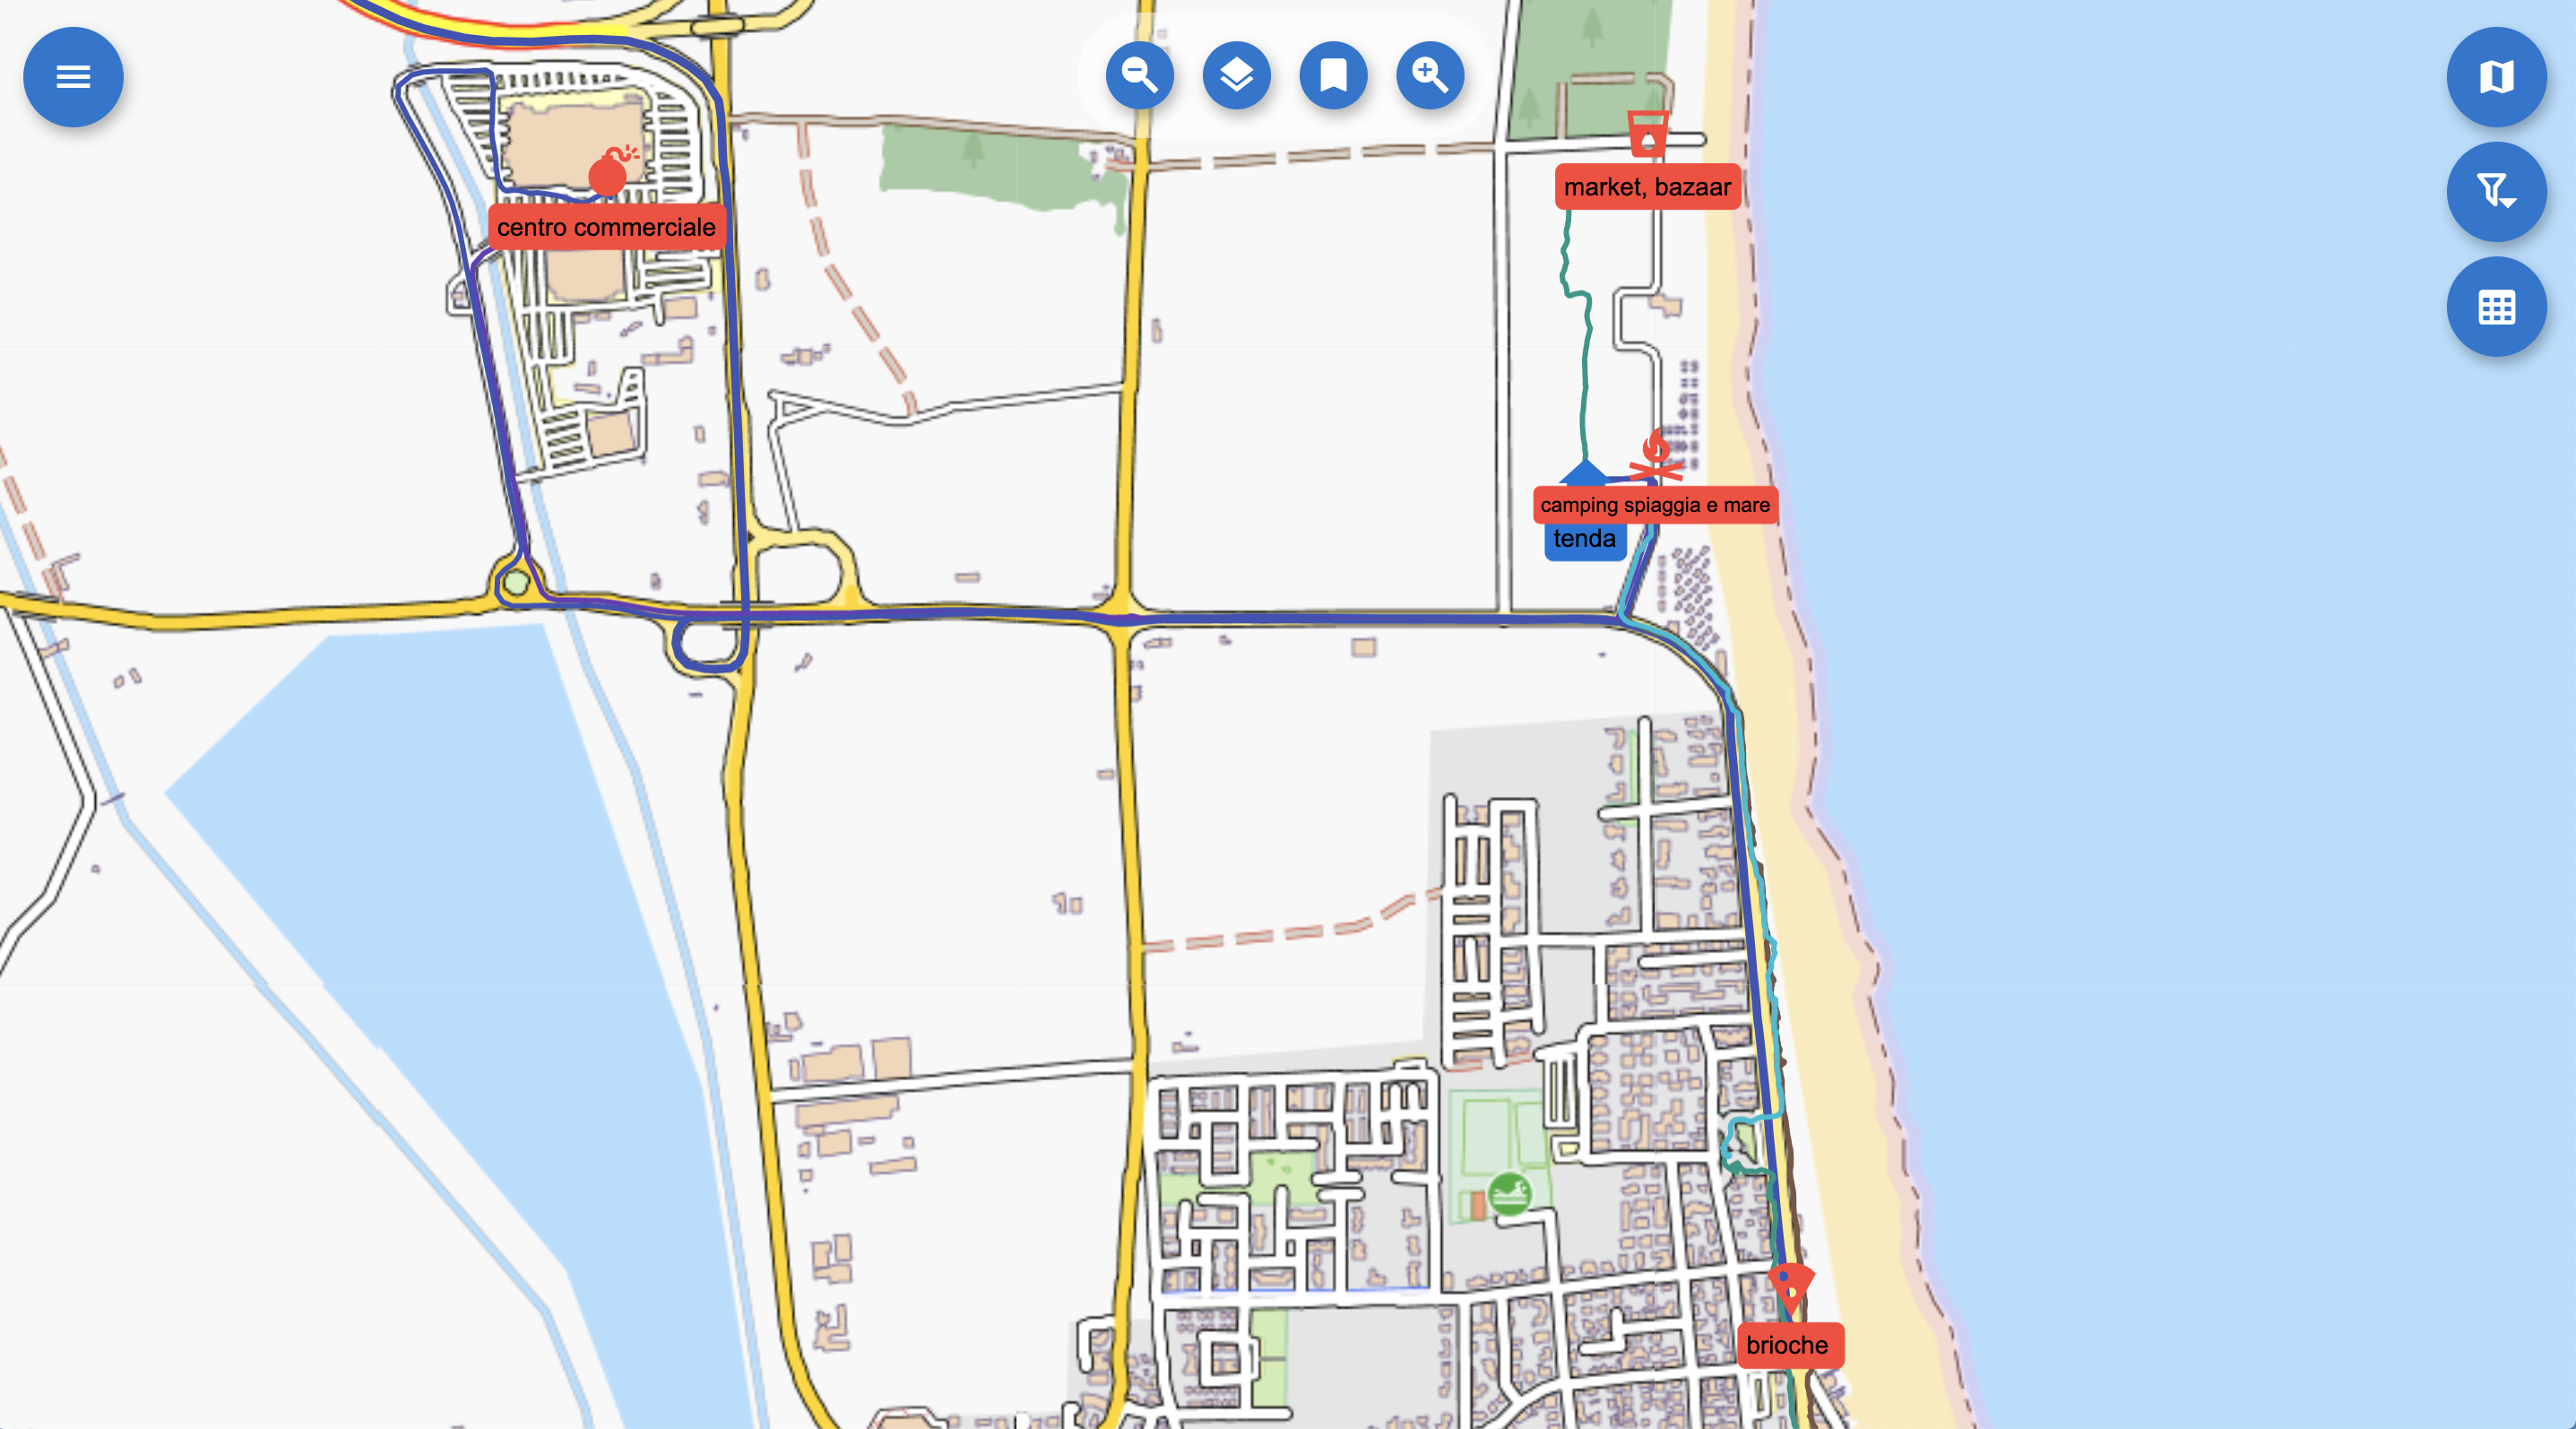
A set of logs on the map.
3.5. The left drawer menu
The upper left menu button opens the drawer:
3.5.1. The Surveyors View
The surveyors view allows to define the devices that are allowed to sync data with the server. Devices are identified by their unique device id. It is possible to set a human readable name to the device/surveyor and a contact.
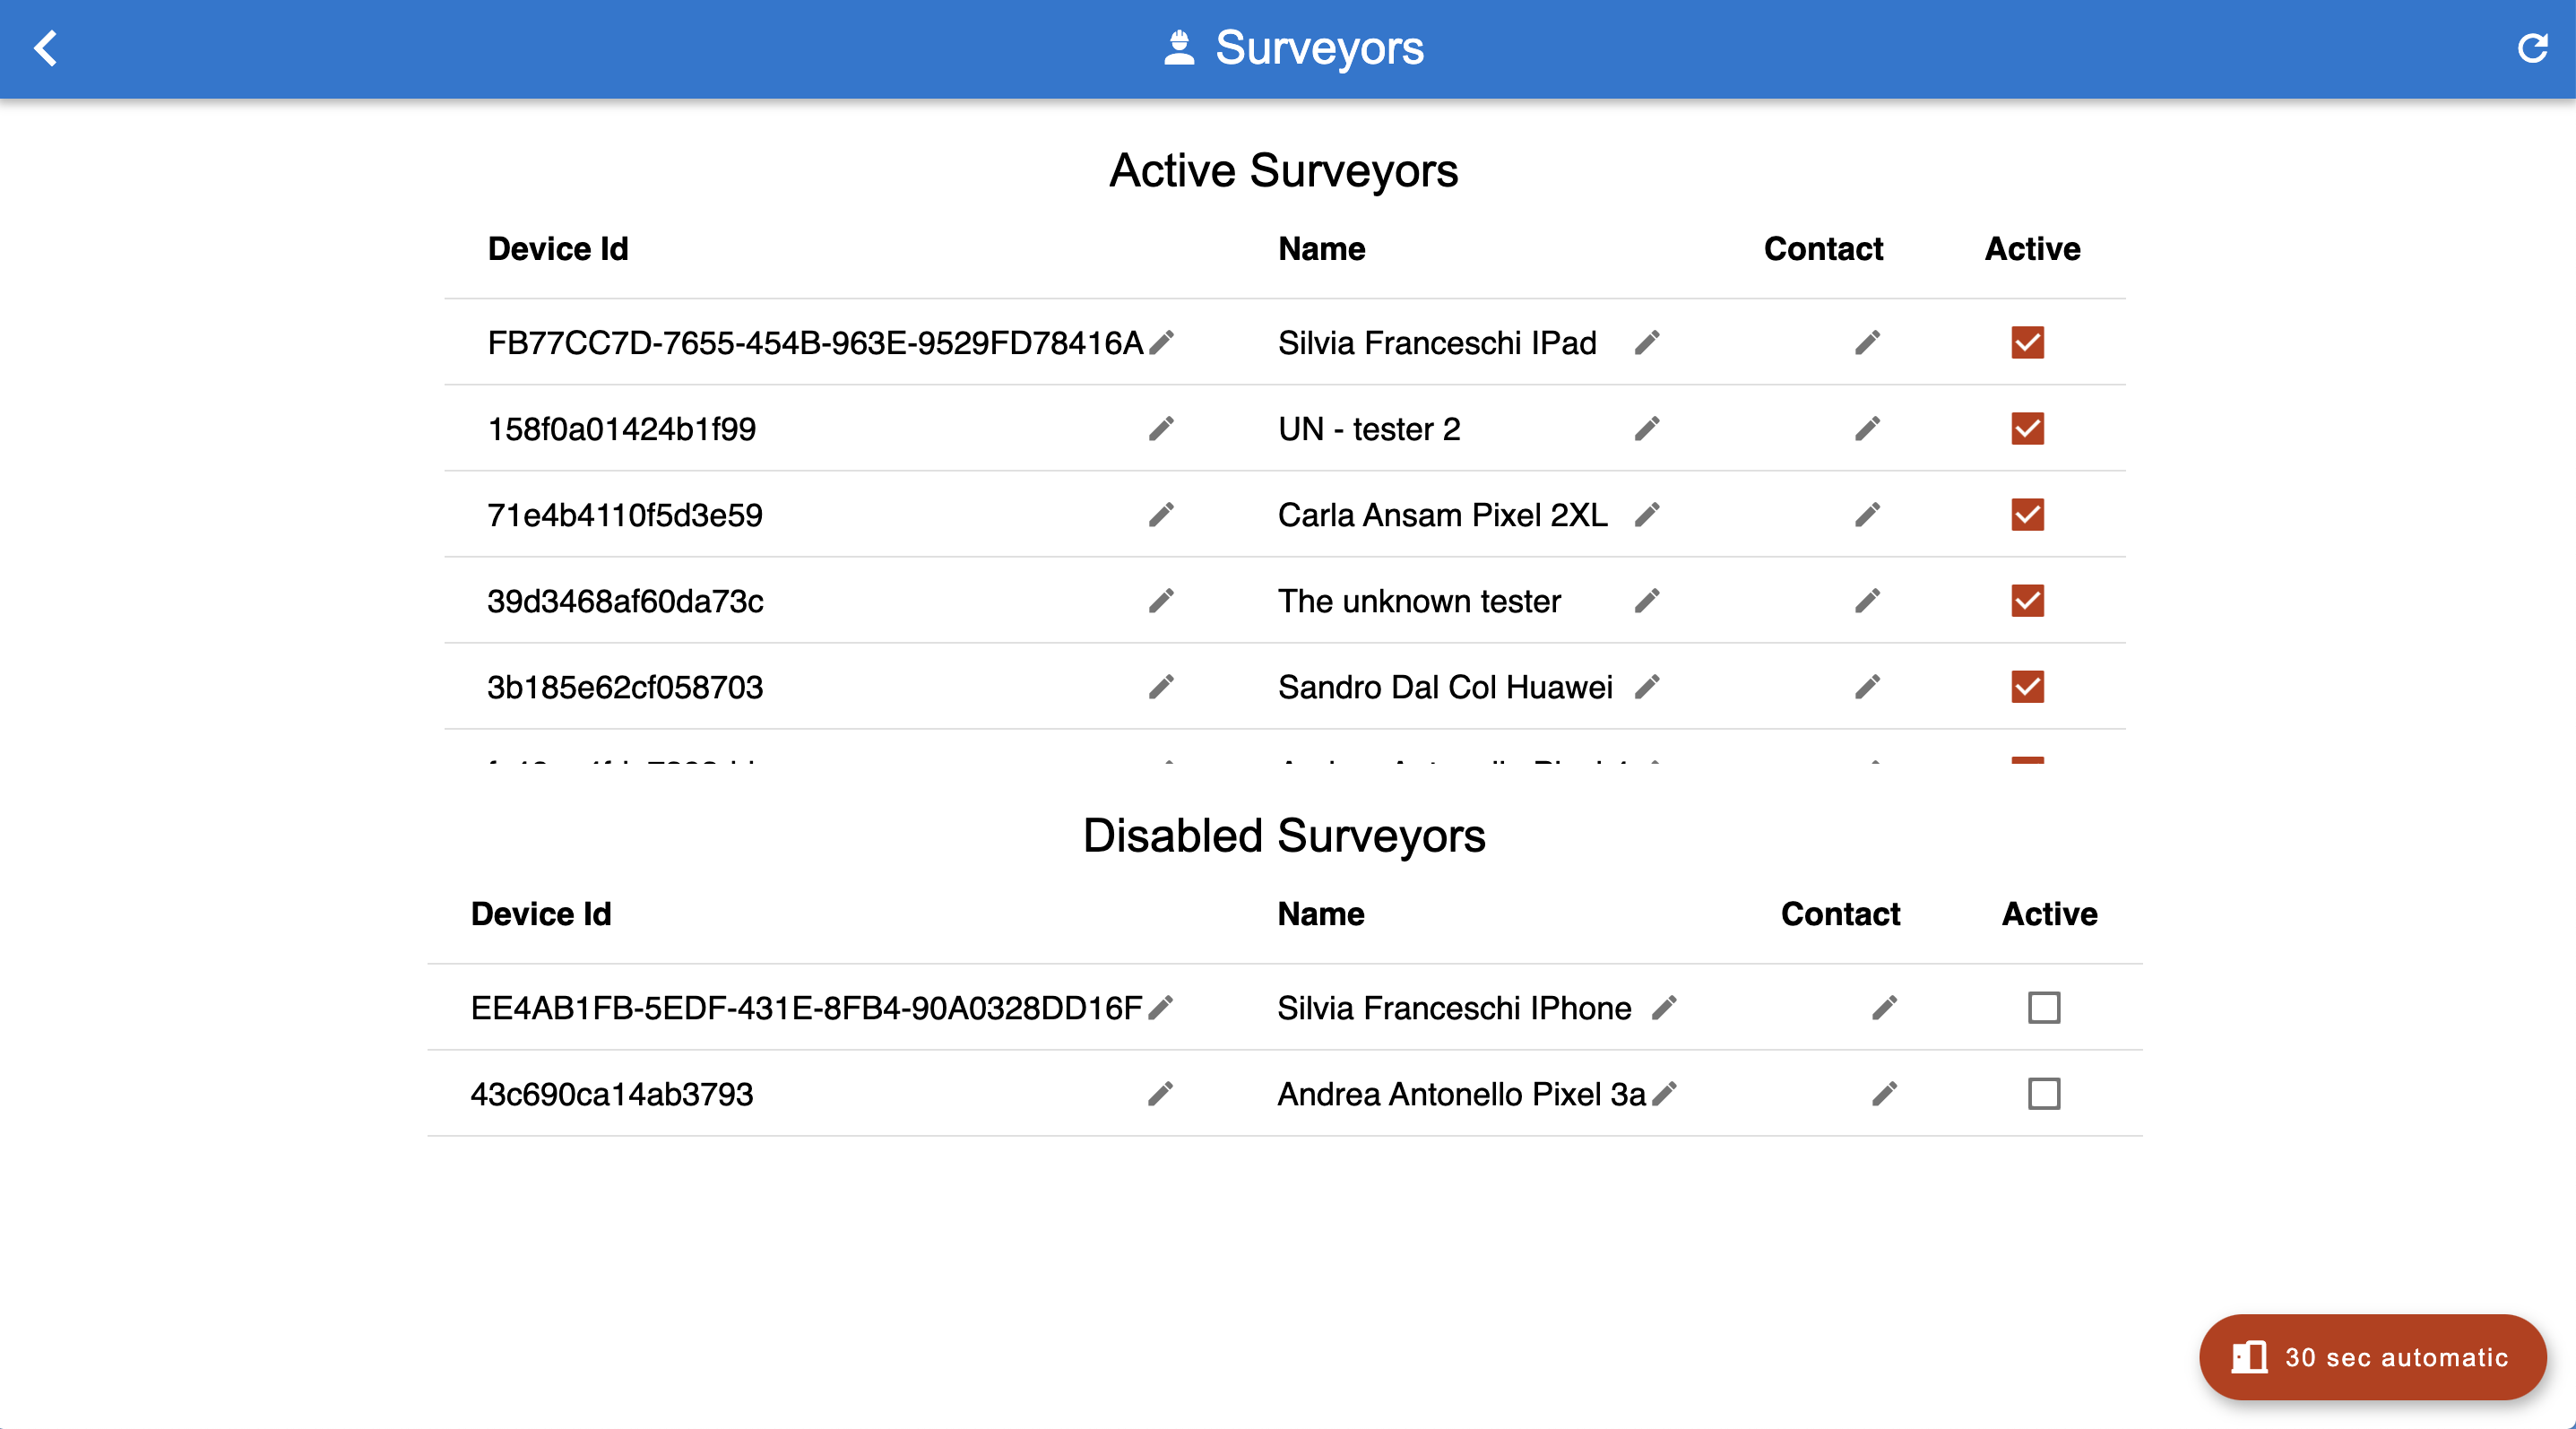
The surveyors view.
Following the idea that it is never good to loose surveyed data, a surveyor can’t be deleted from the server. It is possible to disable him/her. Once disabled the surveyer will end in the disabled list and its data will not be shown in the map and in the filters. It will indeed look like the surveyor has been removed.
To add a new surveyor at the moment we use the 30 seconds magic button approach. Once the button is pushed, for 30 seconds any connecting device will be registered as new surveyor and allowed to sync.
3.5.2. The Webusers View
The webusers view allows us to create, remove and modify web users, i.e. users that can access to the web application (speak: the initial login screen).
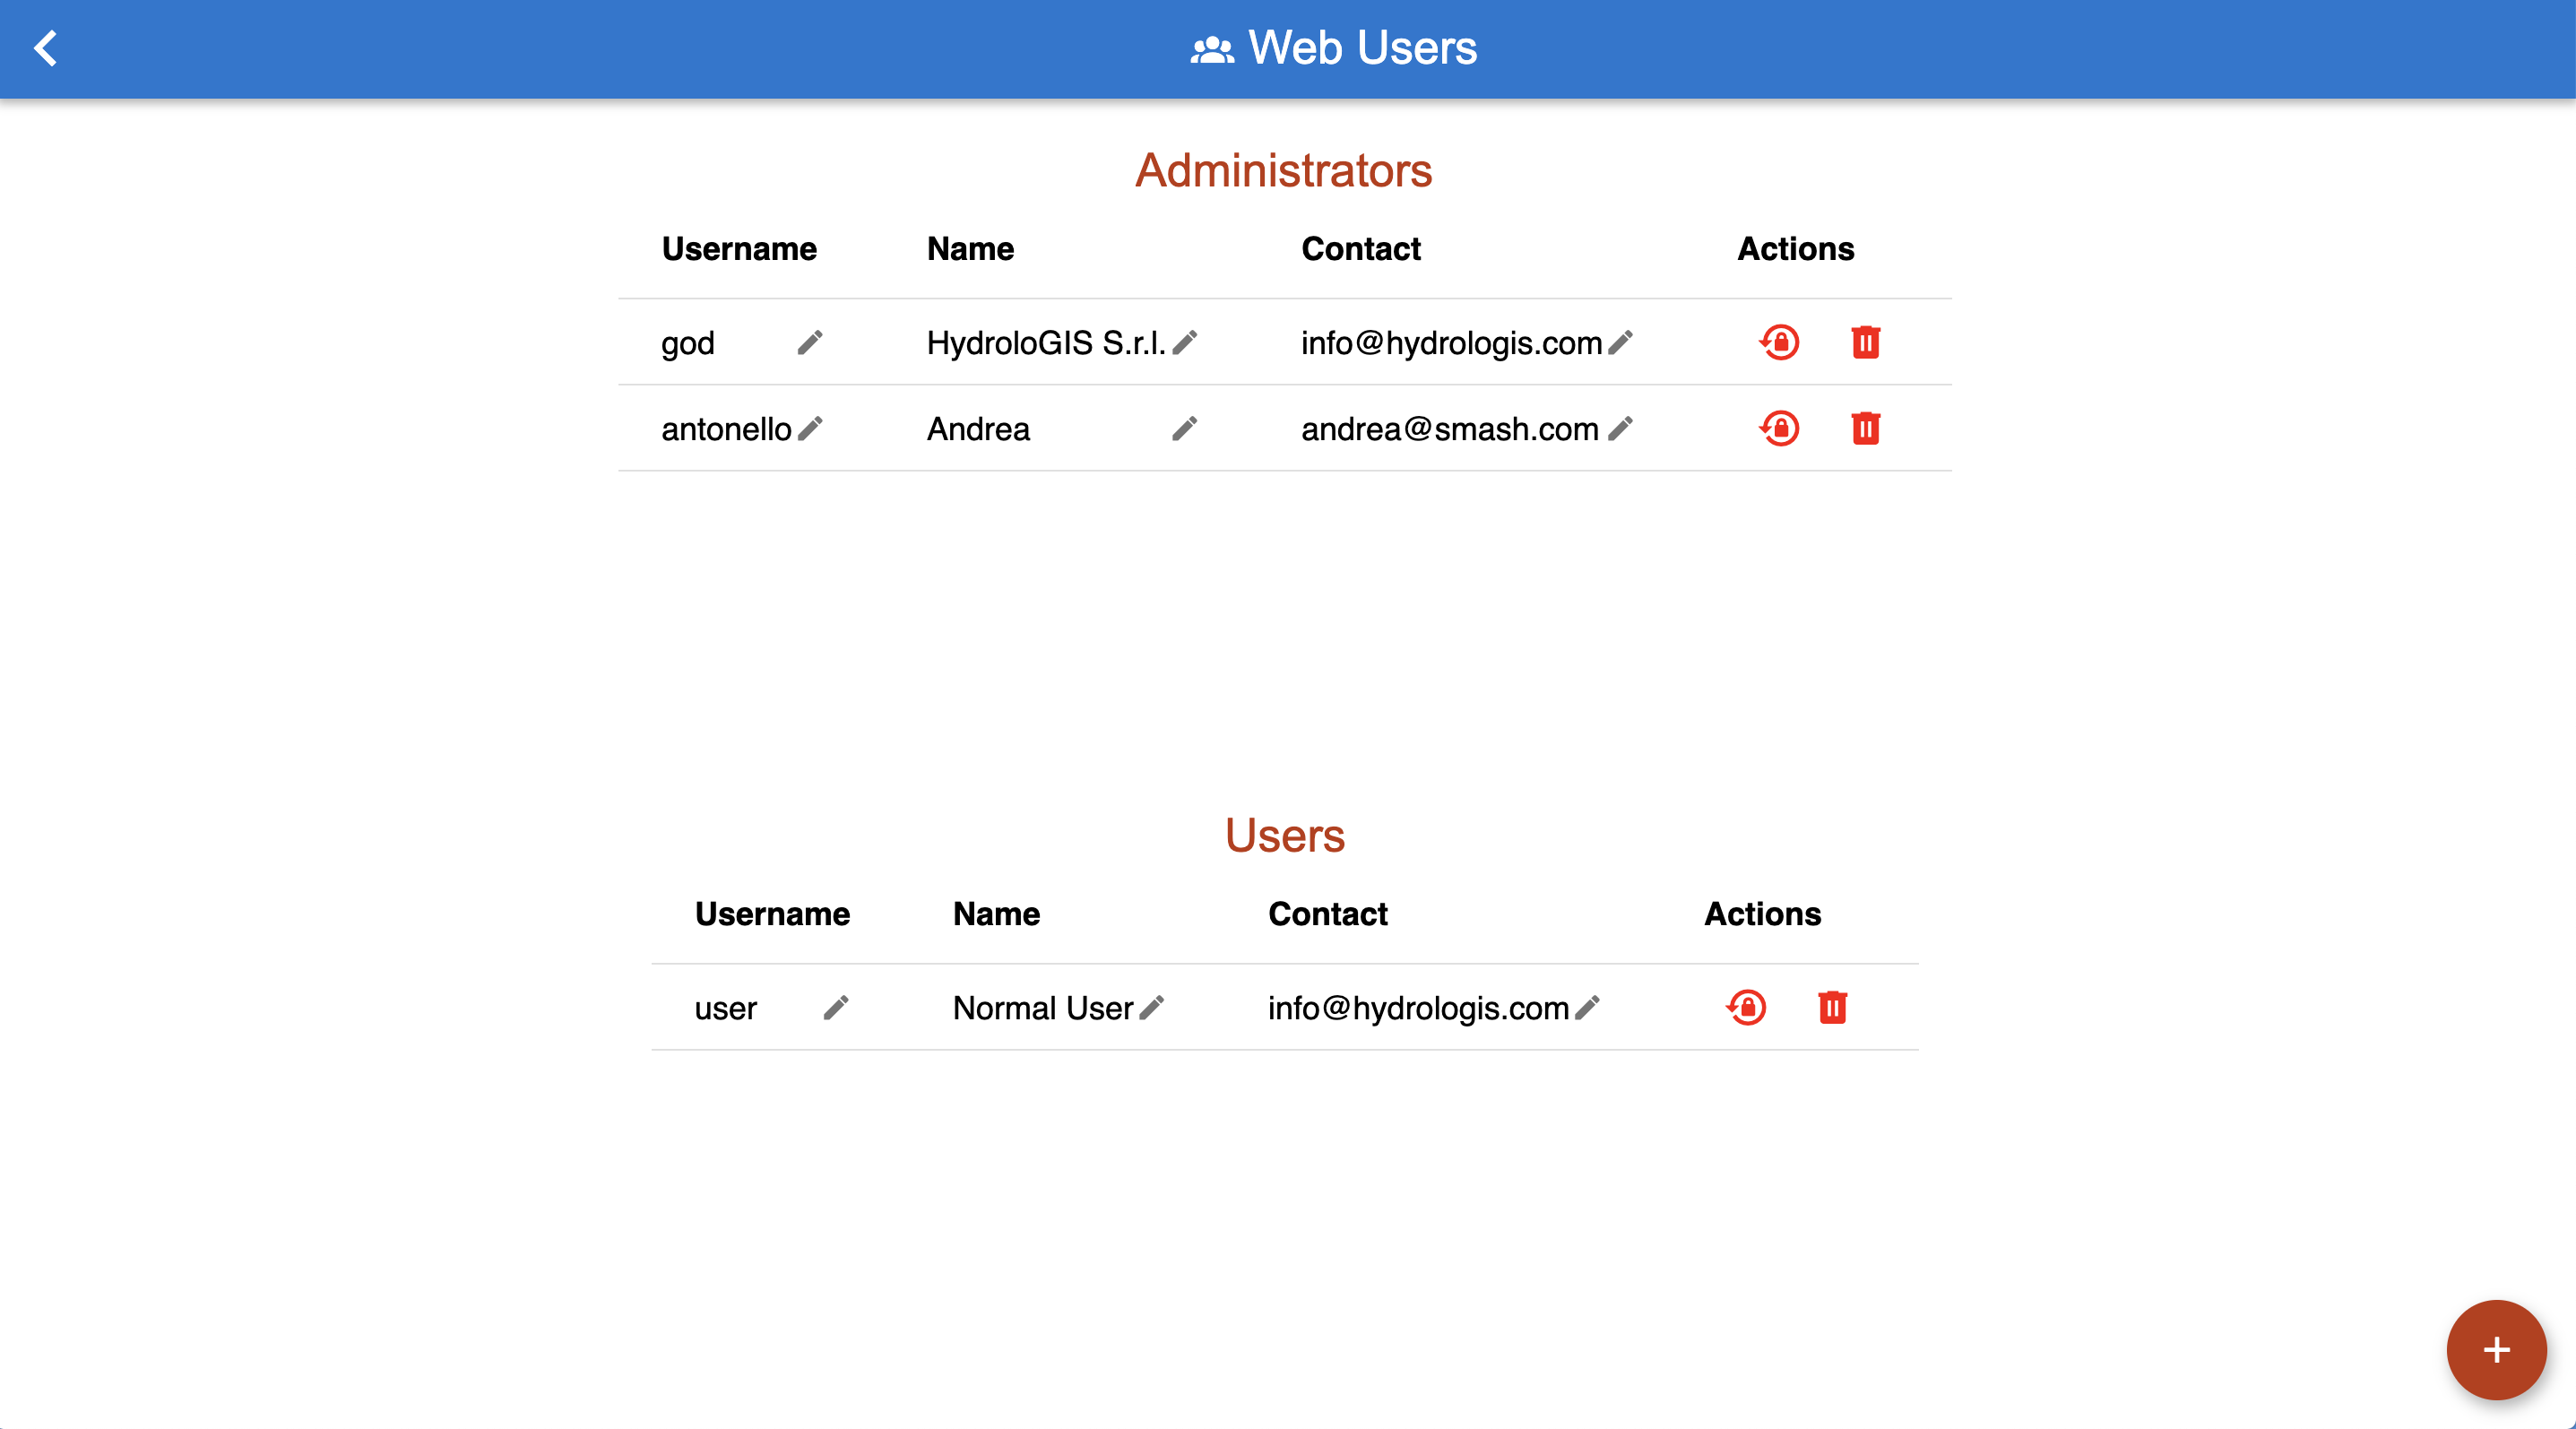
The webusers view.
There are two levels of users: administrators and normal users. They all have access to all the parts of the web application, but normal users are not able to add surveyors, add/remove web users and upload forms for distribution.
To remove a user, the red trash icon can be used, right of the change password button.
To add a new user, the bottom right action button can be used. It opens up a simple dialog that takes the right data for the user creation:
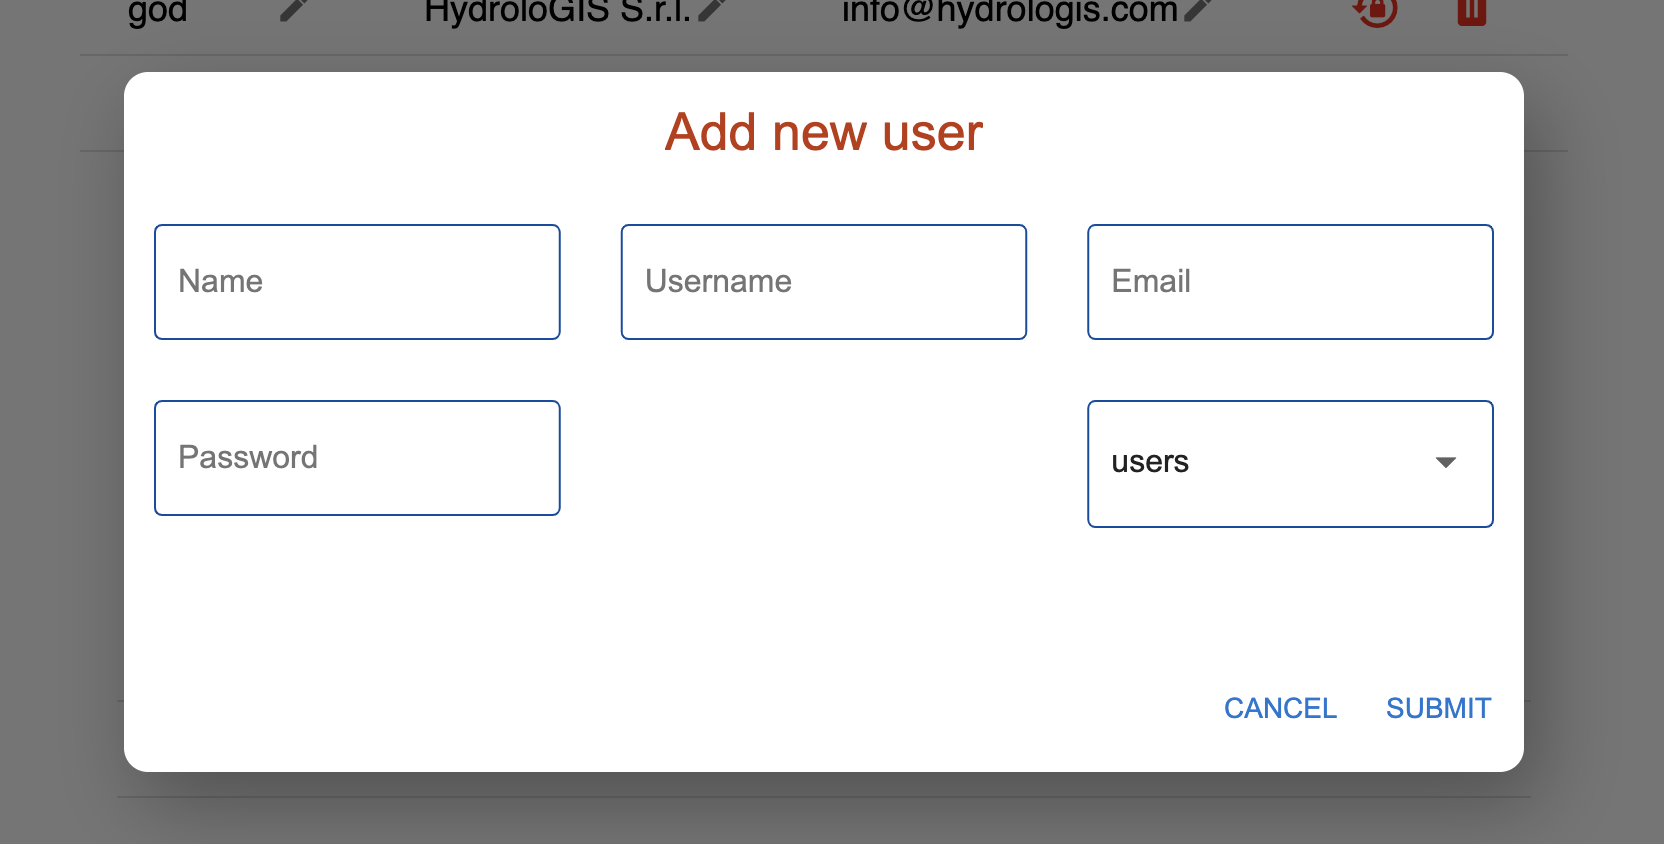
The dialog to add new web users.
3.5.3. The Project Data View
The project data view allows the user to make data available to its surveyors.
Basemaps, projects and custom forms can be loaded into the view. These data will then be available in the GSS import menu of SMASH:
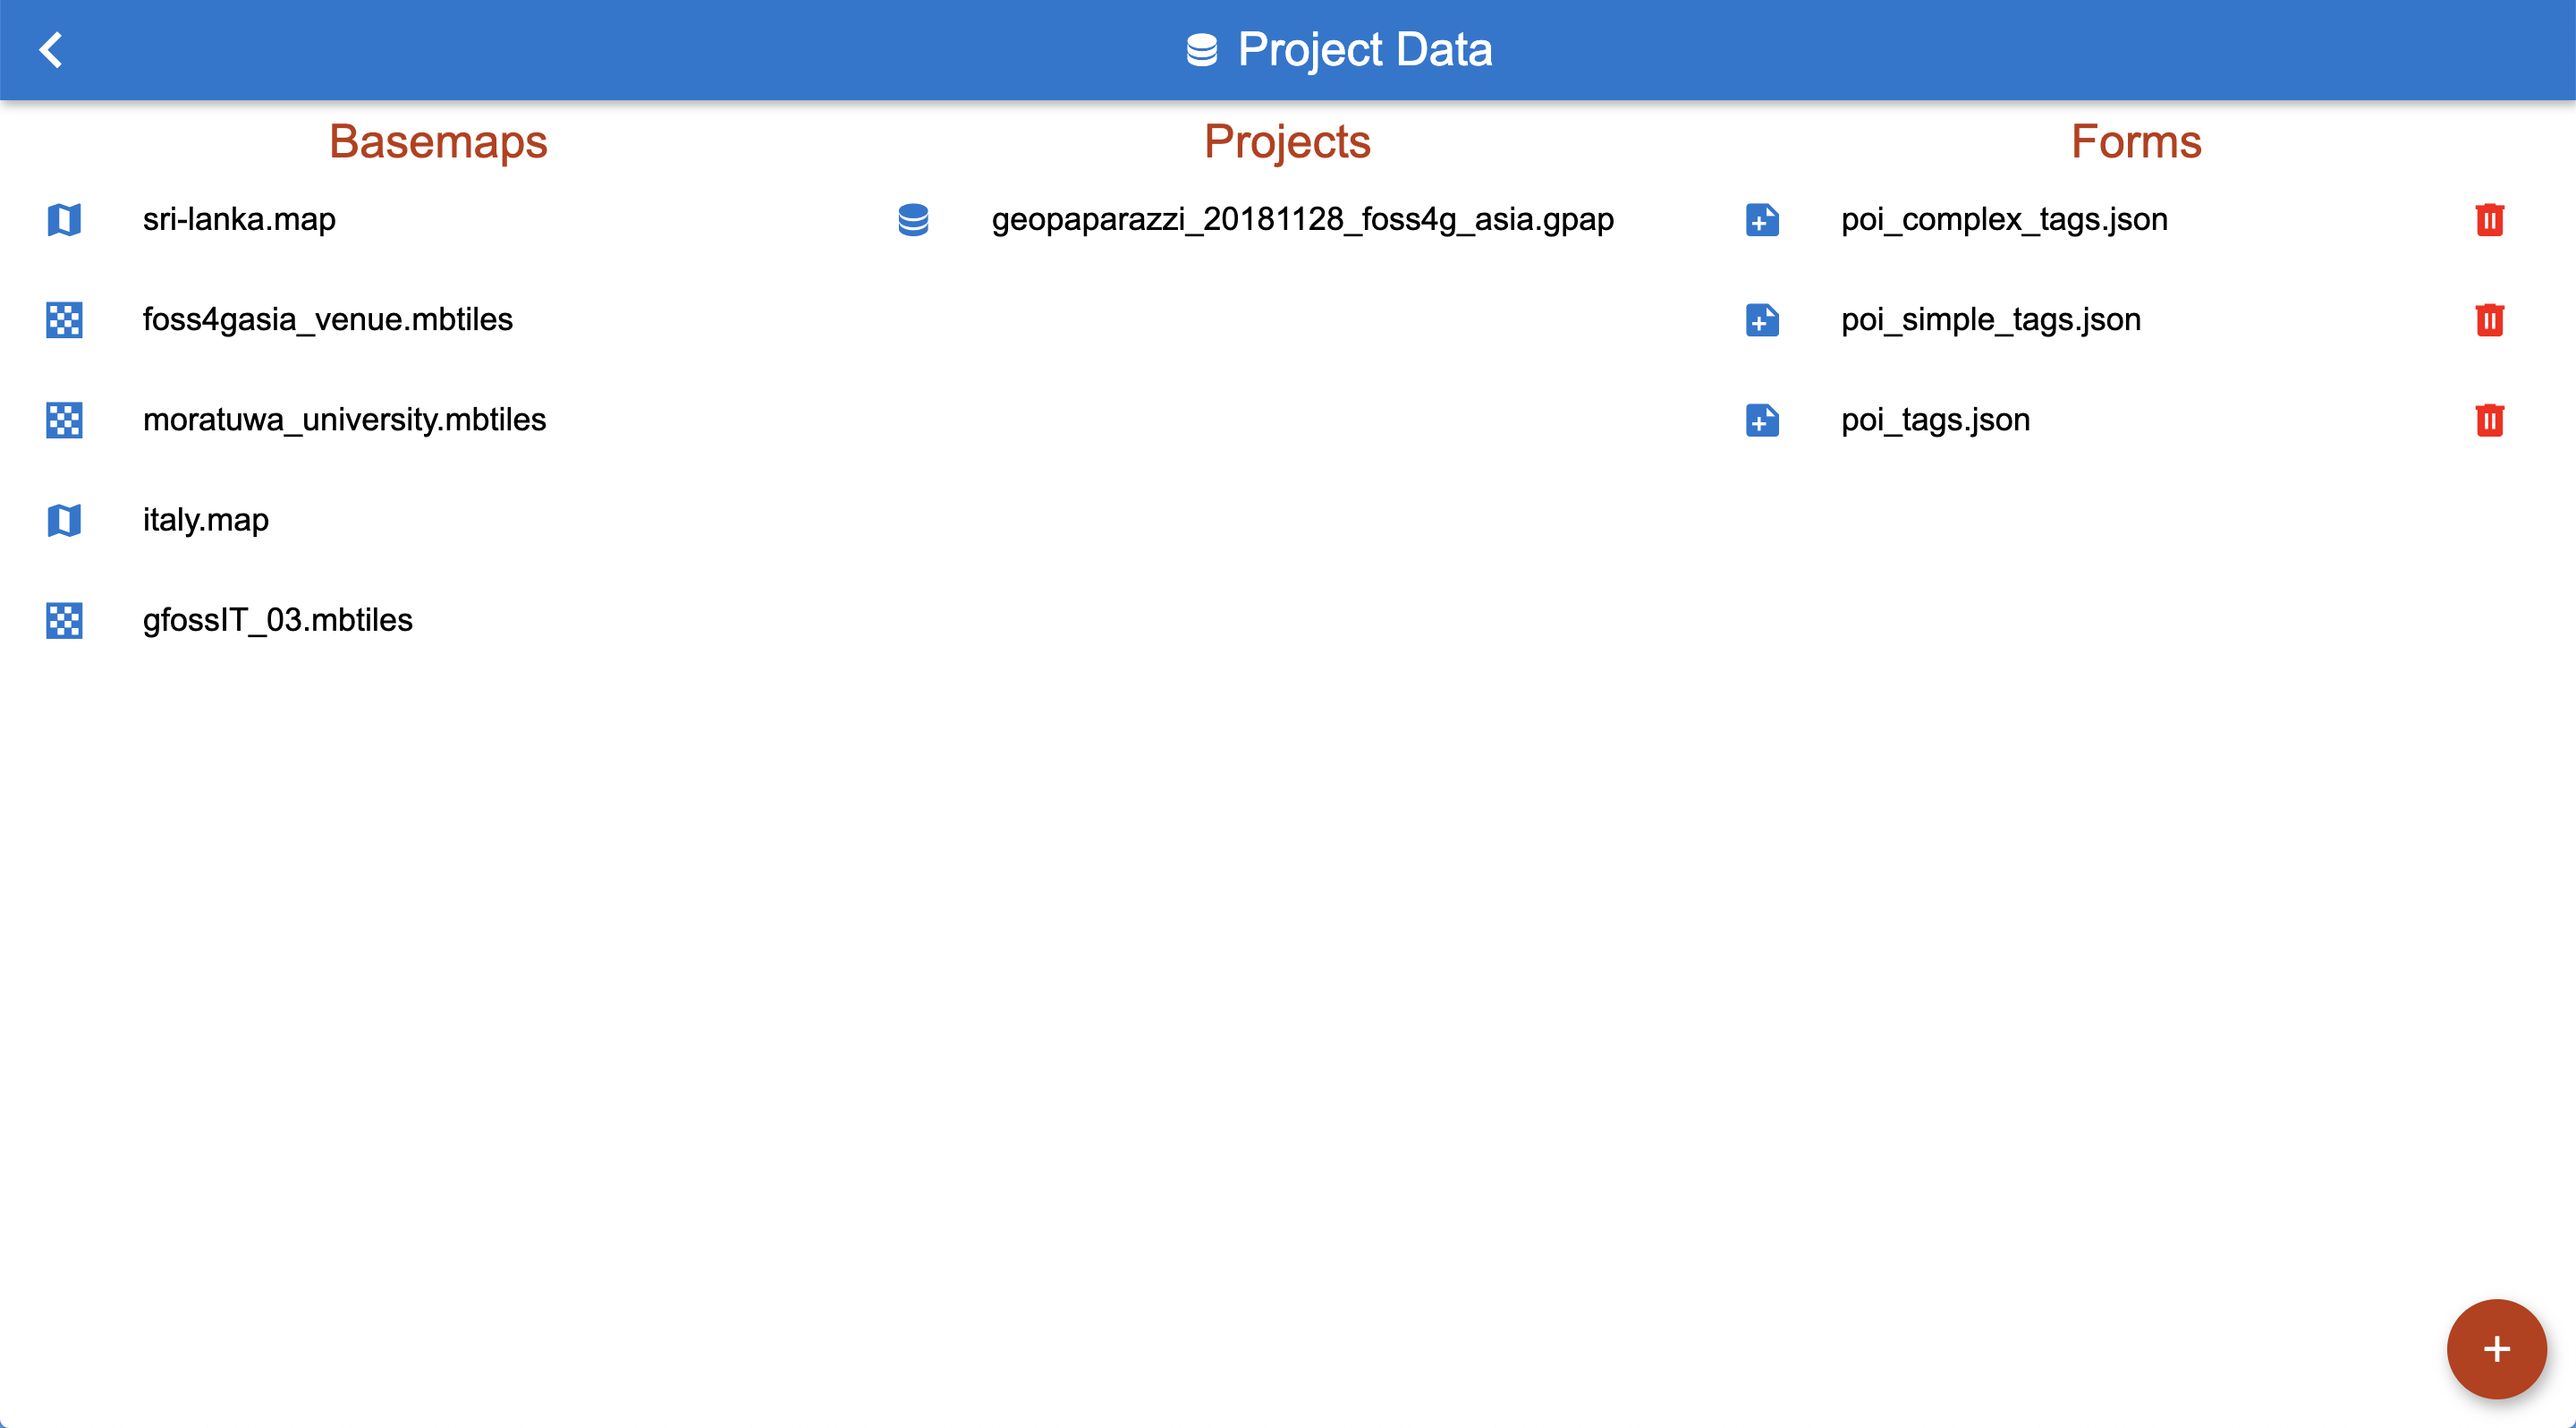
The project data view.
At the current time only forms can be added and removed. The other data types are supposed to be large datasets that are better uploaded by means ot ftp or similar tools.
3.5.4. The About View
Not much to say here:
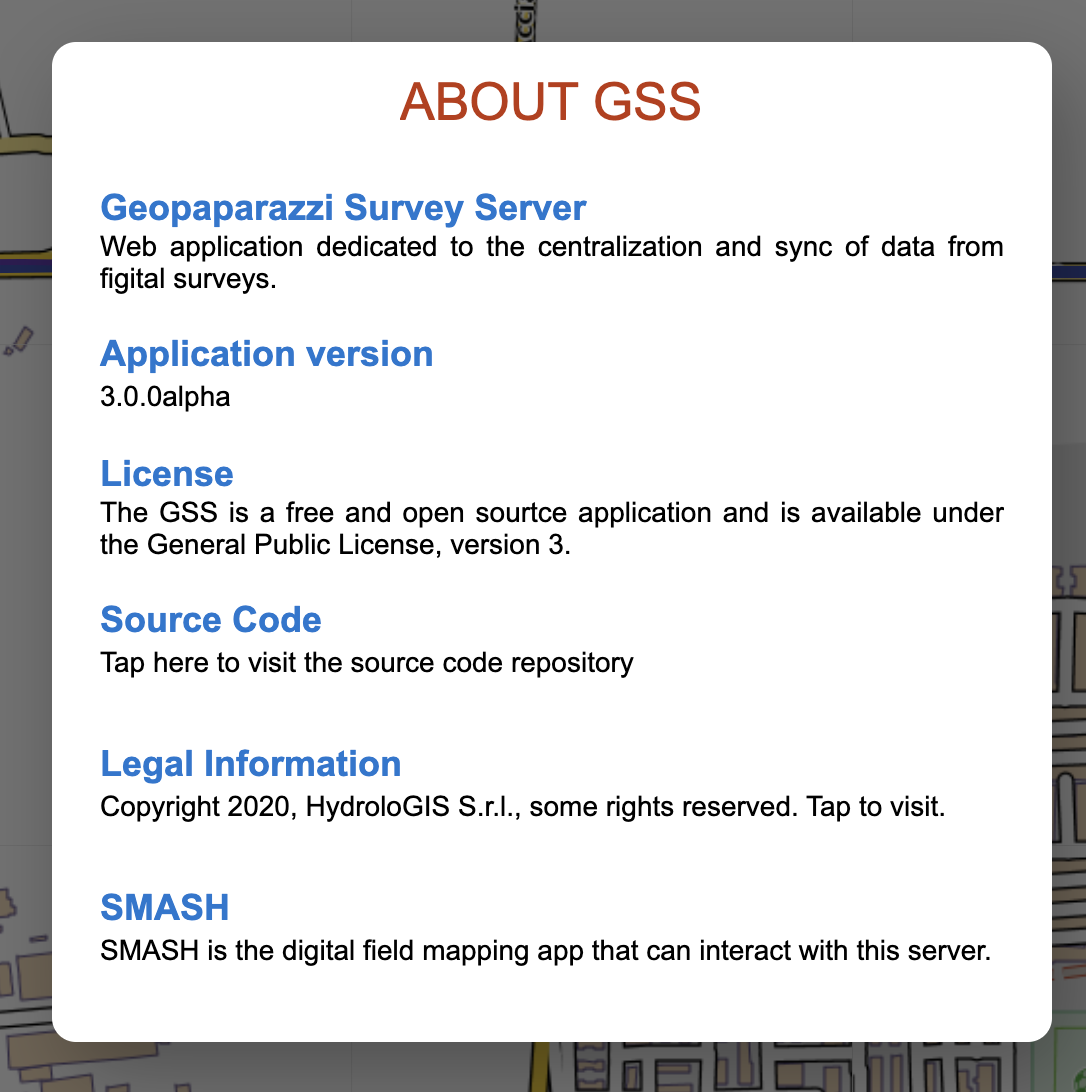
The project data view.
Important information is the License and the link to the source code repository.